4304 N Pine St · Edgemoor, DE
Flood risk 1/10 · Minimal
- FEMA flood zone
- X (unshaded)
- Chance of flooding over 30 yrs
- 0.0%
- Est. flood insurance / yr
- $473 – $860
Fire risk 1/10 · Minimal
- Est. fire insurance / yr
- $476 – $884
Heat risk 7/10 · Major
- Hot days now (above 103°F)
- 7 days/yr
- Hot days in 30 yrs
- 15 days/yr
Wind risk 6/10 · Moderate
- Chance of severe wind over 30 yrs
- 27.0%
Air-quality risk 3/10 · Minor
- Unhealthy air days now
- 2 days/yr
- Unhealthy air days in 30 yrs
- 3 days/yr
Risk factors via First Street. Map © Google.
Why this score? — see what drove the C grade
The composite is a weighted blend of 9 inputs, each scored 0–100. Each bar is that input's sub-score; the figure is the points it added to the 100-point composite (weight × sub-score).
- Cash flow +20.0/30.0
- ARV discount +15.0/15.0
- DSCR +6.3/10.0
- 1% rule +4.6/10.0
- Rent growth +3.9/5.0
- Livability +3.6/5.0
- Schools +3.1/10.0
- Condition / age +2.5/5.0
- Appreciation +0.0/10.0
$169,900
🖨 Deal sheet 📄 Offer letter ✓ Due diligence
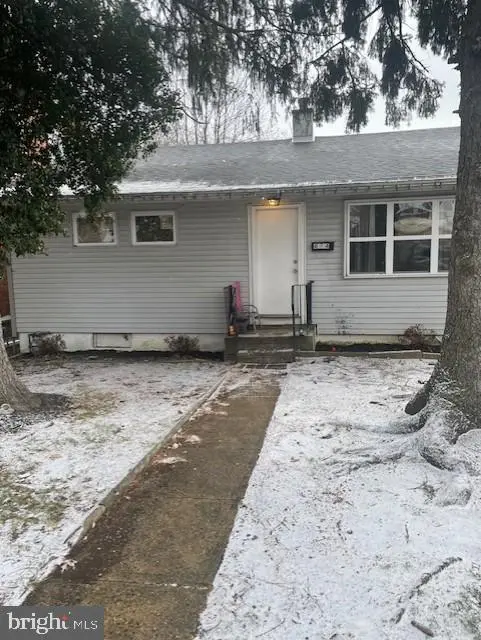
Listing remarks MLS
This single family home has 2 bedrooms and 1 Full Bath and a detached garage . Gas Heater and Hot Water Heater were replaced about 5 years ago. This home also has central air conditioning and updated vinyl windows. Great for a first time buyer.
Key facts
- 3,920 sq ft lot
- Garage
- Built 1953
Neighborhood map
What this means for you Summary
Snapshot
- This is a 2-bed/1.0-bath single-family listed at $170k.
Deal economics
- At list price, monthly cash flow is $207 ($2k/yr) — positive.
- The deal already cash-flows at list — no discount required.
- To meet the 1% rule (rent ≥ 1% of price), the offer needs to be $162k (4.4% below list).
- Recommended offer: $150k (12.0% below list) — sets the bar for market timing.
- Cap rate 7.8% vs local median 3.8% in Edgemoor — top-decile yield for the area; either an underpriced asset or a hidden risk that comps aren't pricing in. Stress-test before assuming the spread holds.
Location & tenants
- Location reads 72/100 on livability (#17 in DE) — a middle-class / working-renter tenant base. Strengths: housing A+, cost of living A; Watch: schools D+, amenities F, commute F.
- Brandywine School District (suburban): math 28% / reading 40% proficiency, ranked #11 of 26 in DE (top 42%) — families likely to look elsewhere, expect single-tenant / working-renter base with shorter leases.
- Market conditions: Rents rising fast (+5.7%/yr); 119 active listings in the ZIP; 25 comparable units currently listed for rent nearby; rentals lingering (median 44d on market — plan ~5-8 weeks vacancy on turnover, expect pricing pressure); 52% of comp listings sitting > 30 days — soft ceiling on asking rent; 1,367 units permitted in New Castle County in 2024 (201 in 5+ unit buildings).
- This rent runs 36% of the median local income ($54k/yr) — at the standard rent-burdened threshold; future hikes will face affordability resistance.
Forward outlook
- Local home prices are declining (-3.0%/yr); year-one equity from $1k of loan paydown is wiped out by about $5k of value loss. Plan a longer hold.
- New Castle County population projected at +9% by 2050 — modest demand growth; plan on rents tracking national, not racing it.
Negotiation context
- It's been on market 236 days — a 12% lower offer ($150k) is reasonable based on typical stale-listing flexibility.
- 4 sale attempts since 22y ago; this cycle's ask has dropped $15k (8%) from the opening price — seller is motivated, your offer sets the floor, not the list.
- Current owner paid $54k; list at $170k implies a 215% gain — meaningful room to come down on a strong offer.
Risks & watch-outs
- Watch-outs: built in 1953 — expect roof / HVAC / electrical / plumbing capex.
- Climate carrying-cost: major wind risk, 27% chance of damaging wind over 30y; extreme-heat days projected 7→15/yr by 2055 (HVAC capex compounding) — expect insurance premiums to compound above CPI over the hold.
Questions for the listing agent
- It's been on market 236 days. Have you received any prior offers? Is the seller open to a 12% concession, seller financing, or rate buy-down credit?
- Built in 1953 — when were the roof, HVAC, electrical panel, plumbing, and water heater last replaced?
- Why hasn't it sold? Are there any deal-killer items the seller is aware of (foundation, flood, title, zoning, code violations)?
- Is there a deadline driving the sale (1031 exchange, divorce, estate, relocation)? That informs how much negotiation room exists.
- Schools are D-rated, which usually means shorter tenancies and higher turnover. Who's the typical renter profile here, and what's been the actual vacancy rate?
- What's the average days-on-market for RENTAL listings here right now (not sales)? A rising rental-DOM trend means longer vacancies and softer asking-rent achievability than the comps imply.
- What's the recent tenant-quality profile in this submarket — average credit score on applications, eviction rate, late-payment / NSF rate, and stable-employment percentage? A property-management company in the area should have these aggregated.
- How much new for-sale + rental construction is in the pipeline within 1–3 miles? Heavy new supply typically softens prices + rents 12–24 months out; constrained supply supports both.
Investment metrics
- 1% rule
- 0.96% ✗
- Cap rate
- 7.76%
- Cash-on-cash
- 5.23%
- DSCR
- 1.23
- GRM
- 8.7
CMA / ARV
- ARV (median comp)
- $296,053
- List price
- $169,900
- Delta
- -42.61%
- Verdict
- UNDERPRICED
- Comps
- 5 within 1.0 mi
Projected returns pro-forma
-3.0% appreciation · 5.72% rent growth · sell at horizon
- IRR
- -5.4%
- Equity multiple
- 0.79×
- Total profit
- $-9,787
- Equity at exit
- $25,333
- IRR
- 7.1%
- Equity multiple
- 1.59×
- Total profit
- $28,166
- Equity at exit
- $14,690
Cash invested: $47,572 (down + closing). Projections, not guarantees.
Landlord ↔ Tenant lean methodology
- Overall (STATE)
- 70 Landlord-Friendly
- State Delaware
- 70 Landlord-Friendly · D+7
- County
- — inherits STATE
- City
- — inherits STATE
ZIP-level market 19802
- Rents YoY
- 5.7%
- Active inventory
- 119
- Price-to-rent
- 8.7×
Monthly cashflow live
- Estimated rent
- $1,625 high interval (Pro) →
- Mortgage (P&I)
- −$891
- Tax from tax record
- −$115 /mo · $1,374/yr
- Insurance
- −$71
- HOA
- −$0
- Vacancy / Maint / Mgmt
- −$341
- Net cashflow
- $207
Break-even live
UW: 25.0% down · 7.5% · 30yr · 1.5% tax · 5.0% vac · 8.0% maint · 8.0% mgmt
Financing live
Cash to close
- Down payment
- $42,475
- Closing costs
- $5,097
- Reserves months
- —
- Total cash needed
- —
Loan-product check · same deal, 3 products live
Conventional
25% down · 7.5% · 30yr
- Down + closing
- —
- Monthly P&I
- —
- Monthly cashflow
- —
- DSCR
- —
- Eligible?
- —
Personal DTI + credit; lowest rate.
DSCR
20% down · 8.5% · 30yr
- Down + closing
- —
- Monthly P&I
- —
- Monthly cashflow
- —
- DSCR
- —
- Eligible?
- —
No personal income docs; deal must DSCR.
Hard money
10% down · 12.0% · 12mo
- Down + closing
- —
- Monthly P&I
- —
- Monthly cashflow
- —
- DSCR
- —
- Eligible?
- —
Short-term bridge; refi at stabilization.
Rent comps 25 comps
| Address | Beds | Baths | Sqft | Rent | $/sqft | DOM | Units | Dist |
|---|---|---|---|---|---|---|---|---|
| 201 Philadelphia Pike Unit 216 Wilmington, DE | 2.0 | 1.0 | 850 | $1,400 | $1.65 | 44d | 1 | 0.30mi |
| 201 1/2 Philadelphia Pike #326 Wilmington, DE | 2.0 | 1.0 | 779 | $1,595 | $2.05 | 44d | 1 | 0.33mi |
| 2 Colony Blvd Wilmington, DE | 1.0–2.0 | 1.0–2.0 | 1112 | $2,500 | $2.25 | 1d | 6 | 0.34mi |
| 310 Shipley Rd Wilmington, DE | 2.0 | 2.0 | 1010 | $1,722 | $1.71 | 1d | 2 | 0.35mi |
| 608 W Lea Blvd Wilmington, DE | 1.0–2.0 | 1.0 | 825 | $1,500 | $1.82 | 44d | 1 | 0.70mi |
| 164 Paladin Dr Wilmington, DE | 1.0 | 1.0 | 600 | $1,400 | $2.33 | 44d | 1 | 0.72mi |
| 2705 Speakman Pl Wilmington, DE | 3.0 | 1.5 | 1100 | $1,975 | $1.80 | 13d | 1 | 0.87mi |
| 108 E 28th St Wilmington, DE | 1.0 | 1.0 | 600 | $1,325 | $2.21 | 24d | 1 | 0.88mi |
| 4310 Miller Rd Wilmington, DE | 1.0 | 1.0 | 650 | $1,409 | $2.17 | 44d | 1 | 0.89mi |
| 2601 N Heald St Wilmington, DE | 3.0 | 1.0 | 1025 | $1,795 | $1.75 | 1d | 1 | 0.92mi |
| 400 W 29th St Wilmington, DE | 3.0 | 1.5 | 1125 | $1,950 | $1.73 | 44d | 1 | 0.92mi |
| 3408 Miller Rd Wilmington, DE | 1.0–2.0 | 1.0–2.0 | 889 | $1,775 | $2.00 | 5d | 6 | 0.95mi |
| 800 Brandywine Blvd Wilmington, DE | 2.0 | 1.0 | 950 | $1,600 | $1.68 | 44d | 1 | 1.05mi |
| 103 E 24th St Unit 1 Wilmington, DE | 3.0 | 1.0 | 1025 | $1,795 | $1.75 | 44d | 1 | 1.07mi |
| 1204 Terra Hill Dr Wilmington, DE | 2.0 | 1.5 | 1000 | $1,610 | $1.61 | 1d | 6 | 1.11mi |
| 312 Concord Ave Unit 1 Wilmington, DE | 1.0 | 1.0 | 600 | $1,195 | $1.99 | 44d | 1 | 1.25mi |
| 312 Concord Ave Unit 2 Wilmington, DE | 2.0 | 1.0 | 700 | $1,295 | $1.85 | 24d | 1 | 1.25mi |
| 306 Concord Ave Unit 2 Wilmington, DE | 3.0 | 1.0 | 1100 | $1,350 | $1.23 | 44d | 1 | 1.25mi |
| 1121 Rosedale Ave Unit 2 Wilmington, DE | 2.0 | 1.0 | 1000 | $1,750 | $1.75 | 44d | 1 | 1.27mi |
| 918 E 17th St Unit 1 Wilmington, DE | 3.0 | 1.0 | 1100 | $1,795 | $1.63 | 1d | 1 | 1.28mi |
| 6 W 20th St Wilmington, DE | 2.0 | 1.0 | 650 | $1,395 | $2.15 | 44d | 1 | 1.39mi |
| 409 W 20th St Unit 2 Wilmington, DE | 2.0 | 1.0 | 1100 | $1,500 | $1.36 | 13d | 1 | 1.42mi |
| 409 W 20th St Unit 2 Wilmington, DE | 2.0 | 1.0 | 1100 | $1,700 | $1.55 | 10d | 1 | 1.42mi |
| 604 W 20th St Unit 2 Wilmington, DE | 2.0 | 1.0 | 900 | $1,195 | $1.33 | 24d | 1 | 1.47mi |
| 608 W 20th St Wilmington, DE | 2.0 | 1.0 | 800 | $1,400 | $1.75 | 44d | 1 | 1.48mi |
Listing history 16 events
-
2026-06-03days on market $169,900 Active 236 DOM
-
2026-06-02days on market $169,900 Active 235 DOM
-
2026-06-01days on market $169,900 Active 234 DOM
-
2026-05-31days on market $169,900 Active 233 DOM
-
2026-03-19price $169,900 246-char remark
Show marketing remark (246 chars)
This single family home has 2 bedrooms and 1 Full Bath and a detached garage . Gas Heater and Hot Water Heater were replaced about 5 years ago. This home also has central air conditioning and updated vinyl windows. Great for a first time buyer.
-
2026-01-21price $175,000 246-char remark
Show marketing remark (246 chars)
This single family home has 2 bedrooms and 1 Full Bath and a detached garage . Gas Heater and Hot Water Heater were replaced about 5 years ago. This home also has central air conditioning and updated vinyl windows. Great for a first time buyer.
-
2025-10-11$185,000 Active 246-char remark
Show marketing remark (246 chars)
This single family home has 2 bedrooms and 1 Full Bath and a detached garage . Gas Heater and Hot Water Heater were replaced about 5 years ago. This home also has central air conditioning and updated vinyl windows. Great for a first time buyer.
-
2025-10-04historical $185,000 246-char remark
Show marketing remark (246 chars)
This single family home has 2 bedrooms and 1 Full Bath and a detached garage . Gas Heater and Hot Water Heater were replaced about 5 years ago. This home also has central air conditioning and updated vinyl windows. Great for a first time buyer.
-
2009-05-20historical
-
2008-12-16$119,900
-
2004-08-31historical
-
2004-07-13historical
-
2004-07-12$89,900
-
2004-06-24$89,900
-
2003-05-16soldstatus $54,000
-
1975-05-01soldstatus $23,500
ⓘ Source: listings_history table (triggers on properties + properties_extension) + one-shot
backfill from property_details.listing_events for pre-trigger history.
Tax reassessment forecast DE · Partial reset (capped growth)
- Current annual tax
- $1,374 · $115/mo
- Projected year-2 tax
- $1,374 · $115/mo
- Expected delta
- $0/yr ($0/mo · 0.0%)
ⓘ Screening estimate from a state-policy table — verify with the county assessor before closing.
Climate risk First Street
- Flood 1/10 Low FEMA zone X (unshaded) · 0% chance over 30 yrs
- Wildfire 1/10 Low
- Heat 7/10 Severe 7 d/yr ≥103°F today · 15 d/yr by 30 yrs out
- Wind 6/10 Major 27% chance of damaging wind over 30 yrs
- Air quality 3/10 Moderate 2 unhealthy d/yr today · 3 by 30 yrs out
Nearby sold comps map
Loading sold comps map…
Walkable amenities ~0.75 mi
Loading nearby amenities…
Taxation est. · year 1
- Rental income
- $19,500
- − Mortgage interest
- −$9,517
- − Property taxes
- −$1,374
- − Insurance
- −$850
- − Repairs & maintenance
- −$1,560
- − Management
- −$1,560
- − Depreciation
- −$4,943
- Taxable loss
- −$304
- Est. tax savings @ 24.0%
- +$73
- After-tax cash flow
- $2,562/yr
For passive investors: Depreciation is non-cash, so a rental often shows a tax loss while cash-flowing — sheltering income. Rental losses are passive: they offset passive income freely, and up to $25,000/yr can offset ordinary (W-2) income if you actively participate and your MAGI is under $100k (phasing out to $0 by $150k); unused losses carry forward. On sale, claimed depreciation is recaptured at up to 25%, and gains may owe capital-gains tax (a 1031 exchange can defer both). Figures are a year-1 estimate at your 24.0% rate — not tax advice; consult a CPA.
Schools (NCES district)
- District
- Brandywine School District
- NCES district ID
- 1001240
- Math proficiency
- 28% ▼ -13.00%
- Reading proficiency
- 40% ▼ -13.00%
- Median HH income
- $68,743
- Composite
- 31.27/100
- National rank
- #6019
- State rank
- #11 of 26 in DE
Livability — Edgemoor
- Score
- 72/100
- State rank
- #17
- US rank
- #6080
Category grades
Schools grade is shown separately in the Schools card above.
Census & demographics
- Census place
- Edgemoor, DE
- County
- New Castle County · 483,412 people
- City population
- 173,480
- Metro
- Philadelphia-Camden-Wilmington, PA-NJ-DE-MD
- Population (ZIP)
- 26,051
- Household income
- $53,812
- Rent vs Own
- Severe rent burden
- 1816.0
Population outlook (New Castle County) Hauer SSP2
- Today (2025)
- 594,686 people
- By 2030
- 609,164 · +2.4%
- By 2040
- 632,154 · +6.3%
- By 2050
- 649,068 · +9.1%
- By 2075
- 687,771 · +15.7%
- By 2100
- 694,961 · +16.9%
Race, ethnicity, and origin ACS 2023
- Neighborhood character
- Predominantly Black (68%)
- Race & ethnicity
- Black 68% White 20% Hispanic / Latino 7% Two or more races 5%
- Hispanic origin (detail)
- Puerto Rican 4%
- Common ancestry
- Slovak 1% Romanian 1% Italian 1%
- Foreign-born
- 11% · Canada, Jamaica, China
- Languages at home
- 92% English-only · Spanish 4% Arabic 0%
Political lean MEDSL · New Castle
- 2024 margin
- Solid D (+32.6) · D 65.5% · R 32.9% · Other 1.6%
- 2008→2024 swing
- -8.1pp toward R · 2008: 40.6pp · 2024: 32.6pp
- All cycles
- 2024: D+32.6 2020: D+37.1 2016: D+29.6 2012: D+34.1 2008: D+40.6
Not yet ingested
- Civics
- —
Market trends
- HPI YoY
- ▼ -296.47%
- Current HPI
- 225.6613
- Rent YoY
- ▲ 5.72%
- Metro
- Philadelphia-Camden-Wilmington, PA-NJ-DE-MD
- State GDP YoY
- —
- F500 in state
- 0
Price history
+623.0% since first listed12 events — show timeline
- 2026-03-19 Price Changed $169,900 BRIGHT MLS
- 2026-01-21 Price Changed $175,000 BRIGHT MLS
- 2025-10-11 Listed $185,000 BRIGHT MLS
- 2025-10-04 Coming Soon $185,000 BRIGHT MLS
- 2009-05-20 Listing Removed — BRIGHT MLS
- 2008-12-16 Listed $119,900 BRIGHT MLS
- 2004-08-31 Listing Removed — BRIGHT MLS
- 2004-07-13 Listing Removed — BRIGHT MLS
- 2004-07-12 Listed $89,900 BRIGHT MLS
- 2004-06-24 Listed $89,900 BRIGHT MLS
- 2003-05-16 Sold (Public Records) $54,000 Public Records
- 1975-05-01 Sold (Public Records) $23,500 Public Records
Property tax history
+2.1%/yrLatest (2024): $1,374 · +9.2% YoY. Source: county tax records.
Cash-flow waterfall
monthlySold comps — $/sqft
last 12 mo · ≤1 miLoading sold comps…