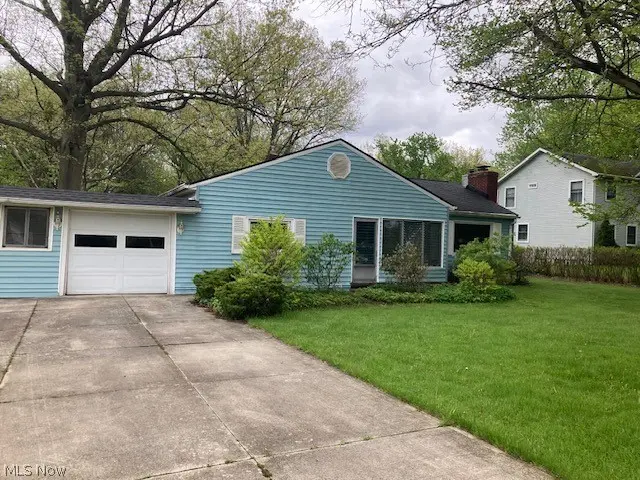
9207 Prospect Rd · Strongsville, OH
Flood risk 1/10 · Minimal
- FEMA flood zone
- X (unshaded)
- Chance of flooding over 30 yrs
- 0.0%
- Est. flood insurance / yr
- $507 – $1,088
Fire risk 1/10 · Minimal
- Est. fire insurance / yr
- $713 – $1,323
Heat risk 3/10 · Minor
- Hot days now (above 96°F)
- 7 days/yr
- Hot days in 30 yrs
- 16 days/yr
Wind risk 1/10 · Minimal
- Chance of severe wind over 30 yrs
- —
Air-quality risk 2/10 · Minimal
- Unhealthy air days now
- 1 days/yr
- Unhealthy air days in 30 yrs
- 2 days/yr
Risk factors via First Street. Map © Google.
Why this score? — see what drove the D grade
The composite is a weighted blend of 9 inputs, each scored 0–100. Each bar is that input's sub-score; the figure is the points it added to the 100-point composite (weight × sub-score).
- ARV discount +15.0/15.0
- Cash flow +7.4/30.0
- Schools +6.7/10.0
- Livability +4.4/5.0
- Rent growth +2.5/5.0
- Condition / age +2.5/5.0
- 1% rule +2.0/10.0
- DSCR +1.6/10.0
- Appreciation +0.0/10.0
$179,900
🖨 Deal sheet (PDF) 📄 Offer letter ✓ Due diligence
Listing remarks MLS
Handy Mans Special Lots Of Potential Wbfp Lrg Lot Almost Acre Room To Grow Great Location Wont Last
Key facts
- Back yard views
- Bonus room
- Enclosed porch
Tags
Property features AI
Finance
- HOA & community: Nearby shopping
Exterior
- Parking: Attached garage (1 car) with driveway
- Utilities: Public water; Public sewer
- Home design: Single-story home; Fixer condition; Asphalt roof; Vinyl siding; Slab foundation
- Construction: Built (year per public records); Vinyl siding construction; Asphalt roof; Slab foundation
- Exterior features: Enclosed patio/porch; Patio; Porch; Chain link fencing; Shed(s); Flat, level lot approximately 0.92 acres (93 x 476)
Interior
- Kitchen: Range; Refrigerator
- Bedrooms: Two main-level bedrooms
- Bathrooms: One full bathroom on the main level
- Heating & cooling: Forced air heating (gas); Central air conditioning
- Interior features: Double pane windows; Living room wood-burning fireplace
- Laundry & utility: Washer and dryer located inside on the main level
Neighborhood map
What this means for you Summary
Snapshot
- This is a 2-bed/1.0-bath single-family listed at $180k.
Deal economics
- At list price, monthly cash flow is $-230 ($-3k/yr) — negative.
- To cash-flow at today's rent, offer at most $139k (22.6% below list).
- To meet the 1% rule (rent ≥ 1% of price), the offer needs to be $126k (30.1% below list).
- Recommended offer: $126k (30.1% below list) — sets the bar for 1% rule.
- Cap rate 4.8% vs local median 3.2% in Strongsville — top-decile yield for the area; either an underpriced asset or a hidden risk that comps aren't pricing in. Stress-test before assuming the spread holds.
Location & tenants
- Location reads 88/100 on livability (#27 in OH, #243 nationally) — a professional / high-income tenant draw. Strengths: crime A+, amenities A+, employment A+; Watch: commute F.
- Strongsville City (suburban): math 73% / reading 79% proficiency, ranked #62 of 656 in OH (top 10%) — strong family-tenant draw, lease renewals of 3-5y typical; only 15% free/reduced lunch — higher-income household profile.
- Zoned schools: Strongsville Middle School (math 70% / reading 76%, grade A, #105 of 654 statewide, top 17%, 1,270 students, 20% FRL); Strongsville High School (math 63% / reading 82%, grade B+, #87 of 781 statewide, top 11%, 1,844 students, 17% FRL) — zoned schools at 18% FRL track the district average.
- Market conditions: 121 active listings in the ZIP; 2 comparable units currently listed for rent nearby; high-income renter base; 1,441 units permitted in Cuyahoga County in 2024 (700 in 5+ unit buildings).
- This rent is only 13% of the median local income ($114k/yr) — well below the 30% rent-burden line; pricing power to push rent on renewal without tenant pushback.
Forward outlook
- Local home prices are declining (-3.0%/yr); year-one equity from $1k of loan paydown is wiped out by about $5k of value loss. Plan a longer hold.
- Cuyahoga County population projected to shrink 8% by 2050 — rents likely to lag national; underwrite the cash flow, not the appreciation.
Negotiation context
- Only 5 days on market — expect competitive offers; lowballing is unlikely to land.
- 3 sale attempts since 33y ago with the ask held roughly flat each time — persistent listings suggest the price (not the market) is what's stuck; bring a comps-based counter.
Risks & watch-outs
- Watch-outs: built in 1952 — expect roof / HVAC / electrical / plumbing capex.
Questions for the listing agent
- What do current leases actually rent for vs. the listed asking? Can we see a recent rent roll and the last 12 months of T-12 income?
- Built in 1952 — when were the roof, HVAC, electrical panel, plumbing, and water heater last replaced?
- Is there a deadline driving the sale (1031 exchange, divorce, estate, relocation)? That informs how much negotiation room exists.
- Schools are A-rated — typically a magnet for longer-tenancy family renters. What's the average tenant stay here, and is there a school-zone premium baked into asking?
- The area grade is low — what's the realistic commute time and amenity access for the typical tenant pool here? Any planned neighborhood developments (good or bad) we should know about?
- What's the average days-on-market for RENTAL listings here right now (not sales)? A rising rental-DOM trend means longer vacancies and softer asking-rent achievability than the comps imply.
- What's the recent tenant-quality profile in this submarket — average credit score on applications, eviction rate, late-payment / NSF rate, and stable-employment percentage? A property-management company in the area should have these aggregated.
- How much new for-sale + rental construction is in the pipeline within 1–3 miles? Heavy new supply typically softens prices + rents 12–24 months out; constrained supply supports both.
Investment metrics
- 1% rule
- 0.70% ✗
- Cap rate
- 4.76%
- Cash-on-cash
- -5.47%
- DSCR
- 0.76
- GRM
- 11.9
CMA / ARV
- ARV (median comp)
- $220,848
- List price
- $179,900
- Delta
- -18.54%
- Verdict
- UNDERPRICED
- Comps
- 20 within 1.0 mi
Projected returns pro-forma
-3.0% appreciation · 3.0% rent growth · sell at horizon
- IRR
- -25.6%
- Equity multiple
- 0.13×
- Total profit
- $-43,776
- Equity at exit
- $26,824
- IRR
- -22.1%
- Equity multiple
- -0.13×
- Total profit
- $-56,931
- Equity at exit
- $15,554
Cash invested: $50,372 (down + closing). Projections, not guarantees.
Landlord ↔ Tenant lean methodology
- Overall (STATE)
- 73 Landlord-Friendly
- State Ohio
- 73 Landlord-Friendly · R+6
- County
- — inherits STATE
- City
- — inherits STATE
ZIP-level market 44149
- Active inventory
- 121
- Price-to-rent
- 11.9×
Monthly cashflow live
- Estimated rent
- $1,258 medium interval (Pro) →
- Mortgage (P&I)
- −$943
- Tax from tax record
- −$205 /mo · $2,465/yr
- Insurance
- −$75
- HOA
- −$0
- Vacancy / Maint / Mgmt
- −$264
- Net cashflow
- $-230
Break-even live
Sensitivity live
| Price | -10% $-128 | -5% $-179 | +0% $-230 | +5% $-281 | +10% $-332 |
|---|---|---|---|---|---|
| Rent | -10% $-329 | -5% $-279 | +0% $-230 | +5% $-180 | +10% $-130 |
| Rate | -1.0pp $-139 | -0.5pp $-184 | base $-230 | +0.5pp $-276 | +1.0pp $-324 |
UW: 25.0% down · 7.5% · 30yr · 1.5% tax · 5.0% vac · 8.0% maint · 8.0% mgmt
Financing live
Cash to close
- Down payment
- $44,975
- Closing costs
- $5,397
- Reserves months
- —
- Total cash needed
- —
Loan-product check · same deal, 3 products live
Conventional
25% down · 7.5% · 30yr
- Down + closing
- —
- Monthly P&I
- —
- Monthly cashflow
- —
- DSCR
- —
- Eligible?
- —
Personal DTI + credit; lowest rate.
DSCR
20% down · 8.5% · 30yr
- Down + closing
- —
- Monthly P&I
- —
- Monthly cashflow
- —
- DSCR
- —
- Eligible?
- —
No personal income docs; deal must DSCR.
Hard money
10% down · 12.0% · 12mo
- Down + closing
- —
- Monthly P&I
- —
- Monthly cashflow
- —
- DSCR
- —
- Eligible?
- —
Short-term bridge; refi at stabilization.
Rent comps 2 comps
| Address | Beds | Baths | Sqft | Rent | $/sqft | DOM | Units | Dist |
|---|---|---|---|---|---|---|---|---|
| 670 Prospect Rd Berea, OH | 1.0–3.0 | 1.0 | 852 | $1,216 | $1.43 | 3d | 16 | 0.56mi |
| 9745 Douglas Ln Olmsted Falls, OH | 1.0–3.0 | 1.0 | 1000 | $1,372 | $1.37 | 3d | 2 | 1.26mi |
Listing history 8 events
-
2026-05-05status Pending 587-char remark
-
2026-04-30$179,900 Active 587-char remark
-
1995-02-03soldstatus $81,000 99-char remark
Show marketing remark (99 chars)
Handy Mans Special Lots Of Potential Wbfp Lrg Lot Almost Acre Room To Grow Great Location Wont Last
-
1995-02-02soldstatus $81,000
-
1994-12-06$87,000 99-char remark
Show marketing remark (99 chars)
Handy Mans Special Lots Of Potential Wbfp Lrg Lot Almost Acre Room To Grow Great Location Wont Last
-
1993-10-28soldstatus $68,000
Show marketing remark (151 chars)
See Checklist For Disclosure * Lovely 1 Acre Lot * Fenced Yard * Extra Room Was 1 Car Garage * Much Potential * Bath Needs Work * Call Lister To Show *
-
1993-10-27soldstatus $68,000
-
1993-06-08$78,950
Show marketing remark (151 chars)
See Checklist For Disclosure * Lovely 1 Acre Lot * Fenced Yard * Extra Room Was 1 Car Garage * Much Potential * Bath Needs Work * Call Lister To Show *
ⓘ Source: listings_history table (triggers on properties + properties_extension) + one-shot
backfill from property_details.listing_events for pre-trigger history.
Tax reassessment forecast OH · Partial reset (capped growth)
- Current annual tax
- $2,465 · $205/mo
- Projected year-2 tax
- $2,636 · $220/mo
- Expected delta
- +$171/yr (+$14/mo · 6.9%)
ⓘ Screening estimate from a state-policy table — verify with the county assessor before closing.
Climate risk First Street
- Flood 1/10 Low FEMA zone X (unshaded) · 0% chance over 30 yrs
- Wildfire 1/10 Low
- Heat 3/10 Moderate 7 d/yr ≥96°F today · 16 d/yr by 30 yrs out
- Wind 1/10 Low
- Air quality 2/10 Low 1 unhealthy d/yr today · 2 by 30 yrs out
Nearby sold comps map
Loading sold comps map…
Walkable amenities ~0.75 mi
Loading nearby amenities…
Taxation est. · year 1
- Rental income
- $15,099
- − Mortgage interest
- −$10,077
- − Property taxes
- −$2,465
- − Insurance
- −$900
- − Repairs & maintenance
- −$1,208
- − Management
- −$1,208
- − Depreciation
- −$5,233
- Taxable loss
- −$5,991
- Est. tax savings @ 24.0%
- +$1,438
- After-tax cash flow
- $-1,319/yr
For passive investors: Depreciation is non-cash, so a rental often shows a tax loss while cash-flowing — sheltering income. Rental losses are passive: they offset passive income freely, and up to $25,000/yr can offset ordinary (W-2) income if you actively participate and your MAGI is under $100k (phasing out to $0 by $150k); unused losses carry forward. On sale, claimed depreciation is recaptured at up to 25%, and gains may owe capital-gains tax (a 1031 exchange can defer both). Figures are a year-1 estimate at your 24.0% rate — not tax advice; consult a CPA.
Schools (NCES district)
- District
- Strongsville City
- NCES district ID
- 3904484
- Math proficiency
- 73% ▼ -10.00%
- Reading proficiency
- 79% ▼ -2.00%
- Median HH income
- $78,206
- Composite
- 67.02/100
- National rank
- #395
- State rank
- #62 of 656 in OH
Livability — Strongsville
- Score
- 88/100
- State rank
- #27
- US rank
- #243
Category grades
Schools grade is shown separately in the Schools card above.
Census & demographics
- Census place
- Strongsville, OH
- County
- Cuyahoga · 1,045,444 people
- City population
- 46,110
- Metro
- Cleveland, OH
- Population (ZIP)
- 21,042
- Household income
- $114,107
- Rent vs Own
- Severe rent burden
- 2.7
Population outlook (Cuyahoga County) Hauer SSP2
- Today (2025)
- 1,244,621 people
- By 2030
- 1,230,093 · -1.2%
- By 2040
- 1,189,108 · -4.5%
- By 2050
- 1,145,706 · -7.9%
- By 2075
- 1,076,557 · -13.5%
- By 2100
- 978,987 · -21.3%
Race, ethnicity, and origin ACS 2023
- Neighborhood character
- Predominantly White (91%)
- Race & ethnicity
- White 91% Asian 3% Two or more races 3% Hispanic / Latino 3% Black 1%
- Common ancestry
- Romanian 11% Italian 2% Slovak 2%
- Foreign-born
- 7% · Canada, China
- Languages at home
- 92% English-only · Other Indo-European 2% Arabic 1% Russian/Polish/Slavic 1%
Political lean MEDSL · Cuyahoga
- 2024 margin
- Solid D (+31.5) · D 65.4% · R 33.9%
- 2008→2024 swing
- -7.4pp toward R · 2008: 38.9pp · 2024: 31.5pp
- All cycles
- 2024: D+31.5 2020: D+34.1 2016: D+35.0 2012: D+38.7 2008: D+38.9
Not yet ingested
- Civics
- —
Market trends
- HPI YoY
- ▼ -238.17%
- Current HPI
- 196.9311
- Rent YoY
- —
- Metro
- —
- State GDP YoY
- ▲ 1.98%
- F500 in state
- 48
Industry mix (Fortune 500 HQ in OH)
| Industry | F500 HQs | Revenue |
|---|---|---|
| Insurance | 3 | $145B |
|
||
| Industrial Machinery | 3 | $49B |
|
||
| Financial Services | 3 | $24B |
|
||
| Consumer Goods | 2 | $93B |
|
||
| Aerospace / Defense | 2 | $47B |
|
||
| Utilities | 2 | $33B |
|
||
Price history
+135.6% since first listed9 events — show timeline
- 2026-05-29 Sold (MLS) $186,000 MLSNOW
- 2026-05-05 Pending — MLSNOW
- 2026-04-30 Listed $179,900 MLSNOW
- 1995-02-03 Sold (MLS) $81,000 MLSNOW
- 1995-02-02 Sold (Public Records) $81,000 Public Records
- 1994-12-06 Listed $87,000 MLSNOW
- 1993-10-28 Sold (MLS) $68,000 MLSNOW
- 1993-10-27 Sold (Public Records) $68,000 Public Records
- 1993-06-08 Listed $78,950 MLSNOW
Property tax history
+6.2%/yrLatest (2025): $2,465 · +26.6% YoY. Source: county tax records.
Cash-flow waterfall
monthlySold comps — $/sqft
last 12 mo · ≤1 miLoading sold comps…