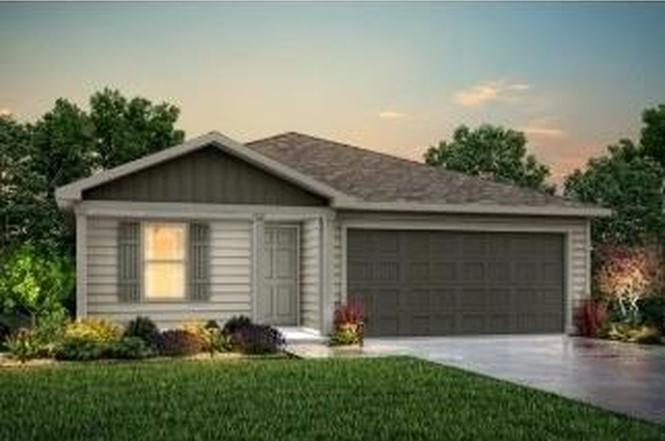
117 Coyote Creek Ct · Abilene, TX
Flood risk 1/10 · Minimal
- FEMA flood zone
- X (unshaded)
- Chance of flooding over 30 yrs
- 0.0%
- Est. flood insurance / yr
- $507 – $1,088
Fire risk 7/10 · Major
- Est. fire insurance / yr
- $1,222 – $2,270
Heat risk 7/10 · Major
- Hot days now (above 103°F)
- 7 days/yr
- Hot days in 30 yrs
- 25 days/yr
Wind risk 4/10 · Minor
- Chance of severe wind over 30 yrs
- 15.0%
Air-quality risk 1/10 · Minimal
- Unhealthy air days now
- 0 days/yr
- Unhealthy air days in 30 yrs
- 0 days/yr
Risk factors via First Street. Map © Google.
Why this score? — see what drove the C- grade
The composite is a weighted blend of 9 inputs, each scored 0–100. Each bar is that input's sub-score; the figure is the points it added to the 100-point composite (weight × sub-score).
- Cash flow +21.6/30.0
- DSCR +6.9/10.0
- 1% rule +5.7/10.0
- Rent growth +5.0/5.0
- Livability +3.8/5.0
- Schools +2.8/10.0
- Condition / age +2.5/5.0
- ARV discount +2.2/15.0
- Appreciation +0.0/10.0
$238,990
🖨 Deal sheet 📄 Offer letter ✓ Due diligence
Listing remarks
MLS# 21120780 - Built by NHC - Ready Now! ~ The Washington Plan from our Liberty Series is a thoughtfully designed single-story home featuring 3 bedrooms, 2 bathrooms, a 2-car garage, and 1,209 square feet of functional living space. As you step inside, you’ll find two secondary bedrooms and a full bathroom conveniently located at the front of the home. Continue into the bright and open living area, where the kitchen with a central island seamlessly overlooks the dining area and family room, creating a perfect space for everyday living and entertaining. The laundry room is thoughtfully situated off the kitchen for easy access. The primary bedroom, located at the back of the home for a
Key facts
- 3,055 sq ft lot
- 2 garage spots
- Built 2026
Neighborhood map
What this means for you Summary
Snapshot
- This is a 3-bed/2.0-bath single-family listed at $239k.
Deal economics
- At list price, monthly cash flow is $362 ($4k/yr) — positive.
- The deal already cash-flows at list — no discount required.
- Meets the 1% rule at list price ($3k rent vs $239k).
- Recommended offer: $217k (9.0% below list) — sets the bar for market timing.
- Cap rate 8.1% vs local median 6.7% in Abilene — meaningfully above typical; check what's discounted (condition, days-on-market, listing class) to confirm the premium yield is real.
Location & tenants
- Location reads 75/100 on livability (#142 in TX, #4,037 nationally) — a middle-class / working-renter tenant base. Strengths: cost of living A+, housing A+, health & safety A+; Watch: schools D+, crime D, commute F.
- Abilene ISD (urban): math 32% / reading 34% proficiency, ranked #575 of 826 in TX (top 70%) — families likely to look elsewhere, expect single-tenant / working-renter base with shorter leases.
- Market conditions: Rents rising fast (+33.5%/yr); 370 active listings in the ZIP; 9 comparable units currently listed for rent nearby; rentals leasing fast (median 13d on market — plan ~1-2 weeks tenant-placement turnaround); solid renter incomes; 508 units permitted in Taylor County in 2024 (0 in 5+ unit buildings).
- This rent runs 34% of the median local income ($90k/yr) — at the standard rent-burdened threshold; future hikes will face affordability resistance.
Forward outlook
- Local home prices are declining (-3.0%/yr); year-one equity from $2k of loan paydown is wiped out by about $7k of value loss. Plan a longer hold.
- Taylor County population projected at +16% by 2050 — long-run rental-demand tailwind backs the buy-and-hold thesis.
- At projected returns (-3.0% appreciation + 8.0% rent growth), your $67k cash investment doubles in ~9 years — after that, you're playing with house money.
Negotiation context
- It's been on market 100 days — a 9% lower offer ($217k) is reasonable based on typical stale-listing flexibility.
- 2 sale attempts with the ask held roughly flat each time — persistent listings suggest the price (not the market) is what's stuck; bring a comps-based counter.
Risks & watch-outs
- Climate carrying-cost: major wildfire risk; extreme-heat days projected 7→25/yr by 2055 (HVAC capex compounding) — expect insurance premiums to compound above CPI over the hold.
Questions for the listing agent
- It's been on market 100 days. Have you received any prior offers? Is the seller open to a 9% concession, seller financing, or rate buy-down credit?
- Why hasn't it sold? Are there any deal-killer items the seller is aware of (foundation, flood, title, zoning, code violations)?
- Is there a deadline driving the sale (1031 exchange, divorce, estate, relocation)? That informs how much negotiation room exists.
- Schools are D-rated, which usually means shorter tenancies and higher turnover. Who's the typical renter profile here, and what's been the actual vacancy rate?
- Crime grade is D in this area — have there been break-ins, vandalism, or insurance claims at this property in the last 3 years? What carrier currently insures it and at what premium?
- What's the average days-on-market for RENTAL listings here right now (not sales)? A rising rental-DOM trend means longer vacancies and softer asking-rent achievability than the comps imply.
- What's the recent tenant-quality profile in this submarket — average credit score on applications, eviction rate, late-payment / NSF rate, and stable-employment percentage? A property-management company in the area should have these aggregated.
- How much new for-sale + rental construction is in the pipeline within 1–3 miles? Heavy new supply typically softens prices + rents 12–24 months out; constrained supply supports both.
Investment metrics
- 1% rule
- 1.07% ✓
- Cap rate
- 8.11%
- Cash-on-cash
- 6.49%
- DSCR
- 1.29
- GRM
- 7.8
CMA / ARV
- ARV (on-the-fly)
- $213,993
- Comps found
- 12
Show comp detail 12 sales within ~0.75 mi
| Address | Dist | Beds/Ba | Sqft | Sold | Price | $/sf | Match |
|---|---|---|---|---|---|---|---|
| 3541 Silver Springs Ct | 0.10mi | 3/2.0 | 1,209 (0%) | 1mo | $234,490 | $194 | 95 |
| 2948 Waterside Dr | 0.13mi | 3/2.0 | 1,202 (-1%) | 4mo | $218,000 | $181 | 89 |
| 144 Houston Hollow St | 0.04mi | 3/2.0 | 1,209 (0%) | 11mo | $196,990 | $163 | 89 |
| 214 Houston Hollow St | 0.08mi | 3/2.0 | 1,209 (0%) | 10mo | $209,990 | $174 | 88 |
| 3501 Silver Springs Ct | 0.09mi | 2/2.5 (-1) | 1,212 (+0%) | 1mo | $214,433 | $177 | 88 |
| 2913 Autumnwood Way | 0.06mi | 3/2.0 | 1,209 (0%) | 12mo | $199,990 | $165 | 88 |
| 112 Houston Hollow St | 0.03mi | 3/2.0 | 1,209 (0%) | 14mo | $208,990 | $173 | 87 |
| 3502 Water Ridge Ct | 0.12mi | 2/2.5 (-1) | 1,212 (+0%) | 0mo | $247,990 | $205 | 87 |
| 226 Sage Brush Dr | 0.08mi | 3/2.0 | 1,209 (0%) | 17mo | $180,990 | $150 | 82 |
| 3526 Silver Springs Ct | 0.49mi | 3/2.0 | 1,209 (0%) | 1mo | $234,990 | $194 | 76 |
| 3502 Silver Springs Ct | 0.50mi | 2/2.5 (-1) | 1,212 (+0%) | 1mo | $225,490 | $186 | 69 |
| 2670 Maple St | 0.41mi | 2/1.0 (-1) | 1,080 (-11%) | 3mo | $155,000 | $144 | 51 |
Match score weights: distance 35% · size 25% · config 20% · recency 20%. Top-matched comps best support the ARV.
Projected returns pro-forma
-3.0% appreciation · 8.0% rent growth · sell at horizon
- IRR
- -0.8%
- Equity multiple
- 0.97×
- Total profit
- $-2,166
- Equity at exit
- $35,634
- IRR
- 13.5%
- Equity multiple
- 2.33×
- Total profit
- $89,261
- Equity at exit
- $20,663
Cash invested: $66,917 (down + closing). Projections, not guarantees.
Landlord ↔ Tenant lean methodology
- Overall (STATE)
- 87 Strongly Landlord-Friendly
- State Texas
- 87 Strongly Landlord-Friendly · R+5
- County
- — inherits STATE
- City
- — inherits STATE
ZIP-level market 79602
- Home prices YoY
- -19.6%
- Rents YoY
- 33.5%
- Active inventory
- 370
- Price-to-rent
- 7.8×
Monthly cashflow live
- Estimated rent
- $2,549 high interval (Pro) →
- Mortgage (P&I)
- −$1,253
- Tax est. 1.5%
- −$299 /mo · $3,585/yr
- Insurance
- −$100
- HOA
- −$0
- Vacancy / Maint / Mgmt
- −$535
- Net cashflow
- $362
Break-even live
UW: 25.0% down · 7.5% · 30yr · 1.5% tax · 5.0% vac · 8.0% maint · 8.0% mgmt
Financing live
Cash to close
- Down payment
- $59,748
- Closing costs
- $7,170
- Reserves months
- —
- Total cash needed
- —
Loan-product check · same deal, 3 products live
Conventional
25% down · 7.5% · 30yr
- Down + closing
- —
- Monthly P&I
- —
- Monthly cashflow
- —
- DSCR
- —
- Eligible?
- —
Personal DTI + credit; lowest rate.
DSCR
20% down · 8.5% · 30yr
- Down + closing
- —
- Monthly P&I
- —
- Monthly cashflow
- —
- DSCR
- —
- Eligible?
- —
No personal income docs; deal must DSCR.
Hard money
10% down · 12.0% · 12mo
- Down + closing
- —
- Monthly P&I
- —
- Monthly cashflow
- —
- DSCR
- —
- Eligible?
- —
Short-term bridge; refi at stabilization.
Rent comps 9 comps
| Address | Beds | Baths | Sqft | Rent | $/sqft | DOM | Units | Dist |
|---|---|---|---|---|---|---|---|---|
| 1097 Lytle Creek Dr Abilene, TX | 3.0 | 2.0 | 1456 | $2,895 | $1.99 | 13d | 1 | 1.31mi |
| 3749 Duke Ln Abilene, TX | 2.0 | 1.0 | 925 | $1,650 | $1.78 | 7d | 1 | 1.35mi |
| 3933 Wake Forest Ln Abilene, TX | 3.0 | 2.0 | 1320 | $2,495 | $1.89 | 21d | 1 | 1.37mi |
| 3933 Wake Forest Ln Abilene, TX | 3.0 | 2.0 | 1320 | $2,495 | $1.89 | 20d | 1 | 1.37mi |
| 801 S 17th St Abilene, TX | 3.0 | 1.0 | 1200 | $1,800 | $1.50 | 13d | 1 | 1.37mi |
| 3601 Purdue Ln Abilene, TX | 3.0 | 1.0 | 1172 | $2,150 | $1.83 | 2d | 1 | 1.38mi |
| 1709 Bandolero Rd Abilene, TX | 3.0 | 2.0 | 1288 | $4,500 | $3.49 | 13d | 1 | 1.43mi |
| 3873 Purdue Ln Abilene, TX | 3.0 | 1.0 | 1027 | $2,100 | $2.04 | 13d | 1 | 1.43mi |
| 3674 Radcliff Rd Abilene, TX | 3.0 | 1.5 | 1155 | $2,000 | $1.73 | 13d | 1 | 1.46mi |
Listing history 5 events
-
2026-06-07pricedays on market $238,990 Pending 100 DOM
-
2026-03-11status Pending
-
2025-12-02historical
-
2025-12-02status Active
-
2025-11-25$232,990
ⓘ Source: listings_history table (triggers on properties + properties_extension) + one-shot
backfill from property_details.listing_events for pre-trigger history.
Climate risk First Street
- Flood 1/10 Low FEMA zone X (unshaded) · 0% chance over 30 yrs
- Wildfire 7/10 Severe
- Heat 7/10 Severe 7 d/yr ≥103°F today · 25 d/yr by 30 yrs out
- Wind 4/10 Moderate 15% chance of damaging wind over 30 yrs
- Air quality 1/10 Low 0 unhealthy d/yr today · 0 by 30 yrs out
Nearby sold comps map
Loading sold comps map…
Walkable amenities ~0.75 mi
Loading nearby amenities…
Taxation est. · year 1
- Rental income
- $30,586
- − Mortgage interest
- −$13,387
- − Property taxes
- −$3,585
- − Insurance
- −$1,195
- − Repairs & maintenance
- −$2,447
- − Management
- −$2,447
- − Depreciation
- −$6,952
- Taxable income
- $573
- Est. tax owed @ 24.0%
- −$137
- After-tax cash flow
- $4,206/yr
For passive investors: Depreciation is non-cash, so a rental often shows a tax loss while cash-flowing — sheltering income. Rental losses are passive: they offset passive income freely, and up to $25,000/yr can offset ordinary (W-2) income if you actively participate and your MAGI is under $100k (phasing out to $0 by $150k); unused losses carry forward. On sale, claimed depreciation is recaptured at up to 25%, and gains may owe capital-gains tax (a 1031 exchange can defer both). Figures are a year-1 estimate at your 24.0% rate — not tax advice; consult a CPA.
Schools (NCES district)
- District
- Abilene ISD
- NCES district ID
- 4807440
- Math proficiency
- 32% ▼ -11.00%
- Reading proficiency
- 34% ▼ -5.00%
- Median HH income
- $39,782
- Composite
- 27.71/100
- National rank
- #6909
- State rank
- #575 of 826 in TX
Livability — Abilene
- Score
- 75/100
- State rank
- #142
- US rank
- #4037
Category grades
Schools grade is shown separately in the Schools card above.
Census & demographics
- Census place
- Abilene, TX
- County
- Taylor County · 136,672 people
- City population
- 136,672
- Metro
- Abilene, TX
- Population (ZIP)
- 27,425
- Household income
- $89,551
- Rent vs Own
- Severe rent burden
- 338.0
Population outlook (Taylor County) Hauer SSP2
- Today (2025)
- 145,270 people
- By 2030
- 150,050 · +3.3%
- By 2040
- 159,417 · +9.7%
- By 2050
- 168,883 · +16.3%
- By 2075
- 194,436 · +33.8%
- By 2100
- 203,163 · +39.9%
Race, ethnicity, and origin ACS 2023
- Neighborhood character
- Majority White (64%)
- Race & ethnicity
- White 64% Hispanic / Latino 22% Two or more races 12% Black 10% Asian 2%
- Hispanic origin (detail)
- Mexican 19%
- Common ancestry
- Romanian 2% Italian 2% Portuguese 2%
- Foreign-born
- 6% · Canada, Vietnam, Jamaica
- Languages at home
- 87% English-only · Spanish 9% Other Asian/Pacific 1% French/Haitian/Cajun 1%
Political lean MEDSL · Taylor
- 2024 margin
- Solid R (+49.8) · D 24.6% · R 74.4% · Other 1.0%
- 2008→2024 swing
- -4.2pp toward R · 2008: -45.6pp · 2024: -49.8pp
- All cycles
- 2024: R+49.8 2020: R+45.3 2016: R+51.1 2012: R+53.6 2008: R+45.6
Not yet ingested
- Civics
- —
Market trends
- HPI YoY
- ▼ -46.04%
- Current HPI
- 189.3098
- Rent YoY
- ▲ 33.46%
- Metro
- Abilene, TX
- State GDP YoY
- ▲ 3.95%
- F500 in state
- 110
Industry mix (Fortune 500 HQ in TX)
| Industry | F500 HQs | Revenue |
|---|---|---|
| Energy | 16 | $1,198B |
|
||
| Technology | 5 | $198B |
|
||
| Engineering / Construction | 4 | $72B |
|
||
| Energy Services | 3 | $60B |
|
||
| Utilities | 3 | $41B |
|
||
| Healthcare | 2 | $330B |
|
||
Price history
4 events — show timeline
- 2026-03-11 Pending — NTREIS
- 2025-12-02 Listing Removed — NTREIS
- 2025-12-02 Relisted — NTREIS
- 2025-11-25 Listed $232,990 NTREIS
Cash-flow waterfall
monthlySold comps — $/sqft
last 12 mo · ≤1 miLoading sold comps…