Flex · Scottsburg, IN
Flood risk No data
- FEMA flood zone
- —
- Chance of flooding over 30 yrs
- —
- Est. flood insurance / yr
- —
Fire risk No data
- Est. fire insurance / yr
- —
Heat risk No data
- Hot days now (above threshold)
- —
- Hot days in 30 yrs
- —
Wind risk No data
- Chance of severe wind over 30 yrs
- —
Air-quality risk No data
- Unhealthy air days now
- —
- Unhealthy air days in 30 yrs
- —
Risk factors via First Street. Map © Google.
Why this score? — see what drove the D+ grade
The composite is a weighted blend of 9 inputs, each scored 0–100. Each bar is that input's sub-score; the figure is the points it added to the 100-point composite (weight × sub-score).
- Cash flow +13.6/30.0
- 1% rule +10.0/10.0
- ARV discount +7.5/15.0
- DSCR +4.1/10.0
- Condition / age +4.0/5.0
- Livability +3.5/5.0
- Schools +3.2/10.0
- Rent growth +2.5/5.0
- Appreciation +0.0/10.0
$70,995
🖨 Deal sheet (PDF) 📄 Offer letter ✓ Due diligence
Listing remarks
Located within two miles of I-65, Amberly Pointe is a community with quiet character and charm that is just minutes from shopping, employment and schools. For current prices of homes in Amberly Pointe call our sales office. Community Amenities Clubhouse, Playground, and Soccer Field Schools Highland Elementary School, William H. English Middle School, and Scottsburg High School
Key facts
- Clubhouse
- Community amenities
- Soccer field
Tags
Property features AI
Finance
- Other: Listing status: Active; Listing modification timestamp: 2026-06-01T20:36:56.097Z
- Financial info: List price $70,995
- HOA & community: Association fee of 390 (period not specified)
Exterior
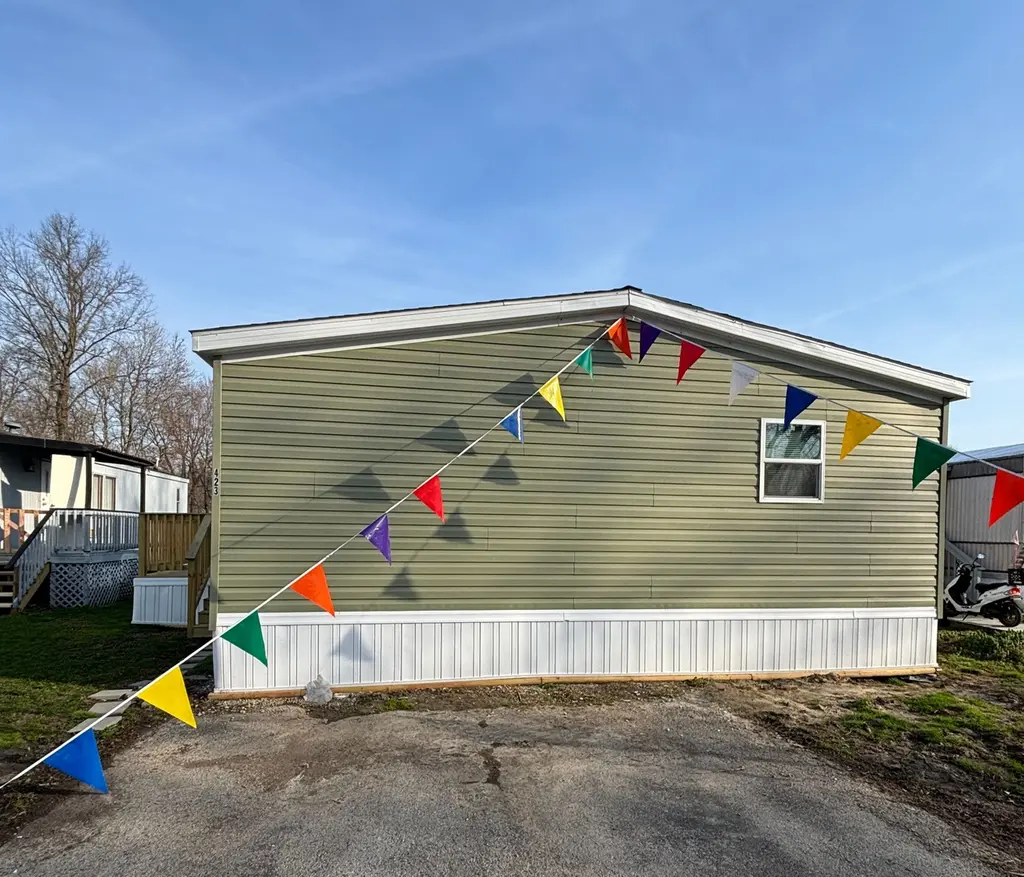
- Home design: Spec inventory; Plan name: Vertex (Amberly); Located in Scottsburg, IN (Flex address)
Interior
- Bedrooms: 3 bedrooms
- Bathrooms: 2 full bathrooms
- Interior features: Living area of 1056 (listed under property information)
Neighborhood map
What this means for you Summary
Snapshot
- This is a 3-bed/2.0-bath manufactured listed at $71k. Condition is rated good.
Deal economics
- At list price, monthly cash flow is $4 ($52/yr) — positive.
- The deal already cash-flows at list — no discount required.
- Meets the 1% rule at list price ($1k rent vs $71k).
- Recommended offer: $70k (1.5% below list) — sets the bar for market timing.
- Cap rate 6.4% vs local median 4.2% in Scottsburg — top-decile yield for the area; either an underpriced asset or a hidden risk that comps aren't pricing in. Stress-test before assuming the spread holds.
Location & tenants
- Location reads 70/100 on livability (#152 in IN) — a middle-class / working-renter tenant base. Strengths: cost of living A+, health & safety A+, housing A; Watch: amenities F, commute F, employment D-.
- Scott County School District 2 (town): math 33% / reading 43% proficiency, ranked #166 of 301 in IN (top 55%) — families likely to look elsewhere, expect single-tenant / working-renter base with shorter leases.
- Market conditions: 106 active listings in the ZIP; 6 comparable units currently listed for rent nearby; rentals at typical pace (median 24d on market — plan ~3-4 weeks tenant-placement turnaround); 73 units permitted in Scott County in 2024 (0 in 5+ unit buildings).
Forward outlook
- Local home prices are declining (-3.0%/yr); year-one equity from $491 of loan paydown is wiped out by about $2k of value loss. Plan a longer hold.
- Scott County population projected at -23% by 2050 — secular population decline; favor cash flow + early exit over multi-decade hold.
Negotiation context
- It's been on market 19 days — a 2% lower offer ($70k) is reasonable based on typical stale-listing flexibility.
Risks & watch-outs
- Watch-outs: HOA is 35% of rent.
Questions for the listing agent
- What does the HOA fee cover, when was the last increase, and are there any pending special assessments or reserve-fund shortfalls?
- Is there a deadline driving the sale (1031 exchange, divorce, estate, relocation)? That informs how much negotiation room exists.
- The area grade is low — what's the realistic commute time and amenity access for the typical tenant pool here? Any planned neighborhood developments (good or bad) we should know about?
- What's the average days-on-market for RENTAL listings here right now (not sales)? A rising rental-DOM trend means longer vacancies and softer asking-rent achievability than the comps imply.
- What's the recent tenant-quality profile in this submarket — average credit score on applications, eviction rate, late-payment / NSF rate, and stable-employment percentage? A property-management company in the area should have these aggregated.
- How much new for-sale + rental construction is in the pipeline within 1–3 miles? Heavy new supply typically softens prices + rents 12–24 months out; constrained supply supports both.
Investment metrics
- 1% rule
- 1.58% ✓
- Cap rate
- 6.37%
- Cash-on-cash
- 0.26%
- DSCR
- 1.01
- GRM
- 5.3
CMA / ARV
No comps found within radius.
Projected returns pro-forma
-3.0% appreciation · 3.0% rent growth · sell at horizon
- IRR
- -15.4%
- Equity multiple
- 0.45×
- Total profit
- $-10,974
- Equity at exit
- $10,586
- IRR
- -6.3%
- Equity multiple
- 0.59×
- Total profit
- $-8,160
- Equity at exit
- $6,138
Cash invested: $19,879 (down + closing). Projections, not guarantees.
Landlord ↔ Tenant lean methodology
- Overall (STATE)
- 90 Strongly Landlord-Friendly
- State Indiana
- 90 Strongly Landlord-Friendly · R+11
- County
- — inherits STATE
- City
- — inherits STATE
ZIP-level market 47170
- Home prices YoY
- -22.3%
- Active inventory
- 106
- Price-to-rent
- 5.3×
Monthly cashflow live
- Estimated rent
- $1,120 high interval (Pro) →
- Mortgage (P&I)
- −$372
- Tax est. 1.5%
- −$89 /mo · $1,065/yr
- Insurance
- −$30
- HOA
- −$390
- Vacancy / Maint / Mgmt
- −$235
- Net cashflow
- $4
Break-even live
Sensitivity live
| Price | -10% $53 | -5% $29 | +0% $4 | +5% $-20 | +10% $-45 |
|---|---|---|---|---|---|
| Rent | -10% $-84 | -5% $-40 | +0% $4 | +5% $49 | +10% $93 |
| Rate | -1.0pp $40 | -0.5pp $22 | base $4 | +0.5pp $-14 | +1.0pp $-33 |
UW: 25.0% down · 7.5% · 30yr · 1.5% tax · 5.0% vac · 8.0% maint · 8.0% mgmt
Financing live
Cash to close
- Down payment
- $17,749
- Closing costs
- $2,130
- Reserves months
- —
- Total cash needed
- —
Loan-product check · same deal, 3 products live
Conventional
25% down · 7.5% · 30yr
- Down + closing
- —
- Monthly P&I
- —
- Monthly cashflow
- —
- DSCR
- —
- Eligible?
- —
Personal DTI + credit; lowest rate.
DSCR
20% down · 8.5% · 30yr
- Down + closing
- —
- Monthly P&I
- —
- Monthly cashflow
- —
- DSCR
- —
- Eligible?
- —
No personal income docs; deal must DSCR.
Hard money
10% down · 12.0% · 12mo
- Down + closing
- —
- Monthly P&I
- —
- Monthly cashflow
- —
- DSCR
- —
- Eligible?
- —
Short-term bridge; refi at stabilization.
Rent comps 6 comps
| Address | Beds | Baths | Sqft | Rent | $/sqft | DOM | Units | Dist |
|---|---|---|---|---|---|---|---|---|
| 737 Ray St Scottsburg, IN | 3.0 | 1.0 | 989 | $1,475 | $1.49 | 44d | 1 | 0.74mi |
| 432 N Meridian St Scottsburg, IN | 3.0 | 2.0 | 1300 | $1,200 | $0.92 | 44d | 1 | 0.77mi |
| 854 W Lake Rd W Scottsburg, IN | 2.0 | 1.0 | 794 | $925 | $1.16 | 24d | 1 | 1.20mi |
| 254 E Davis St Unit D Scottsburg, IN | 2.0 | 1.0 | 750 | $825 | $1.10 | 12d | 1 | 1.24mi |
| 254 E Davis St Unit D Scottsburg, IN | 2.0 | 1.0 | 750 | $910 | $1.21 | 24d | 1 | 1.24mi |
| 280 Harrison St Unit 1 Scottsburg, IN | 2.0 | 1.0 | 750 | $895 | $1.19 | 4d | 1 | 1.29mi |
HOA detail
- Monthly dues
- $390 · $4,680/yr
Listing history 14 events
-
2026-06-21days on market $70,995 Active 19 DOM
-
2026-06-18days on market $70,995 Active 17 DOM
-
2026-06-17days on market $70,995 Active 16 DOM
-
2026-06-16days on market $70,995 Active 15 DOM
-
2026-06-15days on market $70,995 Active 14 DOM
-
2026-06-13days on market $70,995 Active 12 DOM
-
2026-06-12days on market $70,995 Active 11 DOM
-
2026-06-09days on market $70,995 Active 8 DOM
-
2026-06-08days on market $70,995 Active 7 DOM
-
2026-06-07days on market $70,995 Active 6 DOM
-
2026-06-07days on market $70,995 Active 5 DOM
-
2026-06-04days on market $70,995 Active 2 DOM
-
2026-06-02remarks 380-char remark
-
2026-06-02$70,995 Active 1 DOM
ⓘ Source: listings_history table (triggers on properties + properties_extension) + one-shot
backfill from property_details.listing_events for pre-trigger history.
Nearby sold comps map
Loading sold comps map…
Walkable amenities ~0.75 mi
Loading nearby amenities…
Taxation est. · year 1
- Rental income
- $13,442
- − Mortgage interest
- −$3,977
- − Property taxes
- −$1,065
- − Insurance
- −$355
- − Repairs & maintenance
- −$1,075
- − Management
- −$1,075
- − HOA
- −$4,680
- − Depreciation
- −$2,065
- Taxable loss
- −$851
- Est. tax savings @ 24.0%
- +$204
- After-tax cash flow
- $256/yr
For passive investors: Depreciation is non-cash, so a rental often shows a tax loss while cash-flowing — sheltering income. Rental losses are passive: they offset passive income freely, and up to $25,000/yr can offset ordinary (W-2) income if you actively participate and your MAGI is under $100k (phasing out to $0 by $150k); unused losses carry forward. On sale, claimed depreciation is recaptured at up to 25%, and gains may owe capital-gains tax (a 1031 exchange can defer both). Figures are a year-1 estimate at your 24.0% rate — not tax advice; consult a CPA.
Condition & rehab AI · 12 photos
This manufactured home is in excellent condition with modern finishes and a well-maintained exterior. It is move-in ready and presents a good investment opportunity.
Value-add opportunities
- Both Painting the exterior siding — Enhances curb appeal and can increase both resale and rental value.
- Both Landscaping improvements — Enhances curb appeal and can increase both resale and rental value.
- Both Adding a small outdoor seating area — Can increase both resale and rental value by adding a functional and attractive outdoor space.
Renovation cost estimate screening
Value-add ROI direction
- Both Painting the exterior siding — Enhances curb appeal and can increase both resale and rental value. ↑
- Both Landscaping improvements — Enhances curb appeal and can increase both resale and rental value. ↑
- Both Adding a small outdoor seating area — Can increase both resale and rental value by adding a functional and attractive outdoor space. ↑
ⓘ Cost ranges are severity-bucket heuristics (US national rule-of-thumb). Get contractor quotes + a written scope before underwriting a rehab budget.
Schools (NCES district)
- District
- Scott County School District 2
- NCES district ID
- 1810020
- Math proficiency
- 33% ▼ -10.00%
- Reading proficiency
- 43% ▼ -6.00%
- Median HH income
- $45,529
- Composite
- 32.37/100
- National rank
- #5734
- State rank
- #166 of 301 in IN
Livability — Scottsburg
- Score
- 70/100
- State rank
- #152
- US rank
- #7609
Category grades
Schools grade is shown separately in the Schools card above.
Census & demographics
- Census place
- Scottsburg, IN
- Population (ZIP)
- 15,279
Population outlook (Scott County) Hauer SSP2
- Today (2025)
- 22,525 people
- By 2030
- 21,609 · -4.1%
- By 2040
- 19,536 · -13.3%
- By 2050
- 17,370 · -22.9%
- By 2075
- 12,862 · -42.9%
- By 2100
- 9,340 · -58.5%
Race, ethnicity, and origin ACS 2023
- Neighborhood character
- Predominantly White (92%)
- Race & ethnicity
- White 92% Two or more races 4% Hispanic / Latino 3%
- Common ancestry
- Slovak 2% Lithuanian 1% Italian 1%
- Foreign-born
- 1% · Canada
- Languages at home
- 97% English-only · Spanish 1% Other Indo-European 1%
Political lean MEDSL · Scott
- 2024 margin
- Solid R (+51.5) · D 23.4% · R 74.9% · Other 1.6%
- 2008→2024 swing
- -49.5pp toward R · 2008: -2.0pp · 2024: -51.5pp
- All cycles
- 2024: R+51.5 2020: R+45.6 2016: R+37.9 2012: R+6.2 2008: R+2.0
Not yet ingested
- Civics
- —
Market trends
- HPI YoY
- ▼ -64.30%
- Current HPI
- 223.9909
- Rent YoY
- —
- Metro
- —
- State GDP YoY
- ▲ 2.90%
- F500 in state
- 18
Industry mix (Fortune 500 HQ in IN)
| Industry | F500 HQs | Revenue |
|---|---|---|
| Industrial Machinery | 2 | $37B |
|
||
| Healthcare | 1 | $177B |
|
||
| Pharmaceuticals | 1 | $45B |
|
||
| Metals / Steel | 1 | $18B |
|
||
| Agriculture | 1 | $17B |
|
||
| Packaging | 1 | $12B |
|
||
Cash-flow waterfall
monthlySold comps — $/sqft
last 12 mo · ≤1 miLoading sold comps…