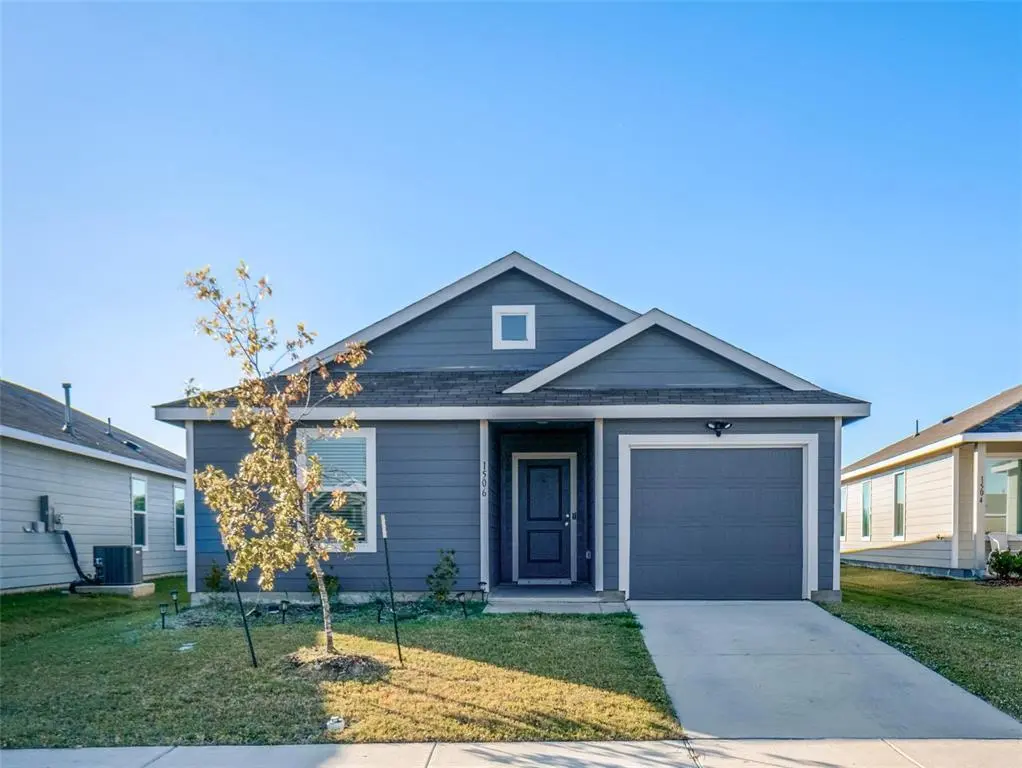
1506 Highbridge Bvld · Heartland, TX
Flood risk 1/10 · Minimal
- FEMA flood zone
- X (unshaded)
- Chance of flooding over 30 yrs
- 0.0%
- Est. flood insurance / yr
- $507 – $1,088
Fire risk 6/10 · Moderate
- Est. fire insurance / yr
- $1,222 – $2,270
Heat risk 7/10 · Major
- Hot days now (above 110°F)
- 7 days/yr
- Hot days in 30 yrs
- 25 days/yr
Wind risk 6/10 · Moderate
- Chance of severe wind over 30 yrs
- 27.0%
Air-quality risk 2/10 · Minimal
- Unhealthy air days now
- 1 days/yr
- Unhealthy air days in 30 yrs
- 1 days/yr
Risk factors via First Street. Map © Google.
Why this score? — see what drove the C+ grade
The composite is a weighted blend of 9 inputs, each scored 0–100. Each bar is that input's sub-score; the figure is the points it added to the 100-point composite (weight × sub-score).
- Cash flow +19.6/30.0
- ARV discount +15.0/15.0
- 1% rule +7.9/10.0
- DSCR +6.2/10.0
- Condition / age +4.0/5.0
- Schools +3.6/10.0
- Rent growth +2.5/5.0
- Livability +2.5/5.0
- Appreciation +0.0/10.0
$151,200
🖨 Deal sheet (PDF) 📄 Offer letter ✓ Due diligence
Listing remarks MLS
HUD OWNED HOME FHA CASE# 511-333141 SOLD AS-IS. Open-concept 3-bedroom, 2-bath home built in 2023, located in a desirable Crandall community within the highly rated Crandall Independent School District ISD. Enjoy community amenities including a beautiful pool and common areas, all maintained through the HOA. Large kitchen with plenty of cabinet space, breakfast bar and open to the living and dining area. Attached 1 car garage and fenced back yard. There is a lot of opportunity with this property so come check it out before it is gone. Owner occupant buyers may be able to purchase this home with as little as $100 down when utilizing the HUD FHA Sales Incentive.
Key facts
- Open-concept
- Fenced back yard
- Community amenities
Tags
Neighborhood map
What this means for you Summary
Snapshot
- This is a 3-bed/2.0-bath single-family listed at $151k. Condition is rated good.
Deal economics
- At list price, monthly cash flow is $174 ($2k/yr) — positive.
- The deal already cash-flows at list — no discount required.
- Meets the 1% rule at list price ($2k rent vs $151k).
- Recommended offer: $147k (3.0% below list) — sets the bar for market timing.
- Cap rate 7.7% vs local median 4.6% in Heartland — top-decile yield for the area; either an underpriced asset or a hidden risk that comps aren't pricing in. Stress-test before assuming the spread holds.
Location & tenants
- Location reads: area grade C — affects rentability + tenant quality, not the cash-flow math above.
- Crandall ISD (rural): math 36% / reading 42% proficiency, ranked #351 of 826 in TX (top 42%) — families likely to look elsewhere, expect single-tenant / working-renter base with shorter leases.
- Market conditions: 787 active listings in the ZIP; 34 comparable units currently listed for rent nearby; rentals at typical pace (median 26d on market — plan ~3-4 weeks tenant-placement turnaround); 41% of comp listings sitting > 30 days — soft ceiling on asking rent; solid renter incomes; 1,747 units permitted in Kaufman County in 2024 (180 in 5+ unit buildings).
Forward outlook
- Local home prices are declining (-3.0%/yr); year-one equity from $1k of loan paydown is wiped out by about $5k of value loss. Plan a longer hold.
- Kaufman County population projected at +43% by 2050 — long-run rental-demand tailwind backs the buy-and-hold thesis.
Negotiation context
- It's been on market 52 days — a 3% lower offer ($147k) is reasonable based on typical stale-listing flexibility.
- 4 sale attempts since 2y ago; this cycle's ask has dropped $38k (20%) from the opening price — seller is motivated, your offer sets the floor, not the list.
Risks & watch-outs
- Watch-outs: property tax is 3.8% of price.
- Climate carrying-cost: major wind risk, 27% chance of damaging wind over 30y; major wildfire risk; extreme-heat days projected 7→25/yr by 2055 (HVAC capex compounding) — expect insurance premiums to compound above CPI over the hold.
Questions for the listing agent
- It's been on market 52 days. Have you received any prior offers? Is the seller open to a 3% concession, seller financing, or rate buy-down credit?
- Property tax is high relative to price — has the assessment been appealed recently, and will the sale trigger a re-assessment?
- What does the HOA fee cover, when was the last increase, and are there any pending special assessments or reserve-fund shortfalls?
- Is there a deadline driving the sale (1031 exchange, divorce, estate, relocation)? That informs how much negotiation room exists.
- What's the average days-on-market for RENTAL listings here right now (not sales)? A rising rental-DOM trend means longer vacancies and softer asking-rent achievability than the comps imply.
- What's the recent tenant-quality profile in this submarket — average credit score on applications, eviction rate, late-payment / NSF rate, and stable-employment percentage? A property-management company in the area should have these aggregated.
- How much new for-sale + rental construction is in the pipeline within 1–3 miles? Heavy new supply typically softens prices + rents 12–24 months out; constrained supply supports both.
Investment metrics
- 1% rule
- 1.29% ✓
- Cap rate
- 7.68%
- Cash-on-cash
- 4.94%
- DSCR
- 1.22
- GRM
- 6.5
CMA / ARV
- ARV (median comp)
- $227,337
- List price
- $151,200
- Delta
- -33.49%
- Verdict
- UNDERPRICED
- Comps
- 20 within 1.0 mi
Show comp detail 12 sales within ~0.75 mi
| Address | Dist | Beds/Ba | Sqft | Sold | Price | $/sf | Match |
|---|---|---|---|---|---|---|---|
| 2522 Smoke Passage St | 0.44mi | 3/2.0 | 1,260 (+3%) | 2mo | $194,499 | $154 | 72 |
| 2926 Hearts Trl | 0.51mi | 3/2.0 | 1,266 (+4%) | 1mo | $204,999 | $162 | 69 |
| 2919 Hearts Trl | 0.52mi | 3/2.0 | 1,266 (+4%) | 1mo | $193,999 | $153 | 68 |
| 2920 Hearts Trl | 0.53mi | 3/2.0 | 1,266 (+4%) | 2mo | $191,999 | $152 | 68 |
| 2914 Hearts Trl | 0.55mi | 3/2.0 | 1,266 (+4%) | 3mo | $193,749 | $153 | 66 |
| 2810 Bakers Bnd | 0.46mi | 3/2.0 | 1,335 (+9%) | 0mo | $275,740 | $207 | 63 |
| 2951 Hearts Trl | 0.42mi | 3/2.0 | 1,402 (+15%) | 2mo | $205,999 | $147 | 54 |
| 2923 Hearts Trl | 0.51mi | 3/2.0 | 1,402 (+15%) | 1mo | $210,999 | $150 | 51 |
| 2529 Talus Run | 0.57mi | 3/2.0 | 1,396 (+14%) | 1mo | $267,240 | $191 | 49 |
| 2915 Hearts Trl | 0.54mi | 3/2.0 | 1,402 (+15%) | 2mo | $219,999 | $157 | 48 |
| 2208 Starstruck Ct | 0.72mi | 3/2.0 | 1,402 (+15%) | 2mo | $261,999 | $187 | 40 |
| 1141 Avalon Dr | 0.63mi | 2/1.0 (-1) | 1,070 (-12%) | 3mo | $167,900 | $157 | 39 |
Match score weights: distance 35% · size 25% · config 20% · recency 20%. Top-matched comps best support the ARV.
Projected returns pro-forma
-3.0% appreciation · 3.0% rent growth · sell at horizon
- IRR
- -8.5%
- Equity multiple
- 0.69×
- Total profit
- $-13,176
- Equity at exit
- $22,544
- IRR
- 1.2%
- Equity multiple
- 1.09×
- Total profit
- $3,738
- Equity at exit
- $13,073
Cash invested: $42,336 (down + closing). Projections, not guarantees.
Landlord ↔ Tenant lean methodology
- Overall (STATE)
- 87 Strongly Landlord-Friendly
- State Texas
- 87 Strongly Landlord-Friendly · R+5
- County
- — inherits STATE
- City
- — inherits STATE
ZIP-level market 75114
- Home prices YoY
- -26.7%
- Active inventory
- 787
- Price-to-rent
- 6.5×
Monthly cashflow live
- Estimated rent
- $1,949 high interval (Pro) →
- Mortgage (P&I)
- −$793
- Tax from tax record
- −$476 /mo · $5,715/yr
- Insurance
- −$63
- HOA
- −$33
- Vacancy / Maint / Mgmt
- −$409
- Net cashflow
- $174
Break-even live
Sensitivity live
| Price | -10% $260 | -5% $217 | +0% $174 | +5% $131 | +10% $89 |
|---|---|---|---|---|---|
| Rent | -10% $20 | -5% $97 | +0% $174 | +5% $251 | +10% $328 |
| Rate | -1.0pp $250 | -0.5pp $213 | base $174 | +0.5pp $135 | +1.0pp $95 |
UW: 25.0% down · 7.5% · 30yr · 1.5% tax · 5.0% vac · 8.0% maint · 8.0% mgmt
Financing live
Cash to close
- Down payment
- $37,800
- Closing costs
- $4,536
- Reserves months
- —
- Total cash needed
- —
Loan-product check · same deal, 3 products live
Conventional
25% down · 7.5% · 30yr
- Down + closing
- —
- Monthly P&I
- —
- Monthly cashflow
- —
- DSCR
- —
- Eligible?
- —
Personal DTI + credit; lowest rate.
DSCR
20% down · 8.5% · 30yr
- Down + closing
- —
- Monthly P&I
- —
- Monthly cashflow
- —
- DSCR
- —
- Eligible?
- —
No personal income docs; deal must DSCR.
Hard money
10% down · 12.0% · 12mo
- Down + closing
- —
- Monthly P&I
- —
- Monthly cashflow
- —
- DSCR
- —
- Eligible?
- —
Short-term bridge; refi at stabilization.
Rent comps 34 comps
| Address | Beds | Baths | Sqft | Rent | $/sqft | DOM | Units | Dist |
|---|---|---|---|---|---|---|---|---|
| 3315 Beckwith Way Crandall, TX | 3.0 | 2.0 | 1440 | $1,685 | $1.17 | 44d | 1 | 0.09mi |
| 3352 Beckwith Way Crandall, TX | 3.0 | 2.0 | 1266 | $1,850 | $1.46 | 16d | 1 | 0.16mi |
| 3007 Wallace Wells Ct Crandall, TX | 3.0 | 2.0 | 1440 | $1,950 | $1.35 | 44d | 1 | 0.17mi |
| 2306 Great Belt Blvd Crandall, TX | 3.0 | 2.0 | 1266 | $1,695 | $1.34 | 44d | 1 | 0.18mi |
| 3121 Helix Bay Dr Crandall, TX | 3.0 | 2.0 | 1440 | $1,675 | $1.16 | 44d | 1 | 0.19mi |
| 2302 Great Belt Blvd Crandall, TX | 3.0 | 2.0 | 1266 | $1,650 | $1.30 | 3d | 1 | 0.20mi |
| 2991 Wallace Wells Ct Crandall, TX | 3.0 | 2.0 | 1266 | $1,895 | $1.50 | 44d | 1 | 0.20mi |
| 3103 Helix Bay Dr Crandall, TX | 3.0 | 2.0 | 1440 | $1,729 | $1.20 | 3d | 1 | 0.21mi |
| 3101 Helix Bay Dr Crandall, TX | 3.0 | 2.0 | 1266 | $1,745 | $1.38 | 25d | 1 | 0.22mi |
| 2294 Great Belt Blvd Crandall, TX | 3.0 | 2.0 | 1266 | $1,815 | $1.43 | 25d | 1 | 0.22mi |
| 2973 Wallace Wells Ct Crandall, TX | 3.0 | 2.0 | 1440 | $1,665 | $1.16 | 44d | 1 | 0.23mi |
| 3104 Helix Bay Dr Crandall, TX | 3.0 | 2.0 | 1266 | $1,675 | $1.32 | 25d | 1 | 0.24mi |
| 2961 Wallace Wells Ct Crandall, TX | 3.0 | 2.0 | 1266 | $1,855 | $1.47 | 2d | 1 | 0.25mi |
| 3072 Wallace Wells Ct Crandall, TX | 3.0 | 2.0 | 1017 | $1,500 | $1.47 | 25d | 1 | 0.26mi |
| 2960 Wallace Wells Ct Crandall, TX | 3.0 | 2.0 | 1440 | $2,000 | $1.39 | 44d | 1 | 0.27mi |
| 2603 Khaju Grv Crandall, TX | 3.0 | 2.0 | 1266 | $1,699 | $1.34 | 3d | 1 | 0.34mi |
| 2511 Cornado Way Crandall, TX | 3.0 | 2.0 | 1239 | $1,799 | $1.45 | 25d | 1 | 0.35mi |
| 2504 Cornado Way Crandall, TX | 3.0 | 2.0 | 1440 | $1,799 | $1.25 | 44d | 1 | 0.36mi |
| 2311 Alcantara Ave Crandall, TX | 3.0 | 2.0 | 1220 | $1,765 | $1.45 | 6d | 1 | 0.40mi |
| 2204 Boiling Springs Rd Crandall, TX | 3.0–4.0 | 2.0 | 1497 | $2,131 | $1.42 | 2d | 5 | 0.43mi |
| 2505 Milne Ct Crandall, TX | 3.0 | 2.0 | 1450 | $2,500 | $1.72 | 19d | 1 | 0.57mi |
| 2908 Hearts Trl Crandall, TX | 3.0 | 3.0 | 1266 | $1,750 | $1.38 | 44d | 1 | 0.61mi |
| 2117 Ocelot St Crandall, TX | 3.0 | 2.0 | 1481 | $1,875 | $1.27 | 44d | 1 | 0.63mi |
| 2127 Ocelot St Crandall, TX | 3.0 | 2.0 | 1383 | $2,200 | $1.59 | 44d | 1 | 0.63mi |
| 1799 Courage Crk Crandall, TX | 3.0 | 2.0 | 1260 | $1,800 | $1.43 | 44d | 1 | 0.67mi |
| 1930 Wild Orchard Ln Crandall, TX | 3.0 | 2.0 | 1411 | $1,865 | $1.32 | 44d | 1 | 0.71mi |
| 3324 Price Trl Crandall, TX | 3.0 | 2.0 | 1296 | $1,995 | $1.54 | 17d | 1 | 0.72mi |
| 4152 Silverstein St Crandall, TX | 3.0 | 2.0 | 1266 | $1,925 | $1.52 | 25d | 1 | 0.79mi |
| 1209 Kings Pl Crandall, TX | 3.0 | 2.0 | 1356 | $1,975 | $1.46 | 2d | 1 | 0.84mi |
| 4171 Silverstein St Crandall, TX | 3.0 | 2.0 | 1311 | $1,900 | $1.45 | 13d | 1 | 0.86mi |
| 1609 Duke Dr Crandall, TX | 2.0–4.0 | 2.0–2.5 | 1614 | $2,242 | $1.39 | 2d | 1 | 0.91mi |
| 4624 Verdin St Crandall, TX | 3.0 | 2.0 | 1390 | $1,950 | $1.40 | 2d | 1 | 1.14mi |
| 2919 Cascade Ln Forney, TX | 3.0 | 2.0 | 1481 | $2,200 | $1.49 | 44d | 1 | 1.24mi |
| 4002 Bighorn Dr Forney, TX | 3.0 | 2.0 | 1365 | $2,120 | $1.55 | 2d | 1 | 1.39mi |
HOA detail
- Monthly dues
- $33 · $396/yr
- Likely covers
- pool
Listing history 12 events
-
2026-06-04status $151,200 Pending 52 DOM
-
2026-06-03days on market $151,200 Active Contingent 52 DOM
-
2026-06-02days on market $151,200 Active Contingent 51 DOM
-
2026-06-01days on market $151,200 Active Contingent 50 DOM
-
2026-05-31days on market $151,200 Active Contingent 49 DOM
-
2026-04-08$189,000 Active 670-char remark
Show marketing remark (670 chars)
HUD OWNED HOME FHA CASE# 511-333141 SOLD AS-IS. Open-concept 3-bedroom, 2-bath home built in 2023, located in a desirable Crandall community within the highly rated Crandall Independent School District ISD. Enjoy community amenities including a beautiful pool and common areas, all maintained through the HOA. Large kitchen with plenty of cabinet space, breakfast bar and open to the living and dining area. Attached 1 car garage and fenced back yard. There is a lot of opportunity with this property so come check it out before it is gone. Owner occupant buyers may be able to purchase this home with as little as $100 down when utilizing the HUD FHA Sales Incentive.
-
2025-10-23price $225,000
-
2025-10-22$325,000 Active
-
2024-08-21historical
-
2024-08-07status Active
-
2024-07-30historical Active Option Contract
-
2024-07-25$225,000 Active
ⓘ Source: listings_history table (triggers on properties + properties_extension) + one-shot
backfill from property_details.listing_events for pre-trigger history.
Tax reassessment forecast TX · Resets to sale price
- Current annual tax
- $5,715 · $476/mo
- Projected year-2 tax
- $5,715 · $476/mo
- Expected delta
- $0/yr ($0/mo · 0.0%)
ⓘ Screening estimate from a state-policy table — verify with the county assessor before closing.
Climate risk First Street
- Flood 1/10 Low FEMA zone X (unshaded) · 0% chance over 30 yrs
- Wildfire 6/10 Major
- Heat 7/10 Severe 7 d/yr ≥110°F today · 25 d/yr by 30 yrs out
- Wind 6/10 Major 27% chance of damaging wind over 30 yrs
- Air quality 2/10 Low 1 unhealthy d/yr today · 1 by 30 yrs out
Nearby sold comps map
Loading sold comps map…
Walkable amenities ~0.75 mi
Loading nearby amenities…
Taxation est. · year 1
- Rental income
- $23,384
- − Mortgage interest
- −$8,470
- − Property taxes
- −$5,715
- − Insurance
- −$756
- − Repairs & maintenance
- −$1,871
- − Management
- −$1,871
- − HOA
- −$396
- − Depreciation
- −$4,399
- Taxable loss
- −$93
- Est. tax savings @ 24.0%
- +$22
- After-tax cash flow
- $2,113/yr
For passive investors: Depreciation is non-cash, so a rental often shows a tax loss while cash-flowing — sheltering income. Rental losses are passive: they offset passive income freely, and up to $25,000/yr can offset ordinary (W-2) income if you actively participate and your MAGI is under $100k (phasing out to $0 by $150k); unused losses carry forward. On sale, claimed depreciation is recaptured at up to 25%, and gains may owe capital-gains tax (a 1031 exchange can defer both). Figures are a year-1 estimate at your 24.0% rate — not tax advice; consult a CPA.
Condition & rehab AI · 6 photos
This 2023 single-family home in a desirable Crandall community is in good condition with minimal repairs needed. It offers a good investment opportunity with potential for both resale and rental value.
Value-add opportunities
- Both Paint exterior — Enhances curb appeal and value
- Both Replace blinds — Improves natural light and aesthetics
- Both Install smart home devices — Enhances convenience and marketability
Renovation cost estimate screening
Value-add ROI direction
- Both Paint exterior — Enhances curb appeal and value ↑
- Both Replace blinds — Improves natural light and aesthetics ↑
- Both Install smart home devices — Enhances convenience and marketability ↑
ⓘ Cost ranges are severity-bucket heuristics (US national rule-of-thumb). Get contractor quotes + a written scope before underwriting a rehab budget.
Schools (NCES district)
- District
- Crandall ISD
- NCES district ID
- 4815510
- Math proficiency
- 36% ▼ -13.00%
- Reading proficiency
- 42% ▼ -8.00%
- Median HH income
- $70,076
- Composite
- 35.57/100
- National rank
- #4901
- State rank
- #351 of 826 in TX
Livability — Heartland
No livability data for this city. (Only ~50 U.S. cities are tracked.)
Census & demographics
- County
- Kaufman County · 122,338 people
- Metro
- Dallas-Fort Worth-Arlington, TX
- Population (ZIP)
- 9,333
- Household income
- $88,013
- Rent vs Own
- Severe rent burden
- 33.0
Population outlook (Kaufman County) Hauer SSP2
- Today (2025)
- 138,716 people
- By 2030
- 150,815 · +8.7%
- By 2040
- 174,877 · +26.1%
- By 2050
- 198,020 · +42.8%
- By 2075
- 251,908 · +81.6%
- By 2100
- 285,325 · +105.7%
Race, ethnicity, and origin ACS 2023
- Neighborhood character
- Diverse neighborhood (Simpson 0.62)
- Race & ethnicity
- White 48% Hispanic / Latino 36% Two or more races 14% Black 14%
- Hispanic origin (detail)
- Mexican 34%
- Common ancestry
- Slovak 1%
- Foreign-born
- 18% · Canada, China
- Languages at home
- 71% English-only · Spanish 27% Other Indo-European 1%
Political lean MEDSL · Kaufman
- 2024 margin
- Strong R (+27.9) · D 35.6% · R 63.5%
- 2008→2024 swing
- +7.9pp toward D · 2008: -35.8pp · 2024: -27.9pp
- All cycles
- 2024: R+27.9 2020: R+33.9 2016: R+47.0 2012: R+44.4 2008: R+35.8
Not yet ingested
- Civics
- —
Market trends
- HPI YoY
- ▼ -71.61%
- Current HPI
- 196.4773
- Rent YoY
- —
- Metro
- Dallas-Fort Worth-Arlington, TX
- State GDP YoY
- ▲ 3.95%
- F500 in state
- 110
Industry mix (Fortune 500 HQ in TX)
| Industry | F500 HQs | Revenue |
|---|---|---|
| Energy | 16 | $1,198B |
|
||
| Technology | 5 | $198B |
|
||
| Engineering / Construction | 4 | $72B |
|
||
| Energy Services | 3 | $60B |
|
||
| Utilities | 3 | $41B |
|
||
| Healthcare | 2 | $330B |
|
||
Price history
-16.0% since first listed7 events — show timeline
- 2026-04-08 Listed $189,000 NTREIS
- 2025-10-23 Price Changed $225,000 NTREIS
- 2025-10-22 Listed $325,000 NTREIS
- 2024-08-21 Listing Removed — NTREIS
- 2024-08-07 Relisted — NTREIS
- 2024-07-30 Contingent — NTREIS
- 2024-07-25 Listed $225,000 NTREIS
Property tax history
+62.5%/yrLatest (2025): $5,715 · -14.9% YoY. Source: county tax records.
Cash-flow waterfall
monthlySold comps — $/sqft
last 12 mo · ≤1 miLoading sold comps…