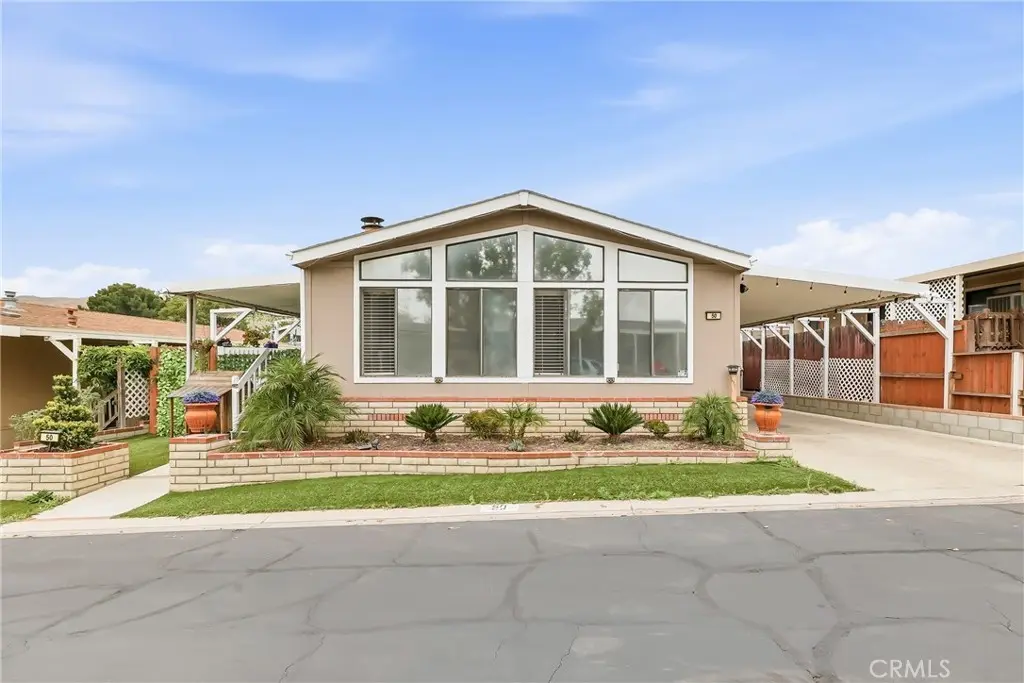
4080 Pedley #50 · Jurupa Valley, CA
Flood risk 1/10 · Minimal
- FEMA flood zone
- X (unshaded)
- Chance of flooding over 30 yrs
- 0.0%
- Est. flood insurance / yr
- $507 – $1,088
Fire risk 8/10 · Major
- Est. fire insurance / yr
- $659 – $1,223
Heat risk 8/10 · Major
- Hot days now (above 103°F)
- 7 days/yr
- Hot days in 30 yrs
- 21 days/yr
Wind risk 1/10 · Minimal
- Chance of severe wind over 30 yrs
- —
Air-quality risk 10/10 · Severe
- Unhealthy air days now
- 28 days/yr
- Unhealthy air days in 30 yrs
- 34 days/yr
Risk factors via First Street. Map © Google.
Why this score? — see what drove the C grade
The composite is a weighted blend of 9 inputs, each scored 0–100. Each bar is that input's sub-score; the figure is the points it added to the 100-point composite (weight × sub-score).
- Cash flow +30.0/30.0
- DSCR +10.0/10.0
- 1% rule +7.5/10.0
- Schools +3.1/10.0
- Rent growth +2.8/5.0
- Livability +2.5/5.0
- Condition / age +2.5/5.0
- ARV discount +0.0/15.0
- Appreciation +0.0/10.0
$224,900
🖨 Deal sheet 📄 Offer letter ✓ Due diligence
Listing remarks
Pride of ownership shines throughout this beautifully maintained move-in ready 3-bedroom, 2-bath home offering approximately 1,820 sqft of comfortable living space in a desirable Jurupa Valley community. Built in 1988, this spacious home features vaulted ceilings, updated flooring, abundant natural light, and an open layout perfect for everyday living and entertaining. The kitchen offers spacious cabinetry and generous counter space while opening to spacious living and dining areas. The oversized primary suite provides comfort and functionality, while additional bedrooms offer flexibility for guests, office space, or hobbies. Step outside and enjoy a backyard upgraded with low-maintenance t
Key facts
- Move-in ready
- Spacious cabinetry
- Open layout
Tags
Property features AI
Finance
- Other: Lot features: 0–1 unit per acre; Elevation measured in feet; Manager approval may be required; Pets: contact manager/park for rules
- Financial info: Monthly land lease payment (park-managed)
- HOA & community: Community amenities include pool, spa, sauna, clubhouse, and billiard room; Park name: Bravo Estates; Land lease (park) monthly
Exterior
- Parking: Attached carport
- Utilities: Public sewer; District/public water
- Home design: Mobile home (Bravo House model); Faces south; One story; Entry on side porch
- Construction: Mobile home remains on site; Mobile dimensions approximately 34 ft wide by 60 ft long; Year built per assessor
- Exterior features: Covered patio/porch; Community pool; Street lighting in neighborhood; Has view
Interior
- Kitchen: Pantry (kitchen storage)
- Bedrooms: Single-level home (one story)
- Bathrooms: 2 full bathrooms
- Heating & cooling: Central heating (furnace); Central air conditioning
- Interior features: Pantry; Recessed lighting; Open floor plan; Community spa
- Laundry & utility: Inside laundry
Neighborhood map
What this means for you Summary
Snapshot
- This is a 3-bed/2.0-bath manufactured listed at $225k.
Deal economics
- At list price, monthly cash flow is $901 ($11k/yr) — positive.
- The deal already cash-flows at list — no discount required.
- Meets the 1% rule at list price ($3k rent vs $225k).
- Recommended offer: $222k (1.5% below list) — sets the bar for market timing.
- Cap rate 11.1% vs local median 2.9% in Jurupa Valley — top-decile yield for the area; either an underpriced asset or a hidden risk that comps aren't pricing in. Stress-test before assuming the spread holds.
Location & tenants
- Location reads 49/100 on livability (#1,170 in CA) — a working-class tenant base; expect higher turnover. Strengths: housing A+, employment A-; Watch: schools F, amenities F, commute F.
- Jurupa Unified (suburban): math 25% / reading 38% proficiency, ranked #953 of 1,400 in CA (top 68%) — families likely to look elsewhere, expect single-tenant / working-renter base with shorter leases; 64% free/reduced lunch — lower-income household profile, screen leases tightly.
- Market conditions: Rents rising (+1.3%/yr); 202 active listings in the ZIP; 1 comparable units currently listed for rent nearby; solid renter incomes; 9,195 units permitted in Riverside County in 2024 (1,512 in 5+ unit buildings).
- This rent runs 35% of the median local income ($95k/yr) — at the standard rent-burdened threshold; future hikes will face affordability resistance.
Forward outlook
- Local home prices are declining (-3.0%/yr); year-one equity from $2k of loan paydown is wiped out by about $7k of value loss. Plan a longer hold.
- Riverside County population projected at +22% by 2050 — long-run rental-demand tailwind backs the buy-and-hold thesis.
- At projected returns (-3.0% appreciation + 1.3% rent growth), your $63k cash investment doubles in ~8 years — after that, you're playing with house money.
Negotiation context
- It's been on market 22 days — a 2% lower offer ($222k) is reasonable based on typical stale-listing flexibility.
Risks & watch-outs
- Climate carrying-cost: severe wildfire risk; extreme-heat days projected 7→21/yr by 2055 (HVAC capex compounding) — expect insurance premiums to compound above CPI over the hold.
Questions for the listing agent
- Is there a deadline driving the sale (1031 exchange, divorce, estate, relocation)? That informs how much negotiation room exists.
- Schools are F-rated, which usually means shorter tenancies and higher turnover. Who's the typical renter profile here, and what's been the actual vacancy rate?
- What's the average days-on-market for RENTAL listings here right now (not sales)? A rising rental-DOM trend means longer vacancies and softer asking-rent achievability than the comps imply.
- What's the recent tenant-quality profile in this submarket — average credit score on applications, eviction rate, late-payment / NSF rate, and stable-employment percentage? A property-management company in the area should have these aggregated.
- How much new for-sale + rental construction is in the pipeline within 1–3 miles? Heavy new supply typically softens prices + rents 12–24 months out; constrained supply supports both.
Investment metrics
- 1% rule
- 1.25% ✓
- Cap rate
- 11.10%
- Cash-on-cash
- 17.18%
- DSCR
- 1.76
- GRM
- 6.7
CMA / ARV
- ARV (on-the-fly)
- $183,820
- Comps found
- 10
Show comp detail 10 sales within ~0.75 mi
| Address | Dist | Beds/Ba | Sqft | Sold | Price | $/sf | Match |
|---|---|---|---|---|---|---|---|
| 4080 Pedley Rd #89 | 0.00mi | 3/2.0 | 1,820 (0%) | 20mo | $100,000 | $55 | 83 |
| 4080 Pedley Rd #182 | 0.00mi | 2/2.0 (-1) | 1,664 (-9%) | 14mo | $130,000 | $78 | 69 |
| 4080 Pedley Rd #8 | 0.00mi | 3/2.0 | 1,642 (-10%) | 18mo | $184,000 | $112 | 68 |
| 4080 Pedley Rd Unit 28A | 0.00mi | 2/2.0 (-1) | 1,646 (-10%) | 14mo | $166,000 | $101 | 68 |
| 4080 Pedley Rd #6 | 0.00mi | 2/2.0 (-1) | 1,680 (-8%) | 21mo | $160,000 | $95 | 65 |
| 4080 pedley #191 | 0.00mi | 4/2.0 (+1) | 1,584 (-13%) | 20mo | $150,000 | $95 | 57 |
| 4041 Pedley Rd #133 | 0.23mi | 3/2.0 | 1,584 (-13%) | 17mo | $112,500 | $71 | 53 |
| 3700 Quartz Canyon Rd #82 | 0.59mi | 3/2.0 | 1,568 (-14%) | 6mo | $180,000 | $115 | 44 |
| 4041 Pedley Rd #149 | 0.31mi | 4/2.0 (+1) | 1,580 (-13%) | 20mo | $220,000 | $139 | 42 |
| 3700 Quartz Canyon Rd #123 | 0.59mi | 3/2.0 | 1,568 (-14%) | 12mo | $199,000 | $127 | 39 |
Match score weights: distance 35% · size 25% · config 20% · recency 20%. Top-matched comps best support the ARV.
Projected returns pro-forma
-3.0% appreciation · 1.31% rent growth · sell at horizon
- IRR
- 6.7%
- Equity multiple
- 1.26×
- Total profit
- $16,180
- Equity at exit
- $33,533
- IRR
- 14.6%
- Equity multiple
- 2.10×
- Total profit
- $69,007
- Equity at exit
- $19,445
Cash invested: $62,972 (down + closing). Projections, not guarantees.
Landlord ↔ Tenant lean methodology
- Overall (STATE)
- 18 Strongly Tenant-Friendly
- State California
- 18 Strongly Tenant-Friendly · D+13
- County
- — inherits STATE
- City
- — inherits STATE
ZIP-level market 92509
- Rents YoY
- 1.3%
- Active inventory
- 202
- Price-to-rent
- 6.7×
Monthly cashflow live
- Estimated rent
- $2,801 medium interval (Pro) →
- Mortgage (P&I)
- −$1,179
- Tax from tax record
- −$38 /mo · $458/yr
- Insurance
- −$94
- HOA
- −$0
- Vacancy / Maint / Mgmt
- −$588
- Net cashflow
- $901
Break-even live
UW: 25.0% down · 7.5% · 30yr · 1.5% tax · 5.0% vac · 8.0% maint · 8.0% mgmt
Financing live
Cash to close
- Down payment
- $56,225
- Closing costs
- $6,747
- Reserves months
- —
- Total cash needed
- —
Loan-product check · same deal, 3 products live
Conventional
25% down · 7.5% · 30yr
- Down + closing
- —
- Monthly P&I
- —
- Monthly cashflow
- —
- DSCR
- —
- Eligible?
- —
Personal DTI + credit; lowest rate.
DSCR
20% down · 8.5% · 30yr
- Down + closing
- —
- Monthly P&I
- —
- Monthly cashflow
- —
- DSCR
- —
- Eligible?
- —
No personal income docs; deal must DSCR.
Hard money
10% down · 12.0% · 12mo
- Down + closing
- —
- Monthly P&I
- —
- Monthly cashflow
- —
- DSCR
- —
- Eligible?
- —
Short-term bridge; refi at stabilization.
Rent comps 1 comps
| Address | Beds | Baths | Sqft | Rent | $/sqft | DOM | Units | Dist |
|---|---|---|---|---|---|---|---|---|
| 3892 Kenneth St Jurupa Valley, CA | 3.0 | 2.0 | 1700 | $3,000 | $1.76 | 44d | 1 | 0.67mi |
Listing history 15 events
-
2026-06-18days on market $224,900 Active 22 DOM
-
2026-06-17days on market $224,900 Active 21 DOM
-
2026-06-16days on market $224,900 Active 20 DOM
-
2026-06-15days on market $224,900 Active 19 DOM
-
2026-06-13days on market $224,900 Active 17 DOM
-
2026-06-13days on market $224,900 Active 16 DOM
-
2026-06-09days on market $224,900 Active 13 DOM
-
2026-06-08days on market $224,900 Active 12 DOM
-
2026-06-07days on market $224,900 Active 11 DOM
-
2026-06-04days on market $224,900 Active 8 DOM
-
2026-06-03days on market $224,900 Active 7 DOM
-
2026-06-02days on market $224,900 Active 6 DOM
-
2026-06-01days on market $224,900 Active 5 DOM
-
2026-05-31days on market $224,900 Active 4 DOM
-
2026-05-27$224,900 Active
ⓘ Source: listings_history table (triggers on properties + properties_extension) + one-shot
backfill from property_details.listing_events for pre-trigger history.
Tax reassessment forecast CA · Resets to sale price
- Current annual tax
- $458 · $38/mo
- Projected year-2 tax
- $1,709 · $142/mo
- Expected delta
- +$1,251/yr (+$104/mo · 273.2%)
ⓘ Screening estimate from a state-policy table — verify with the county assessor before closing.
Climate risk First Street
- Flood 1/10 Low FEMA zone X (unshaded) · 0% chance over 30 yrs
- Wildfire 8/10 Severe
- Heat 8/10 Severe 7 d/yr ≥103°F today · 21 d/yr by 30 yrs out
- Wind 1/10 Low
- Air quality 10/10 Extreme 28 unhealthy d/yr today · 34 by 30 yrs out
Nearby sold comps map
Loading sold comps map…
Walkable amenities ~0.75 mi
Loading nearby amenities…
Taxation est. · year 1
- Rental income
- $33,611
- − Mortgage interest
- −$12,598
- − Property taxes
- −$458
- − Insurance
- −$1,124
- − Repairs & maintenance
- −$2,689
- − Management
- −$2,689
- − Depreciation
- −$6,543
- Taxable income
- $7,511
- Est. tax owed @ 24.0%
- −$1,803
- After-tax cash flow
- $9,015/yr
For passive investors: Depreciation is non-cash, so a rental often shows a tax loss while cash-flowing — sheltering income. Rental losses are passive: they offset passive income freely, and up to $25,000/yr can offset ordinary (W-2) income if you actively participate and your MAGI is under $100k (phasing out to $0 by $150k); unused losses carry forward. On sale, claimed depreciation is recaptured at up to 25%, and gains may owe capital-gains tax (a 1031 exchange can defer both). Figures are a year-1 estimate at your 24.0% rate — not tax advice; consult a CPA.
Schools (NCES district)
- District
- Jurupa Unified
- NCES district ID
- 0619260
- Math proficiency
- 25% ▲ 2.00%
- Reading proficiency
- 38% ▲ 2.00%
- Median HH income
- $58,100
- Composite
- 30.97/100
- National rank
- #11327
- State rank
- #953 of 1400 in CA
Livability — Jurupa Valley
- Score
- 49/100
- State rank
- #1170
- US rank
- #25915
Category grades
Schools grade is shown separately in the Schools card above.
Census & demographics
- Census place
- Jurupa Valley, CA
- County
- Riverside County · 2,287,001 people
- City population
- 119,165
- Metro
- Riverside-San Bernardino-Ontario, CA
- Population (ZIP)
- 81,182
- Household income
- $95,355
- Rent vs Own
- Severe rent burden
- 1694.0
Population outlook (Riverside County) Hauer SSP2
- Today (2025)
- 2,664,475 people
- By 2030
- 2,802,692 · +5.2%
- By 2040
- 3,050,904 · +14.5%
- By 2050
- 3,256,783 · +22.2%
- By 2075
- 3,655,058 · +37.2%
- By 2100
- 3,766,594 · +41.4%
Race, ethnicity, and origin ACS 2023
- Neighborhood character
- Predominantly Hispanic (74%)
- Race & ethnicity
- Hispanic / Latino 74% White 17% Two or more races 16% Black 4% Asian 4% Native American 1%
- Hispanic origin (detail)
- Mexican 67%
- Common ancestry
- Lithuanian 1%
- Foreign-born
- 28% · Canada, China, Vietnam
- Languages at home
- 42% English-only · Spanish 54% Other Indo-European 1% Tagalog/Filipino 1%
Political lean MEDSL · Riverside
- 2024 margin
- Toss-up / Even · D 48.0% · R 49.3% · Other 2.6%
- 2008→2024 swing
- -3.6pp toward R · 2008: 2.3pp · 2024: -1.3pp
- All cycles
- 2024: R+1.3 2020: D+8.0 2016: D+4.3 2012: R+0.4 2008: D+2.3
Not yet ingested
- Civics
- —
Market trends
- HPI YoY
- ▼ -374.91%
- Current HPI
- 464.8939
- Rent YoY
- ▲ 1.31%
- Metro
- Riverside-San Bernardino-Ontario, CA
- State GDP YoY
- ▲ 3.21%
- F500 in state
- 116
Industry mix (Fortune 500 HQ in CA)
| Industry | F500 HQs | Revenue |
|---|---|---|
| Technology | 27 | $1,492B |
|
||
| Financial Services | 3 | $174B |
|
||
| Retail | 3 | $44B |
|
||
| Insurance | 3 | $26B |
|
||
| Media / Entertainment | 2 | $115B |
|
||
| Pharmaceuticals / Biotech | 2 | $62B |
|
||
Price history
1 event — show timeline
- 2026-05-27 Listed $224,900 CRMLS
Property tax history
-1.5%/yrLatest (2025): $458 · +2.2% YoY. Source: county tax records.
Cash-flow waterfall
monthlySold comps — $/sqft
last 12 mo · ≤1 miLoading sold comps…