 🏷️ Likely Rental
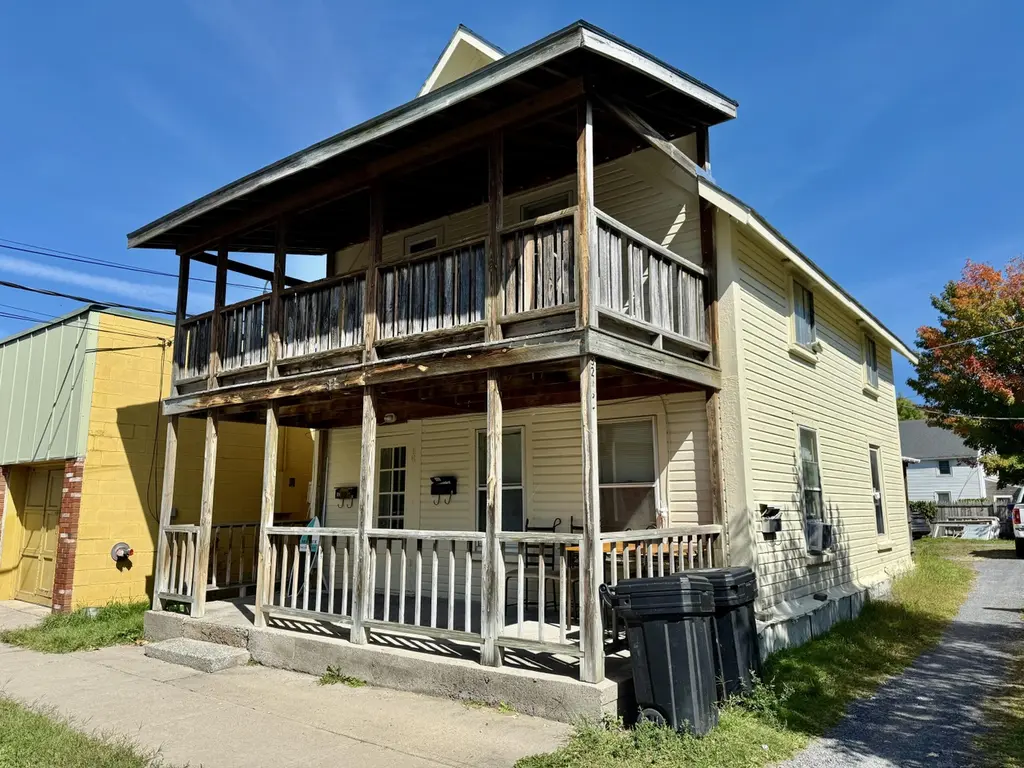
82 Montcalm Ave · Plattsburgh, NY
Flood risk 1/10 · Minimal
- FEMA flood zone
- X (unshaded)
- Chance of flooding over 30 yrs
- 0.0%
- Est. flood insurance / yr
- $507 – $1,088
Fire risk 1/10 · Minimal
- Est. fire insurance / yr
- $691 – $1,283
Heat risk 3/10 · Minor
- Hot days now (above 93°F)
- 7 days/yr
- Hot days in 30 yrs
- 15 days/yr
Wind risk 1/10 · Minimal
- Chance of severe wind over 30 yrs
- 0.0%
Air-quality risk 2/10 · Minimal
- Unhealthy air days now
- 1 days/yr
- Unhealthy air days in 30 yrs
- 1 days/yr
Risk factors via First Street. Map © Google.
Why this score? — see what drove the B+ grade
The composite is a weighted blend of 9 inputs, each scored 0–100. Each bar is that input's sub-score; the figure is the points it added to the 100-point composite (weight × sub-score).
- Cash flow +30.0/30.0
- ARV discount +15.0/15.0
- 1% rule +10.0/10.0
- DSCR +10.0/10.0
- Livability +3.8/5.0
- Schools +3.7/10.0
- Rent growth +2.5/5.0
- Condition / age +2.5/5.0
- Appreciation +0.0/10.0
$230,000
🖨 Deal sheet 📄 Offer letter ✓ Due diligence
Multi-family units
County records classify this as Multi-Family (2-4 Unit). Listing-text estimate: 3 units. confirmed
Listing remarks MLS
Welcome to 82 Montcalm Avenue in Plattsburgh — a well-performing triplex that delivers $2,750 per month in gross rental income and a proven history of stable occupancy. This property features three one-bedroom, one-bathroom apartments with off-street parking, making it highly rentable and easy to manage. Rents are currently in line with market averages, providing immediate, reliable cash flow with built-in upside for an investor who wants to add value through light updates or improved management. Located within the City of Plattsburgh, this is a turnkey income property with consistent performance and clear long-term potential. A smart opportunity to start or strengthen your portfolio with real income from day one.
Key facts
- 3,700 sq ft lot
- Built 1930
- Listed 265 days
Neighborhood map
What this means for you Summary
Snapshot
- This is a 3 × 1-bed/1-bath units multifamily listed at $230k.
Deal economics
- At list price, monthly cash flow is $1k ($12k/yr) — positive. Per door: $341/mo.
- The deal already cash-flows at list — no discount required.
- Meets the 1% rule at list price ($3k rent vs $230k).
- Recommended offer: $202k (12.0% below list) — sets the bar for market timing.
- Cap rate 11.6% vs local median 2.8% in Plattsburgh — top-decile yield for the area; either an underpriced asset or a hidden risk that comps aren't pricing in. Stress-test before assuming the spread holds.
Location & tenants
- Location reads 75/100 on livability (#262 in NY, #4,134 nationally) — a middle-class / working-renter tenant base. Strengths: health & safety A+, cost of living A, housing A; Watch: schools C-, employment D+, crime F.
- Plattsburgh City School District (town): math 33% / reading 55% proficiency, ranked #484 of 590 in NY (top 82%) — families likely to look elsewhere, expect single-tenant / working-renter base with shorter leases.
- Market conditions: 176 active listings in the ZIP; 192 units permitted in Clinton County in 2024 (64 in 5+ unit buildings).
Forward outlook
- Local home prices are declining (-3.0%/yr); year-one equity from $2k of loan paydown is wiped out by about $7k of value loss. Plan a longer hold.
- Clinton County population projected at -16% by 2050 — secular population decline; favor cash flow + early exit over multi-decade hold.
- At projected returns (-3.0% appreciation + 3.0% rent growth), your $64k cash investment doubles in ~7 years — after that, you're playing with house money.
Negotiation context
- It's been on market 266 days — a 12% lower offer ($202k) is reasonable based on typical stale-listing flexibility.
- 2 sale attempts since 4y ago with the ask held roughly flat each time — persistent listings suggest the price (not the market) is what's stuck; bring a comps-based counter.
- Current owner paid $167k; 38% above their basis — modest negotiation headroom, anchor on the comps not their cost.
Risks & watch-outs
- Watch-outs: built in 1930 — expect roof / HVAC / electrical / plumbing capex.
Questions for the listing agent
- It's been on market 266 days. Have you received any prior offers? Is the seller open to a 12% concession, seller financing, or rate buy-down credit?
- Can we see the unit-by-unit rent roll, current vacancy, and any below-market leases? What's the average tenancy length?
- What capital expenditures (roof, boiler, parking lot, exteriors) have been made in the last 5 years, and what's planned in the next 2?
- Built in 1930 — when were the roof, HVAC, electrical panel, plumbing, and water heater last replaced?
- Why hasn't it sold? Are there any deal-killer items the seller is aware of (foundation, flood, title, zoning, code violations)?
- Is there a deadline driving the sale (1031 exchange, divorce, estate, relocation)? That informs how much negotiation room exists.
- Crime grade is F in this area — have there been break-ins, vandalism, or insurance claims at this property in the last 3 years? What carrier currently insures it and at what premium?
- What's the average days-on-market for RENTAL listings here right now (not sales)? A rising rental-DOM trend means longer vacancies and softer asking-rent achievability than the comps imply.
- What's the recent tenant-quality profile in this submarket — average credit score on applications, eviction rate, late-payment / NSF rate, and stable-employment percentage? A property-management company in the area should have these aggregated.
- How much new apartment / multifamily construction is in the pipeline within 1–3 miles? Heavy new supply (>2% of stock underway) typically softens rents 12–24 months out; light construction supports rent growth.
Investment metrics
- 1% rule
- 1.50% ✓
- Cap rate
- 11.63%
- Cash-on-cash
- 19.07%
- DSCR
- 1.85
- GRM
- 5.5
CMA / ARV
- ARV (median comp)
- $342,561
- List price
- $230,000
- Delta
- -32.86%
- Verdict
- UNDERPRICED
- Comps
- 19 within 1.0 mi
Projected returns pro-forma
-3.0% appreciation · 3.0% rent growth · sell at horizon
- IRR
- 11.0%
- Equity multiple
- 1.44×
- Total profit
- $28,024
- Equity at exit
- $34,294
- IRR
- 20.1%
- Equity multiple
- 2.69×
- Total profit
- $108,831
- Equity at exit
- $19,886
Cash invested: $64,400 (down + closing). Projections, not guarantees.
Landlord ↔ Tenant lean methodology
- Overall (STATE)
- 15 Strongly Tenant-Friendly
- State New York
- 15 Strongly Tenant-Friendly · D+10
- County
- — inherits STATE
- City
- — inherits STATE
ZIP-level market 12901
- Home prices YoY
- -22.5%
- Active inventory
- 176
- Price-to-rent
- 16.6×
Monthly cashflow live
- Estimated rent
- $3,460 medium interval (Pro) →
- Mortgage (P&I)
- −$1,206
- Tax from tax record
- −$408 /mo · $4,899/yr
- Insurance
- −$96
- HOA
- −$0
- Vacancy / Maint / Mgmt
- −$727
- Net cashflow
- $1,023
Break-even live
3-unit breakdown (identical units grouped — click to expand)
| Units | Beds | Baths | Est. rent |
|---|---|---|---|
| 3× units | 1 | 1 | $3,459 |
| #1 | 1 | 1 | $1,153 |
| #2 | 1 | 1 | $1,153 |
| #3 | 1 | 1 | $1,153 |
| Total (3 units) | $3,460 | ||
UW: 25.0% down · 7.5% · 30yr · 1.5% tax · 5.0% vac · 8.0% maint · 8.0% mgmt
Financing live
Cash to close
- Down payment
- $57,500
- Closing costs
- $6,900
- Reserves months
- —
- Total cash needed
- —
Loan-product check · same deal, 3 products live
Conventional
25% down · 7.5% · 30yr
- Down + closing
- —
- Monthly P&I
- —
- Monthly cashflow
- —
- DSCR
- —
- Eligible?
- —
Personal DTI + credit; lowest rate.
DSCR
20% down · 8.5% · 30yr
- Down + closing
- —
- Monthly P&I
- —
- Monthly cashflow
- —
- DSCR
- —
- Eligible?
- —
No personal income docs; deal must DSCR.
Hard money
10% down · 12.0% · 12mo
- Down + closing
- —
- Monthly P&I
- —
- Monthly cashflow
- —
- DSCR
- —
- Eligible?
- —
Short-term bridge; refi at stabilization.
Listing history 19 events
-
2026-06-18days on market $230,000 Active 266 DOM
-
2026-06-17days on market $230,000 Active 265 DOM
-
2026-06-16days on market $230,000 Active 264 DOM
-
2026-06-15days on market $230,000 Active 263 DOM
-
2026-06-13days on market $230,000 Active 261 DOM
-
2026-06-12days on market $230,000 Active 260 DOM
-
2026-06-09days on market $230,000 Active 257 DOM
-
2026-06-08days on market $230,000 Active 256 DOM
-
2026-06-07days on market $230,000 Active 255 DOM
-
2026-06-07days on market $230,000 Active 254 DOM
-
2026-06-04days on market $230,000 Active 251 DOM
-
2026-06-02days on market $230,000 Active 250 DOM
-
2026-06-01days on market $230,000 Active 249 DOM
-
2026-05-31days on market $230,000 Active 248 DOM
-
2025-09-25$230,000 Active 729-char remark
Show marketing remark (729 chars)
Welcome to 82 Montcalm Avenue in Plattsburgh — a well-performing triplex that delivers $2,750 per month in gross rental income and a proven history of stable occupancy. This property features three one-bedroom, one-bathroom apartments with off-street parking, making it highly rentable and easy to manage. Rents are currently in line with market averages, providing immediate, reliable cash flow with built-in upside for an investor who wants to add value through light updates or improved management. Located within the City of Plattsburgh, this is a turnkey income property with consistent performance and clear long-term potential. A smart opportunity to start or strengthen your portfolio with real income from day one.
-
2023-03-29soldstatus $166,700 Closed 167-char remark
Show marketing remark (167 chars)
Income generating property with potential to grow. 2 of the 3 apartments are rented, has always rented easily. Off street parking is nice to have in this neighborhood.
-
2022-12-05historical 167-char remark
Show marketing remark (167 chars)
Income generating property with potential to grow. 2 of the 3 apartments are rented, has always rented easily. Off street parking is nice to have in this neighborhood.
-
2022-06-26$165,000 167-char remark
Show marketing remark (167 chars)
Income generating property with potential to grow. 2 of the 3 apartments are rented, has always rented easily. Off street parking is nice to have in this neighborhood.
-
1993-05-27soldstatus $52,000
ⓘ Source: listings_history table (triggers on properties + properties_extension) + one-shot
backfill from property_details.listing_events for pre-trigger history.
Tax reassessment forecast NY · Partial reset (capped growth)
- Current annual tax
- $4,899 · $408/mo
- Projected year-2 tax
- $4,899 · $408/mo
- Expected delta
- $0/yr ($0/mo · 0.0%)
ⓘ Screening estimate from a state-policy table — verify with the county assessor before closing.
Climate risk First Street
- Flood 1/10 Low FEMA zone X (unshaded) · 0% chance over 30 yrs
- Wildfire 1/10 Low
- Heat 3/10 Moderate 7 d/yr ≥93°F today · 15 d/yr by 30 yrs out
- Wind 1/10 Low 0% chance of damaging wind over 30 yrs
- Air quality 2/10 Low 1 unhealthy d/yr today · 1 by 30 yrs out
Nearby sold comps map
Loading sold comps map…
Walkable amenities ~0.75 mi
Loading nearby amenities…
Taxation est. · year 1
- Rental income
- $41,520
- − Mortgage interest
- −$12,884
- − Property taxes
- −$4,899
- − Insurance
- −$1,150
- − Repairs & maintenance
- −$3,322
- − Management
- −$3,322
- − Depreciation
- −$6,691
- Taxable income
- $9,254
- Est. tax owed @ 24.0%
- −$2,221
- After-tax cash flow
- $10,057/yr
For passive investors: Depreciation is non-cash, so a rental often shows a tax loss while cash-flowing — sheltering income. Rental losses are passive: they offset passive income freely, and up to $25,000/yr can offset ordinary (W-2) income if you actively participate and your MAGI is under $100k (phasing out to $0 by $150k); unused losses carry forward. On sale, claimed depreciation is recaptured at up to 25%, and gains may owe capital-gains tax (a 1031 exchange can defer both). Figures are a year-1 estimate at your 24.0% rate — not tax advice; consult a CPA.
Schools (NCES district)
- District
- Plattsburgh City School District
- NCES district ID
- 3623280
- Math proficiency
- 33% ▼ -16.00%
- Reading proficiency
- 55% ▲ 5.00%
- Median HH income
- $38,322
- Composite
- 36.61/100
- National rank
- #4626
- State rank
- #484 of 590 in NY
Livability — Plattsburgh
- Score
- 75/100
- State rank
- #262
- US rank
- #4134
Category grades
Schools grade is shown separately in the Schools card above.
Census & demographics
- Census place
- Plattsburgh, NY
- Population (ZIP)
- 32,012
Population outlook (Clinton County) Hauer SSP2
- Today (2025)
- 78,791 people
- By 2030
- 76,848 · -2.5%
- By 2040
- 71,579 · -9.2%
- By 2050
- 66,471 · -15.6%
- By 2075
- 57,361 · -27.2%
- By 2100
- 47,232 · -40.1%
Race, ethnicity, and origin ACS 2023
- Neighborhood character
- Predominantly White (87%)
- Race & ethnicity
- White 87% Two or more races 5% Hispanic / Latino 4% Black 3% Asian 3%
- Common ancestry
- Lithuanian 15% Romanian 3% Slovak 2%
- Foreign-born
- 6% · Canada, China
- Languages at home
- 92% English-only · Spanish 2% French/Haitian/Cajun 2% Other Indo-European 1%
Political lean MEDSL · Clinton
- 2024 margin
- Toss-up / Even · D 48.9% · R 51.1%
- 2008→2024 swing
- -25.1pp toward R · 2008: 22.9pp · 2024: -2.2pp
- All cycles
- 2024: R+2.2 2020: D+5.2 2016: D+0.9 2012: D+25.6 2008: D+22.9
Not yet ingested
- Civics
- —
Market trends
- HPI YoY
- ▼ -73.55%
- Current HPI
- 252.8692
- Rent YoY
- —
- Metro
- —
- State GDP YoY
- ▲ 2.60%
- F500 in state
- 92
Industry mix (Fortune 500 HQ in NY)
| Industry | F500 HQs | Revenue |
|---|---|---|
| Financial Services | 10 | $950B |
|
||
| Consumer Goods | 9 | $162B |
|
||
| Insurance | 4 | $225B |
|
||
| Telecommunications | 2 | $144B |
|
||
| Pharmaceuticals | 2 | $112B |
|
||
| Media / Entertainment | 2 | $69B |
|
||
Price history
+342.3% since first listed5 events — show timeline
- 2025-09-25 Listed $230,000 ACVMLS
- 2023-03-29 Sold (MLS) $166,700 ACVMLS
- 2022-12-05 Delisted — ACVMLS
- 2022-06-26 Listed $165,000 ACVMLS
- 1993-05-27 Sold (Public Records) $52,000 Public Records
Property tax history
+4.1%/yrLatest (2025): $4,899 · +11.8% YoY. Source: county tax records.
Cash-flow waterfall
monthlySold comps — $/sqft
last 12 mo · ≤1 miLoading sold comps…