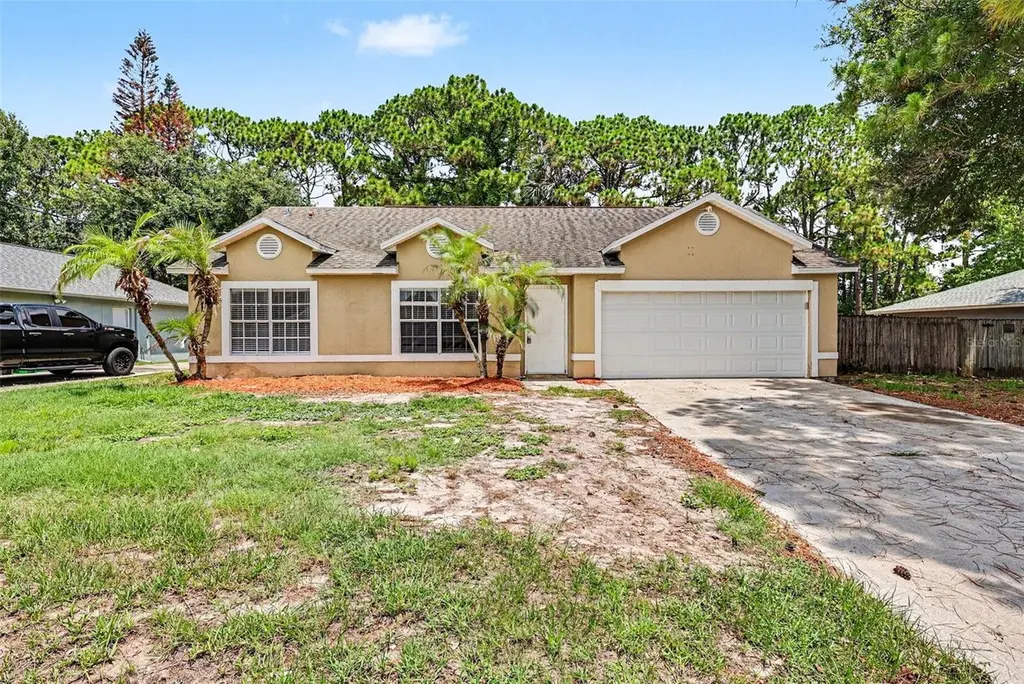
4680 Greenhill St · Port St. John, FL
Flood risk 1/10 · Minimal
- FEMA flood zone
- X (unshaded)
- Chance of flooding over 30 yrs
- 0.0%
- Est. flood insurance / yr
- $507 – $1,088
Fire risk 4/10 · Minor
- Est. fire insurance / yr
- $947 – $1,759
Heat risk 10/10 · Severe
- Hot days now (above 106°F)
- 7 days/yr
- Hot days in 30 yrs
- 21 days/yr
Wind risk 10/10 · Severe
- Chance of severe wind over 30 yrs
- 99.0%
Air-quality risk 1/10 · Minimal
- Unhealthy air days now
- 0 days/yr
- Unhealthy air days in 30 yrs
- 0 days/yr
Risk factors via First Street. Map © Google.
Why this score? — see what drove the C+ grade
The composite is a weighted blend of 9 inputs, each scored 0–100. Each bar is that input's sub-score; the figure is the points it added to the 100-point composite (weight × sub-score).
- Cash flow +26.2/30.0
- DSCR +8.9/10.0
- ARV discount +7.5/15.0
- 1% rule +7.2/10.0
- Schools +4.7/10.0
- Rent growth +3.1/5.0
- Livability +2.5/5.0
- Condition / age +2.5/5.0
- Appreciation +0.0/10.0
$199,900
🖨 Deal sheet (PDF) 📄 Offer letter ✓ Due diligence
Listing remarks MLS
Perfect home. This bright & charming home is just what your client is looking for. New granite countertops, all appliances included, large screened Florida Room & much more!!
Key facts
- One story layout
- 0.24 acre lot
- 2 garage spots
Tags
Property features AI
Finance
- Other: Zoned RU-1-9; Lot size approximately 0.24 acres
Exterior
- Parking: Attached garage; 2-car garage
- Utilities: Public water; Septic tank; Water connected
- Home design: Single family residence; Residential property; One story; Southwest facing
- Construction: Block, stucco and frame construction; Shingle roof; Slab foundation; Built with living area of 1,132 (public records)
- Exterior features: Patio; Porch; Outdoor lighting; Private mailbox; Rain gutters; Sliding doors; Asphalt road access
Interior
- Kitchen: Dishwasher; Microwave; Range; Refrigerator
- Bedrooms: 3 bedrooms
- Flooring: Carpet; Ceramic tile; Laminate
- Bathrooms: 2 full bathrooms
- Heating & cooling: Central heating (electric); Central air conditioning
- Interior features: Ceiling fans; Living room/dining room combo; Stone countertops; Thermostat
- Laundry & utility: Laundry room
Neighborhood map
What this means for you Summary
Snapshot
- This is a 3-bed/2.0-bath single-family listed at $200k.
Deal economics
- At list price, monthly cash flow is $512 ($6k/yr) — positive.
- The deal already cash-flows at list — no discount required.
- Meets the 1% rule at list price ($2k rent vs $200k).
Location & tenants
- Location reads: area grade C — affects rentability + tenant quality, not the cash-flow math above.
- Brevard (suburban): math 53% / reading 57% proficiency, ranked #19 of 73 in FL (top 26%) — acceptable for families but not a draw, mixed tenant base, ~2y average lease.
- Zoned schools: Cape View Elementary School (math 62% / reading 62%, grade B, #608 of 2,144 statewide, top 29%, 305 students, 61% FRL) — zoned schools average 61% FRL vs 43% district-wide (18 pts higher); higher-poverty schools than district average — tighter screening recommended.
- Market conditions: Rents rising (+2.5%/yr); 224 active listings in the ZIP; 8 comparable units currently listed for rent nearby; rentals at typical pace (median 24d on market — plan ~3-4 weeks tenant-placement turnaround); solid renter incomes; 4,602 units permitted in Brevard County in 2024 (702 in 5+ unit buildings).
- This rent runs 34% of the median local income ($86k/yr) — at the standard rent-burdened threshold; future hikes will face affordability resistance.
Forward outlook
- Local home prices are declining (-3.0%/yr); year-one equity from $1k of loan paydown is wiped out by about $6k of value loss. Plan a longer hold.
- Brevard County population projected at +15% by 2050 — modest demand growth; plan on rents tracking national, not racing it.
Negotiation context
- Only 6 days on market — expect competitive offers; lowballing is unlikely to land.
- 2 sale attempts since 18y ago with the ask held roughly flat each time — persistent listings suggest the price (not the market) is what's stuck; bring a comps-based counter.
- Current owner paid $68k; list at $200k implies a 192% gain — meaningful room to come down on a strong offer.
Risks & watch-outs
- Climate carrying-cost: severe wind risk, 99% chance of damaging wind over 30y; extreme-heat days projected 7→21/yr by 2055 (HVAC capex compounding) — expect insurance premiums to compound above CPI over the hold.
Questions for the listing agent
- Is there a deadline driving the sale (1031 exchange, divorce, estate, relocation)? That informs how much negotiation room exists.
- What's the average days-on-market for RENTAL listings here right now (not sales)? A rising rental-DOM trend means longer vacancies and softer asking-rent achievability than the comps imply.
- What's the recent tenant-quality profile in this submarket — average credit score on applications, eviction rate, late-payment / NSF rate, and stable-employment percentage? A property-management company in the area should have these aggregated.
- How much new for-sale + rental construction is in the pipeline within 1–3 miles? Heavy new supply typically softens prices + rents 12–24 months out; constrained supply supports both.
Investment metrics
- 1% rule
- 1.22% ✓
- Cap rate
- 9.37%
- Cash-on-cash
- 10.98%
- DSCR
- 1.49
- GRM
- 6.8
CMA / ARV
No comps found within radius.
Projected returns pro-forma
-3.0% appreciation · 2.48% rent growth · sell at horizon
- IRR
- -0.5%
- Equity multiple
- 0.98×
- Total profit
- $-990
- Equity at exit
- $29,806
- IRR
- 8.7%
- Equity multiple
- 1.65×
- Total profit
- $36,213
- Equity at exit
- $17,284
Cash invested: $55,972 (down + closing). Projections, not guarantees.
Landlord ↔ Tenant lean methodology
- Overall (STATE)
- 87 Strongly Landlord-Friendly
- State Florida
- 87 Strongly Landlord-Friendly · R+3
- County
- — inherits STATE
- City
- — inherits STATE
ZIP-level market 32927
- Home prices YoY
- -19.4%
- Rents YoY
- 2.5%
- Active inventory
- 224
- Price-to-rent
- 6.8×
Monthly cashflow live
- Estimated rent
- $2,436 high interval (Pro) →
- Mortgage (P&I)
- −$1,048
- Tax from tax record
- −$281 /mo · $3,367/yr
- Insurance
- −$83
- HOA
- −$0
- Vacancy / Maint / Mgmt
- −$512
- Net cashflow
- $512
Break-even live
Sensitivity live
| Price | -10% $625 | -5% $569 | +0% $512 | +5% $456 | +10% $399 |
|---|---|---|---|---|---|
| Rent | -10% $320 | -5% $416 | +0% $512 | +5% $608 | +10% $705 |
| Rate | -1.0pp $613 | -0.5pp $563 | base $512 | +0.5pp $460 | +1.0pp $408 |
UW: 25.0% down · 7.5% · 30yr · 1.5% tax · 5.0% vac · 8.0% maint · 8.0% mgmt
Financing live
Cash to close
- Down payment
- $49,975
- Closing costs
- $5,997
- Reserves months
- —
- Total cash needed
- —
Loan-product check · same deal, 3 products live
Conventional
25% down · 7.5% · 30yr
- Down + closing
- —
- Monthly P&I
- —
- Monthly cashflow
- —
- DSCR
- —
- Eligible?
- —
Personal DTI + credit; lowest rate.
DSCR
20% down · 8.5% · 30yr
- Down + closing
- —
- Monthly P&I
- —
- Monthly cashflow
- —
- DSCR
- —
- Eligible?
- —
No personal income docs; deal must DSCR.
Hard money
10% down · 12.0% · 12mo
- Down + closing
- —
- Monthly P&I
- —
- Monthly cashflow
- —
- DSCR
- —
- Eligible?
- —
Short-term bridge; refi at stabilization.
Rent comps 8 comps
| Address | Beds | Baths | Sqft | Rent | $/sqft | DOM | Units | Dist |
|---|---|---|---|---|---|---|---|---|
| 6655 Corto Rd Cocoa, FL | 3.0 | 2.0 | 1441 | $3,300 | $2.29 | 15d | 1 | 0.43mi |
| 5075 Hogan Pl Unit 2 Cocoa, FL | 2.0 | 1.0 | 1200 | $1,500 | $1.25 | 24d | 1 | 0.49mi |
| 4270 Fairfax St Cocoa, FL | 3.0 | 2.0 | 1357 | $2,800 | $2.06 | 24d | 1 | 0.58mi |
| 5215 Holden Rd Cocoa, FL | 3.0 | 2.0 | 1480 | $2,185 | $1.48 | 19d | 1 | 0.83mi |
| 6385 Wien Ln Cocoa, FL | 3.0 | 2.0 | 1350 | $2,350 | $1.74 | 19d | 1 | 0.94mi |
| 426 Oakridge Ave Cocoa, FL | 3.0 | 2.0 | 1286 | $1,550 | $1.21 | 24d | 1 | 1.30mi |
| 835 Kanawha St Cocoa, FL | 2.0 | 1.0 | 720 | $1,500 | $2.08 | 24d | 1 | 1.33mi |
| 865 Dunbar St Cocoa, FL | 3.0 | 2.0 | 1307 | $2,350 | $1.80 | 24d | 1 | 1.42mi |
Listing history 7 events
-
2026-06-19status $199,900 Pending 6 DOM
-
2026-06-18days on market $199,900 Active 6 DOM
-
2026-06-17days on market $199,900 Active 5 DOM
-
2026-06-16days on market $199,900 Active 4 DOM
-
2026-06-15days on market $199,900 Active 3 DOM
-
2026-06-14remarks 689-char remark
-
2026-06-14$199,900 Active 1 DOM
ⓘ Source: listings_history table (triggers on properties + properties_extension) + one-shot
backfill from property_details.listing_events for pre-trigger history.
Tax reassessment forecast FL · Resets to sale price
- Current annual tax
- $3,367 · $281/mo
- Projected year-2 tax
- $3,367 · $281/mo
- Expected delta
- $0/yr ($0/mo · 0.0%)
ⓘ Screening estimate from a state-policy table — verify with the county assessor before closing.
Climate risk First Street
- Flood 1/10 Low FEMA zone X (unshaded) · 0% chance over 30 yrs
- Wildfire 4/10 Moderate
- Heat 10/10 Extreme 7 d/yr ≥106°F today · 21 d/yr by 30 yrs out
- Wind 10/10 Extreme 99% chance of damaging wind over 30 yrs
- Air quality 1/10 Low 0 unhealthy d/yr today · 0 by 30 yrs out
Nearby sold comps map
Loading sold comps map…
Walkable amenities ~0.75 mi
Loading nearby amenities…
Taxation est. · year 1
- Rental income
- $29,229
- − Mortgage interest
- −$11,198
- − Property taxes
- −$3,367
- − Insurance
- −$1,000
- − Repairs & maintenance
- −$2,338
- − Management
- −$2,338
- − Depreciation
- −$5,815
- Taxable income
- $3,173
- Est. tax owed @ 24.0%
- −$762
- After-tax cash flow
- $5,383/yr
For passive investors: Depreciation is non-cash, so a rental often shows a tax loss while cash-flowing — sheltering income. Rental losses are passive: they offset passive income freely, and up to $25,000/yr can offset ordinary (W-2) income if you actively participate and your MAGI is under $100k (phasing out to $0 by $150k); unused losses carry forward. On sale, claimed depreciation is recaptured at up to 25%, and gains may owe capital-gains tax (a 1031 exchange can defer both). Figures are a year-1 estimate at your 24.0% rate — not tax advice; consult a CPA.
Schools (NCES district)
- District
- Brevard
- NCES district ID
- 1200150
- Math proficiency
- 53% ▼ -9.00%
- Reading proficiency
- 57% ▼ -4.00%
- Median HH income
- $49,426
- Composite
- 46.86/100
- National rank
- #2370
- State rank
- #19 of 73 in FL
Livability — Port St. John
No livability data for this city. (Only ~50 U.S. cities are tracked.)
Census & demographics
- Census place
- Port St. John, FL
- County
- Brevard County · 602,871 people
- City population
- 28,493
- Metro
- Palm Bay-Melbourne-Titusville, FL
- Population (ZIP)
- 29,219
- Household income
- $86,075
- Rent vs Own
- Severe rent burden
- 192.0
Population outlook (Brevard County) Hauer SSP2
- Today (2025)
- 623,254 people
- By 2030
- 648,420 · +4.0%
- By 2040
- 690,009 · +10.7%
- By 2050
- 715,669 · +14.8%
- By 2075
- 775,744 · +24.5%
- By 2100
- 776,687 · +24.6%
Race, ethnicity, and origin ACS 2023
- Neighborhood character
- Predominantly White (82%)
- Race & ethnicity
- White 82% Two or more races 8% Hispanic / Latino 5% Black 5%
- Hispanic origin (detail)
- Puerto Rican 2%
- Common ancestry
- Lithuanian 3% Slovak 2% Iranian 2%
- Foreign-born
- 5% · Canada
- Languages at home
- 94% English-only · Spanish 3% French/Haitian/Cajun 1% German/W. Germanic 1%
Political lean MEDSL · Brevard
- 2024 margin
- Strong R (+20.8) · D 39.1% · R 59.9% · Other 1.0%
- 2008→2024 swing
- -10.4pp toward R · 2008: -10.4pp · 2024: -20.8pp
- All cycles
- 2024: R+20.8 2020: R+16.4 2016: R+19.8 2012: R+12.7 2008: R+10.4
Not yet ingested
- Civics
- —
Market trends
- HPI YoY
- ▼ -79.36%
- Current HPI
- 330.5099
- Rent YoY
- ▲ 2.48%
- Metro
- Palm Bay-Melbourne-Titusville, FL
- State GDP YoY
- ▲ 3.28%
- F500 in state
- 36
Industry mix (Fortune 500 HQ in FL)
| Industry | F500 HQs | Revenue |
|---|---|---|
| Industrial Technology | 2 | $29B |
|
||
| Insurance | 2 | $17B |
|
||
| Retail | 1 | $60B |
|
||
| Technology Distribution | 1 | $58B |
|
||
| Homebuilding | 1 | $35B |
|
||
| Technology Manufacturing | 1 | $35B |
|
||
Price history
+1899.0% since first listed6 events — show timeline
- 2026-06-12 Listed $199,900 Stellar MLS as Distributed by MLS Grid
- 2016-08-16 Listing Removed — SCMLS
- 2008-01-30 Listed $130,000 SCMLS
- 1999-04-09 Sold (Public Records) $68,500 Public Records
- 1996-07-01 Sold (Public Records) $72,500 Public Records
- 1993-07-29 Sold (Public Records) $10,000 Public Records
Property tax history
+13.2%/yrLatest (2025): $3,367 · +6.7% YoY. Source: county tax records.
Cash-flow waterfall
monthlySold comps — $/sqft
last 12 mo · ≤1 miLoading sold comps…