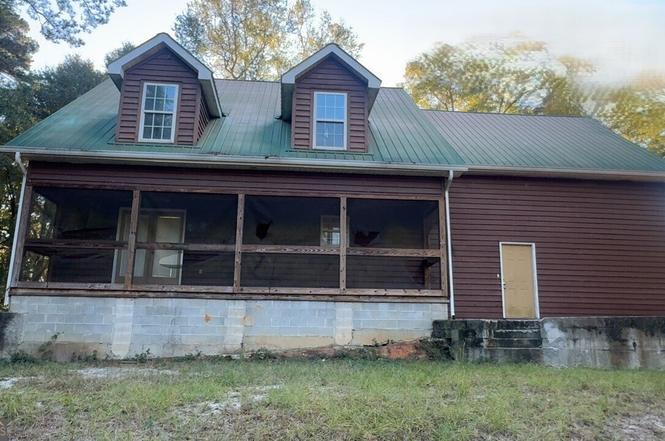
1275 Old Sardis Rd · Sardis, GA
Flood risk 1/10 · Minimal
- FEMA flood zone
- X (unshaded)
- Chance of flooding over 30 yrs
- 0.0%
- Est. flood insurance / yr
- $507 – $1,088
Fire risk 4/10 · Minor
- Est. fire insurance / yr
- $963 – $1,789
Heat risk 7/10 · Major
- Hot days now (above 109°F)
- 7 days/yr
- Hot days in 30 yrs
- 15 days/yr
Wind risk 8/10 · Major
- Chance of severe wind over 30 yrs
- 80.0%
Air-quality risk 2/10 · Minimal
- Unhealthy air days now
- 2 days/yr
- Unhealthy air days in 30 yrs
- 2 days/yr
Risk factors via First Street. Map © Google.
Why this score? — see what drove the D+ grade
The composite is a weighted blend of 9 inputs, each scored 0–100. Each bar is that input's sub-score; the figure is the points it added to the 100-point composite (weight × sub-score).
- ARV discount +13.2/15.0
- Cash flow +9.1/30.0
- Appreciation +8.9/10.0
- Livability +2.8/5.0
- DSCR +2.5/10.0
- Rent growth +2.5/5.0
- Condition / age +2.5/5.0
- 1% rule +2.2/10.0
- Schools +1.5/10.0
$180,000
🖨 Deal sheet 📄 Offer letter ✓ Due diligence
Listing remarks
Welcome home to this spacious 4 bedroom, 2.5 bath beauty offering 2,784 sq ft of potential and comfort. Built in 2000, this three story home features generous living area, a 2 car garage, bonus room and a layout perfect for anyone looking to create their own personalized retreat. From the moment you step inside, you'll notice the possibilities - whether you're dreaming of a cozy family space, a modern refresh or your own private oasis. With the right touches, this home can truly shine. Conveniently located and attractively priced at 180,00000, this property is the perfect opportunity for homeowner or investors ready to add value and make it their own. Ready to take a tour? Call Your Favorit
Key facts
- 3 acre lot
- Built 2000
- Listed 32 days
Neighborhood map
What this means for you Summary
Snapshot
- This is a 3-bed/2.0-bath single-family listed at $180k.
Deal economics
- At list price, monthly cash flow is $-138 ($-2k/yr) — negative.
- To cash-flow at today's rent, offer at most $156k (13.5% below list).
- To meet the 1% rule (rent ≥ 1% of price), the offer needs to be $129k (28.4% below list).
- Recommended offer: $129k (28.4% below list) — sets the bar for 1% rule.
Location & tenants
- Location reads 55/100 on livability (#510 in GA) — a working-class tenant base; expect higher turnover. Strengths: cost of living A+, housing A+; Watch: crime F, amenities F, commute F.
- Burke County (town): math 16% / reading 21% proficiency, ranked #148 of 174 in GA (top 85%) — low school quality limits family demand, transient renter base, plan for 1-2y turnover; 72% free/reduced lunch — lower-income household profile, screen leases tightly.
- Zoned schools: S G A Elementary School (math 22% / reading 17%, grade F, #878 of 1,228 statewide, top 75%, 274 students, 100% FRL) — zoned schools average 100% FRL vs 72% district-wide (28 pts higher); higher-poverty schools than district average — tighter screening recommended.
- Market conditions: 14 active listings in the ZIP; 65 units permitted in Burke County in 2024 (0 in 5+ unit buildings).
Forward outlook
- In year one you build about $15k of equity ($1k loan paydown + $14k appreciation (7.8% local appreciation)).
- Burke County population projected at -24% by 2050 — secular population decline; favor cash flow + early exit over multi-decade hold.
- By year 3, paydown + projected appreciation supports a ~$38k cash-out refi (75% LTV) — recoverable capital for the next deal without selling this one.
Negotiation context
- It's been on market 32 days — a 3% lower offer ($175k) is reasonable based on typical stale-listing flexibility.
- 7 sale attempts since 4y ago with the ask held roughly flat each time — persistent listings suggest the price (not the market) is what's stuck; bring a comps-based counter.
Risks & watch-outs
- Climate carrying-cost: severe wind risk, 80% chance of damaging wind over 30y; extreme-heat days projected 7→15/yr by 2055 (HVAC capex compounding) — expect insurance premiums to compound above CPI over the hold.
Questions for the listing agent
- What do current leases actually rent for vs. the listed asking? Can we see a recent rent roll and the last 12 months of T-12 income?
- It's been on market 32 days. Have you received any prior offers? Is the seller open to a 28% concession, seller financing, or rate buy-down credit?
- Is there a deadline driving the sale (1031 exchange, divorce, estate, relocation)? That informs how much negotiation room exists.
- Schools are F-rated, which usually means shorter tenancies and higher turnover. Who's the typical renter profile here, and what's been the actual vacancy rate?
- Crime grade is F in this area — have there been break-ins, vandalism, or insurance claims at this property in the last 3 years? What carrier currently insures it and at what premium?
- The area grade is low — what's the realistic commute time and amenity access for the typical tenant pool here? Any planned neighborhood developments (good or bad) we should know about?
- What's the average days-on-market for RENTAL listings here right now (not sales)? A rising rental-DOM trend means longer vacancies and softer asking-rent achievability than the comps imply.
- What's the recent tenant-quality profile in this submarket — average credit score on applications, eviction rate, late-payment / NSF rate, and stable-employment percentage? A property-management company in the area should have these aggregated.
- How much new for-sale + rental construction is in the pipeline within 1–3 miles? Heavy new supply typically softens prices + rents 12–24 months out; constrained supply supports both.
Investment metrics
- 1% rule
- 0.72% ✗
- Cap rate
- 5.38%
- Cash-on-cash
- -3.27%
- DSCR
- 0.85
- GRM
- 11.6
CMA / ARV
- ARV (on-the-fly)
- $206,016
- Comps found
- 2
Show comp detail 2 sales within ~0.75 mi
| Address | Dist | Beds/Ba | Sqft | Sold | Price | $/sf | Match |
|---|---|---|---|---|---|---|---|
| 1275 Old Sardis Rd | 0.00mi | 3/2.5 | 2,784 (0%) | 1mo | $183,750 | $66 | 97 |
| 808 S Hill St | 0.75mi | 3/3.0 | 2,562 (-8%) | 21mo | $190,000 | $74 | 30 |
Match score weights: distance 35% · size 25% · config 20% · recency 20%. Top-matched comps best support the ARV.
Projected returns pro-forma
7.82% appreciation · 3.0% rent growth · sell at horizon
- IRR
- 17.1%
- Equity multiple
- 2.26×
- Total profit
- $63,252
- Equity at exit
- $134,514
- IRR
- 16.4%
- Equity multiple
- 4.77×
- Total profit
- $189,901
- Equity at exit
- $264,902
Cash invested: $50,400 (down + closing). Projections, not guarantees.
Landlord ↔ Tenant lean methodology
- Overall (STATE)
- 90 Strongly Landlord-Friendly
- State Georgia
- 90 Strongly Landlord-Friendly · R+3
- County
- — inherits STATE
- City
- — inherits STATE
ZIP-level market 30456
- Home prices YoY
- 4.2%
- Active inventory
- 14
- Price-to-rent
- 11.6×
Monthly cashflow live
- Estimated rent
- $1,289 medium interval (Pro) →
- Mortgage (P&I)
- −$944
- Tax from tax record
- −$137 /mo · $1,647/yr
- Insurance
- −$75
- HOA
- −$0
- Vacancy / Maint / Mgmt
- −$271
- Net cashflow
- $-138
Break-even live
UW: 25.0% down · 7.5% · 30yr · 1.5% tax · 5.0% vac · 8.0% maint · 8.0% mgmt
Financing live
Cash to close
- Down payment
- $45,000
- Closing costs
- $5,400
- Reserves months
- —
- Total cash needed
- —
Loan-product check · same deal, 3 products live
Conventional
25% down · 7.5% · 30yr
- Down + closing
- —
- Monthly P&I
- —
- Monthly cashflow
- —
- DSCR
- —
- Eligible?
- —
Personal DTI + credit; lowest rate.
DSCR
20% down · 8.5% · 30yr
- Down + closing
- —
- Monthly P&I
- —
- Monthly cashflow
- —
- DSCR
- —
- Eligible?
- —
No personal income docs; deal must DSCR.
Hard money
10% down · 12.0% · 12mo
- Down + closing
- —
- Monthly P&I
- —
- Monthly cashflow
- —
- DSCR
- —
- Eligible?
- —
Short-term bridge; refi at stabilization.
Listing history 17 events
-
2026-05-11historical
-
2026-03-25status Under Contract
-
2026-02-20$180,000 New
-
2026-02-18historical
-
2026-02-17status Back On Market
-
2026-02-15historical
-
2026-02-15historical
-
2025-11-19$199,900
-
2025-11-19$199,900 New
-
2025-11-19$199,900 Active
-
2022-07-18soldstatus $307,000
-
2022-07-11soldstatus $307,000
-
2022-07-11soldstatus $307,000
-
2022-06-01$275,000
-
2022-06-01$275,000
-
2012-09-20soldstatus $94,100
-
2006-05-01soldstatus $127,500
ⓘ Source: listings_history table (triggers on properties + properties_extension) + one-shot
backfill from property_details.listing_events for pre-trigger history.
Tax reassessment forecast GA · Resets to sale price
- Current annual tax
- $1,647 · $137/mo
- Projected year-2 tax
- $1,656 · $138/mo
- Expected delta
- +$9/yr (+$1/mo · 0.6%)
ⓘ Screening estimate from a state-policy table — verify with the county assessor before closing.
Climate risk First Street
- Flood 1/10 Low FEMA zone X (unshaded) · 0% chance over 30 yrs
- Wildfire 4/10 Moderate
- Heat 7/10 Severe 7 d/yr ≥109°F today · 15 d/yr by 30 yrs out
- Wind 8/10 Severe 80% chance of damaging wind over 30 yrs
- Air quality 2/10 Low 2 unhealthy d/yr today · 2 by 30 yrs out
Nearby sold comps map
Loading sold comps map…
Walkable amenities ~0.75 mi
Loading nearby amenities…
Taxation est. · year 1
- Rental income
- $15,473
- − Mortgage interest
- −$10,083
- − Property taxes
- −$1,647
- − Insurance
- −$900
- − Repairs & maintenance
- −$1,238
- − Management
- −$1,238
- − Depreciation
- −$5,236
- Taxable loss
- −$4,869
- Est. tax savings @ 24.0%
- +$1,169
- After-tax cash flow
- $-482/yr
For passive investors: Depreciation is non-cash, so a rental often shows a tax loss while cash-flowing — sheltering income. Rental losses are passive: they offset passive income freely, and up to $25,000/yr can offset ordinary (W-2) income if you actively participate and your MAGI is under $100k (phasing out to $0 by $150k); unused losses carry forward. On sale, claimed depreciation is recaptured at up to 25%, and gains may owe capital-gains tax (a 1031 exchange can defer both). Figures are a year-1 estimate at your 24.0% rate — not tax advice; consult a CPA.
Schools (NCES district)
- District
- Burke County
- NCES district ID
- 1300660
- Math proficiency
- 16% ▼ -12.00%
- Reading proficiency
- 21% ▼ -6.00%
- Median HH income
- $34,532
- Composite
- 15.18/100
- National rank
- #9343
- State rank
- #148 of 174 in GA
Livability — Sardis
- Score
- 55/100
- State rank
- #510
- US rank
- #23227
Category grades
Schools grade is shown separately in the Schools card above.
Census & demographics
- Census place
- Sardis, GA
- Population (ZIP)
- 1,851
Population outlook (Burke County) Hauer SSP2
- Today (2025)
- 21,186 people
- By 2030
- 20,207 · -4.6%
- By 2040
- 18,109 · -14.5%
- By 2050
- 16,102 · -24.0%
- By 2075
- 12,103 · -42.9%
- By 2100
- 9,671 · -54.4%
Race, ethnicity, and origin ACS 2023
- Neighborhood character
- Majority White (53%)
- Race & ethnicity
- White 53% Black 45% Hispanic / Latino 1% Two or more races 1%
- Common ancestry
- Lithuanian 6% Slovak 1%
- Languages at home
- 98% English-only · Spanish 2%
Political lean MEDSL · Burke
- 2024 margin
- Lean R (+9.3) · D 45.1% · R 54.4%
- 2008→2024 swing
- -18.6pp toward R · 2008: 9.2pp · 2024: -9.3pp
- All cycles
- 2024: R+9.3 2020: R+1.8 2016: D+2.6 2012: D+11.3 2008: D+9.2
Not yet ingested
- Civics
- —
Market trends
- HPI YoY
- ▲ 7.82%
- Current HPI
- 191.8851
- Rent YoY
- —
- Metro
- —
- State GDP YoY
- ▲ 2.66%
- F500 in state
- 28
Industry mix (Fortune 500 HQ in GA)
| Industry | F500 HQs | Revenue |
|---|---|---|
| Paper / Packaging | 2 | $29B |
|
||
| Retail | 1 | $160B |
|
||
| Transportation / Logistics | 1 | $91B |
|
||
| Airlines | 1 | $62B |
|
||
| Consumer Goods | 1 | $47B |
|
||
| Utilities | 1 | $25B |
|
||
Price history
+41.2% since first listed17 events — show timeline
- 2026-05-11 Listing Removed — Hive MLS
- 2026-03-25 Pending — GAMLS
- 2026-02-20 Listed $180,000 GAMLS
- 2026-02-18 Listing Removed — GAMLS
- 2026-02-17 Relisted — GAMLS
- 2026-02-15 Listing Removed — Hive MLS
- 2026-02-15 Listing Removed — GAMLS
- 2025-11-19 Listed $199,900 Hive MLS
- 2025-11-19 Listed $199,900 GAMLS
- 2025-11-19 Listed $199,900 Hive MLS
- 2022-07-18 Sold (Public Records) $307,000 Public Records
- 2022-07-11 Sold (MLS) $307,000 Hive MLS
- 2022-07-11 Sold (MLS) $307,000 Hive MLS
- 2022-06-01 Listed $275,000 Hive MLS
- 2022-06-01 Listed $275,000 Hive MLS
- 2012-09-20 Sold (MLS) $94,100 GAMLS
- 2006-05-01 Sold (Public Records) $127,500 Public Records
Property tax history
+2.6%/yrLatest (2025): $1,647 · -7.2% YoY. Source: county tax records.
Cash-flow waterfall
monthlySold comps — $/sqft
last 12 mo · ≤1 miLoading sold comps…