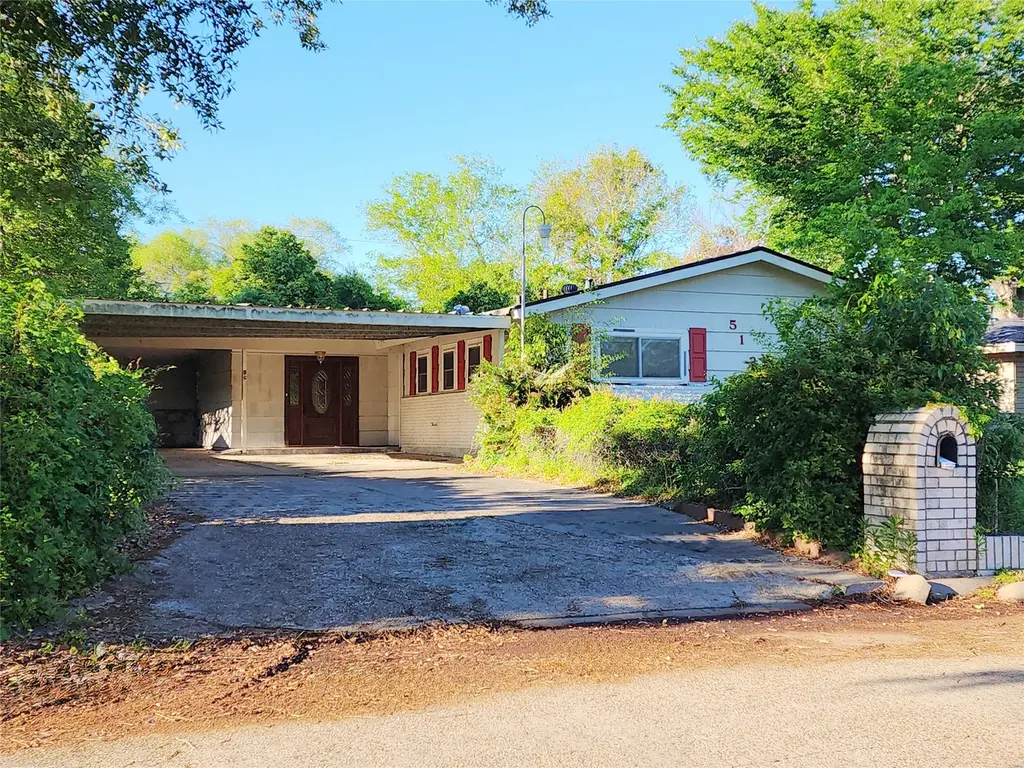
512 Camellia Ave · Orange, TX
Flood risk 5/10 · Moderate
- FEMA flood zone
- X (unshaded)
- Chance of flooding over 30 yrs
- 0.23%
- Est. flood insurance / yr
- $507 – $1,088
Fire risk 2/10 · Minimal
- Est. fire insurance / yr
- $1,222 – $2,270
Heat risk 9/10 · Severe
- Hot days now (above 109°F)
- 7 days/yr
- Hot days in 30 yrs
- 23 days/yr
Wind risk 9/10 · Severe
- Chance of severe wind over 30 yrs
- 99.0%
Air-quality risk 2/10 · Minimal
- Unhealthy air days now
- 1 days/yr
- Unhealthy air days in 30 yrs
- 1 days/yr
Risk factors via First Street. Map © Google.
Why this score? — see what drove the B+ grade
The composite is a weighted blend of 9 inputs, each scored 0–100. Each bar is that input's sub-score; the figure is the points it added to the 100-point composite (weight × sub-score).
- Cash flow +26.5/30.0
- ARV discount +15.0/15.0
- DSCR +9.1/10.0
- 1% rule +9.0/10.0
- Appreciation +5.5/10.0
- Rent growth +3.9/5.0
- Livability +3.6/5.0
- Condition / age +2.5/5.0
- Schools +1.6/10.0
$99,950
🖨 Deal sheet 📄 Offer letter ✓ Due diligence
Listing remarks MLS
Investment Opportunity: Charming Single-Story Home This single-story home presents a remarkable investment opportunity for the right buyer. The property features three bedrooms, a spacious living room, and a cozy family room with a wood-burning fireplace, perfect for chilly winter evenings. In addition, a rear shed provides convenient storage options for your belongings. Although the home needs some TLC, it offers a unique chance for a creative homeowner to add their own personal touch or for an investor seeking their next income-producing property. The established community and convenient location make this residence both attractive and valuable, offering the possibility to transform it into a hidden gem or diamond in the rough. Unlock the potential of this property by scheduling a tour with your representative today. Explore the possibilities and envision how you can make this home your own or turn it into a successful investment. Virtual photos included for illustration only.
Key facts
- Convenient location
- Single-story home
- Rear shed
Tags
Neighborhood map
What this means for you Summary
Snapshot
- This is a 3-bed/1.5-bath single-family listed at $100k.
Deal economics
- At list price, monthly cash flow is $265 ($3k/yr) — positive.
- The deal already cash-flows at list — no discount required.
- Meets the 1% rule at list price ($1k rent vs $100k).
- Recommended offer: $94k (6.0% below list) — sets the bar for market timing.
- Cap rate 9.5% vs local median 3.9% in Orange — top-decile yield for the area; either an underpriced asset or a hidden risk that comps aren't pricing in. Stress-test before assuming the spread holds.
Location & tenants
- Location reads 71/100 on livability (#286 in TX) — a middle-class / working-renter tenant base. Strengths: cost of living A+, housing A+, health & safety A+; Watch: crime D+, employment D+, schools D-.
- West Orange-Cove CISD (suburban): math 17% / reading 21% proficiency, ranked #784 of 826 in TX (top 95%) — low school quality limits family demand, transient renter base, plan for 1-2y turnover; 79% free/reduced lunch — lower-income household profile, screen leases tightly.
- Market conditions: Rents rising fast (+5.7%/yr); 337 active listings in the ZIP; 22 comparable units currently listed for rent nearby; rentals at typical pace (median 22d on market — plan ~3-4 weeks tenant-placement turnaround); 45% of comp listings sitting > 30 days — soft ceiling on asking rent; 235 units permitted in Orange County in 2024 (50 in 5+ unit buildings).
Forward outlook
- In year one you build about $2k of equity ($692 loan paydown + $1k appreciation (1.0% local appreciation)).
- Orange County population projected at +6% by 2050 — modest demand growth; plan on rents tracking national, not racing it.
- At projected returns (1.0% appreciation + 5.7% rent growth), your $28k cash investment doubles in ~5 years — after that, you're playing with house money.
Negotiation context
- It's been on market 73 days — a 6% lower offer ($94k) is reasonable based on typical stale-listing flexibility.
- 5 sale attempts since 8y ago with the ask held roughly flat each time — persistent listings suggest the price (not the market) is what's stuck; bring a comps-based counter.
Risks & watch-outs
- Watch-outs: property tax is 3.3% of price; built in 1958 — expect roof / HVAC / electrical / plumbing capex.
- Climate carrying-cost: moderate flood risk; severe wind risk, 99% chance of damaging wind over 30y; extreme-heat days projected 7→23/yr by 2055 (HVAC capex compounding) — expect insurance premiums to compound above CPI over the hold.
Questions for the listing agent
- It's been on market 73 days. Have you received any prior offers? Is the seller open to a 6% concession, seller financing, or rate buy-down credit?
- Built in 1958 — when were the roof, HVAC, electrical panel, plumbing, and water heater last replaced?
- Property tax is high relative to price — has the assessment been appealed recently, and will the sale trigger a re-assessment?
- Why hasn't it sold? Are there any deal-killer items the seller is aware of (foundation, flood, title, zoning, code violations)?
- Is there a deadline driving the sale (1031 exchange, divorce, estate, relocation)? That informs how much negotiation room exists.
- Schools are D-rated, which usually means shorter tenancies and higher turnover. Who's the typical renter profile here, and what's been the actual vacancy rate?
- Crime grade is D in this area — have there been break-ins, vandalism, or insurance claims at this property in the last 3 years? What carrier currently insures it and at what premium?
- What's the average days-on-market for RENTAL listings here right now (not sales)? A rising rental-DOM trend means longer vacancies and softer asking-rent achievability than the comps imply.
- What's the recent tenant-quality profile in this submarket — average credit score on applications, eviction rate, late-payment / NSF rate, and stable-employment percentage? A property-management company in the area should have these aggregated.
- How much new for-sale + rental construction is in the pipeline within 1–3 miles? Heavy new supply typically softens prices + rents 12–24 months out; constrained supply supports both.
Investment metrics
- 1% rule
- 1.40% ✓
- Cap rate
- 9.48%
- Cash-on-cash
- 11.37%
- DSCR
- 1.51
- GRM
- 6.0
CMA / ARV
- ARV (median comp)
- $132,167
- List price
- $99,950
- Delta
- -24.38%
- Verdict
- UNDERPRICED
- Comps
- 20 within 1.0 mi
Show comp detail 5 sales within ~0.75 mi
| Address | Dist | Beds/Ba | Sqft | Sold | Price | $/sf | Match |
|---|---|---|---|---|---|---|---|
| 545 Gardenia Ave | 0.08mi | 4/1.5 (+1) | 1,750 (+2%) | 9mo | $143,900 | $82 | 80 |
| 638 Camellia Ave | 0.17mi | 3/2.0 | 1,670 (-2%) | 9mo | $134,000 | $80 | 79 |
| 500 Gardenia Ave | 0.13mi | 4/1.0 (+1) | 1,790 (+5%) | 12mo | $99,995 | $56 | 69 |
| 313 Camellia Ave | 0.20mi | 3/2.0 | 1,490 (-13%) | 4mo | $149,900 | $101 | 64 |
| 101 Azalea Ave | 0.40mi | 3/2.0 | 1,519 (-11%) | 9mo | $115,000 | $76 | 53 |
Match score weights: distance 35% · size 25% · config 20% · recency 20%. Top-matched comps best support the ARV.
Projected returns pro-forma
1.01% appreciation · 5.71% rent growth · sell at horizon
- IRR
- 15.6%
- Equity multiple
- 1.82×
- Total profit
- $22,818
- Equity at exit
- $34,173
- IRR
- 21.0%
- Equity multiple
- 3.78×
- Total profit
- $77,837
- Equity at exit
- $45,453
Cash invested: $27,986 (down + closing). Projections, not guarantees.
Landlord ↔ Tenant lean methodology
- Overall (STATE)
- 87 Strongly Landlord-Friendly
- State Texas
- 87 Strongly Landlord-Friendly · R+5
- County
- — inherits STATE
- City
- — inherits STATE
ZIP-level market 77630
- Home prices YoY
- 0.4%
- Rents YoY
- 5.7%
- Active inventory
- 337
- Price-to-rent
- 6.0×
Monthly cashflow live
- Estimated rent
- $1,395 high interval (Pro) →
- Mortgage (P&I)
- −$524
- Tax from tax record
- −$271 /mo · $3,255/yr
- Insurance
- −$42
- HOA
- −$0
- Vacancy / Maint / Mgmt
- −$293
- Net cashflow
- $265
Break-even live
UW: 25.0% down · 7.5% · 30yr · 1.5% tax · 5.0% vac · 8.0% maint · 8.0% mgmt
Financing live
Cash to close
- Down payment
- $24,988
- Closing costs
- $2,998
- Reserves months
- —
- Total cash needed
- —
Loan-product check · same deal, 3 products live
Conventional
25% down · 7.5% · 30yr
- Down + closing
- —
- Monthly P&I
- —
- Monthly cashflow
- —
- DSCR
- —
- Eligible?
- —
Personal DTI + credit; lowest rate.
DSCR
20% down · 8.5% · 30yr
- Down + closing
- —
- Monthly P&I
- —
- Monthly cashflow
- —
- DSCR
- —
- Eligible?
- —
No personal income docs; deal must DSCR.
Hard money
10% down · 12.0% · 12mo
- Down + closing
- —
- Monthly P&I
- —
- Monthly cashflow
- —
- DSCR
- —
- Eligible?
- —
Short-term bridge; refi at stabilization.
Rent comps 22 comps
| Address | Beds | Baths | Sqft | Rent | $/sqft | DOM | Units | Dist |
|---|---|---|---|---|---|---|---|---|
| 107 Dahlia St Orange, TX | 3.0 | 1.0 | 1149 | $1,300 | $1.13 | 14d | 1 | 0.21mi |
| 403 Bluebonnet Dr Orange, TX | 3.0 | 1.0 | 1196 | $1,300 | $1.09 | 44d | 1 | 0.23mi |
| 306 Bridal Wreath Ave Orange, TX | 3.0 | 1.0 | 1529 | $1,195 | $0.78 | 21d | 1 | 0.26mi |
| 302 Bridal Wreath Ave Orange, TX | 3.0 | 1.0 | 1182 | $1,195 | $1.01 | 44d | 1 | 0.29mi |
| 3615 Ridgemont Dr Orange, TX | 3.0 | 1.0 | 1266 | $1,275 | $1.01 | 44d | 1 | 0.30mi |
| 101 Azalea Ave Unit A Orange, TX | 3.0 | 1.0 | 1200 | $2,000 | $1.67 | 44d | 1 | 0.38mi |
| 3333 Ridgemont Dr Unit 401 Orange, TX | 3.0 | 2.0 | 1700 | $1,725 | $1.01 | 21d | 1 | 0.39mi |
| 3333 Ridgemont Dr Unit 315TWNHME Orange, TX | 2.0 | 1.5 | 1216 | $1,040 | $0.86 | 21d | 1 | 0.39mi |
| 316 Old Timers Rd Unit 316 Orange, TX | 3.0 | 2.0 | 1200 | $1,595 | $1.33 | 44d | 1 | 0.56mi |
| 3000 MacArthur Dr Orange, TX | 3.0 | 1.0–2.0 | 791 | $1,330 | $1.68 | 13d | 12 | 0.61mi |
| 7b Concord St Orange, TX | 2.0 | 1.5 | 1206 | $1,450 | $1.20 | 14d | 1 | 0.61mi |
| 1120 28th St Orange, TX | 3.0 | 1.0 | 1308 | $1,500 | $1.15 | 44d | 1 | 0.76mi |
| 205 Gloria St West Orange, TX | 3.0 | 2.0 | 1225 | $1,300 | $1.06 | 44d | 1 | 0.95mi |
| 3345 W Park Ave Orange, TX | 1.0–2.0 | 1.0–1.5 | 999 | $1,182 | $1.18 | 13d | 7 | 0.95mi |
| 2602 Tanglewood St West Orange, TX | 4.0 | 2.0 | 1306 | $1,250 | $0.96 | 14d | 1 | 0.95mi |
| 309 Quincy St West Orange, TX | 3.0 | 1.5 | 1113 | $1,200 | $1.08 | 14d | 1 | 1.00mi |
| 210 Florence St Orange, TX | 3.0 | 1.0 | 1064 | $1,425 | $1.34 | 44d | 1 | 1.05mi |
| 206 Florence St Orange, TX | 2.0 | 1.0 | 1216 | $1,425 | $1.17 | 44d | 1 | 1.06mi |
| 1543 Alamo St West Orange, TX | 3.0 | 1.0 | 1170 | $1,200 | $1.03 | 14d | 1 | 1.16mi |
| 2801 W Sunset Dr Orange, TX | 1.0–3.0 | 1.0–2.0 | 1113 | $1,400 | $1.26 | 13d | 27 | 1.32mi |
| 1010 Highway 87 S Orange, TX | 1.0–3.0 | 1.0–2.0 | 880 | $1,425 | $1.62 | 14d | 13 | 1.35mi |
| 406 Dayton St West Orange, TX | 2.0 | 1.0 | 1350 | $1,200 | $0.89 | 44d | 1 | 1.49mi |
Listing history 25 events
-
2026-06-18days on market $99,950 Active 73 DOM
-
2026-06-17days on market $99,950 Active 72 DOM
-
2026-06-16days on market $99,950 Active 71 DOM
-
2026-06-15days on market $99,950 Active 70 DOM
-
2026-06-14days on market $99,950 Active 68 DOM
-
2026-06-13days on market $99,950 Active 67 DOM
-
2026-06-10days on market $99,950 Active 65 DOM
-
2026-06-09days on market $99,950 Active 64 DOM
-
2026-06-08days on market $99,950 Active 63 DOM
-
2026-06-07days on market $99,950 Active 62 DOM
-
2026-06-03days on market $99,950 Active 58 DOM
-
2026-06-02days on market $99,950 Active 57 DOM
-
2026-06-01days on market $99,950 Active 56 DOM
-
2026-05-31days on market $99,950 Active 55 DOM
-
2026-05-30days on market $99,950 Active 54 DOM
-
2026-04-06$99,950 Active 995-char remark
Show marketing remark (995 chars)
Investment Opportunity: Charming Single-Story Home This single-story home presents a remarkable investment opportunity for the right buyer. The property features three bedrooms, a spacious living room, and a cozy family room with a wood-burning fireplace, perfect for chilly winter evenings. In addition, a rear shed provides convenient storage options for your belongings. Although the home needs some TLC, it offers a unique chance for a creative homeowner to add their own personal touch or for an investor seeking their next income-producing property. The established community and convenient location make this residence both attractive and valuable, offering the possibility to transform it into a hidden gem or diamond in the rough. Unlock the potential of this property by scheduling a tour with your representative today. Explore the possibilities and envision how you can make this home your own or turn it into a successful investment. Virtual photos included for illustration only.
-
2026-02-10historical
-
2026-01-05$125,000 Active
-
2025-12-31historical
-
2025-10-02$130,000 Active
-
2023-01-10historical
-
2022-11-03$134,000 Active
-
2018-05-15soldstatus
-
2018-04-20$54,900
-
2008-04-01soldstatus
ⓘ Source: listings_history table (triggers on properties + properties_extension) + one-shot
backfill from property_details.listing_events for pre-trigger history.
Tax reassessment forecast TX · Resets to sale price
- Current annual tax
- $3,255 · $271/mo
- Projected year-2 tax
- $3,255 · $271/mo
- Expected delta
- $0/yr ($0/mo · 0.0%)
ⓘ Screening estimate from a state-policy table — verify with the county assessor before closing.
Climate risk First Street
- Flood 5/10 Major FEMA zone X (unshaded) · 23% chance over 30 yrs
- Wildfire 2/10 Low
- Heat 9/10 Extreme 7 d/yr ≥109°F today · 23 d/yr by 30 yrs out
- Wind 9/10 Extreme 99% chance of damaging wind over 30 yrs
- Air quality 2/10 Low 1 unhealthy d/yr today · 1 by 30 yrs out
Nearby sold comps map
Loading sold comps map…
Walkable amenities ~0.75 mi
Loading nearby amenities…
Taxation est. · year 1
- Rental income
- $16,741
- − Mortgage interest
- −$5,599
- − Property taxes
- −$3,255
- − Insurance
- −$500
- − Repairs & maintenance
- −$1,339
- − Management
- −$1,339
- − Depreciation
- −$2,908
- Taxable income
- $1,801
- Est. tax owed @ 24.0%
- −$432
- After-tax cash flow
- $2,749/yr
For passive investors: Depreciation is non-cash, so a rental often shows a tax loss while cash-flowing — sheltering income. Rental losses are passive: they offset passive income freely, and up to $25,000/yr can offset ordinary (W-2) income if you actively participate and your MAGI is under $100k (phasing out to $0 by $150k); unused losses carry forward. On sale, claimed depreciation is recaptured at up to 25%, and gains may owe capital-gains tax (a 1031 exchange can defer both). Figures are a year-1 estimate at your 24.0% rate — not tax advice; consult a CPA.
Schools (NCES district)
- District
- West Orange-Cove CISD
- NCES district ID
- 4845090
- Math proficiency
- 17% ▼ -7.00%
- Reading proficiency
- 21% ▼ -2.00%
- Median HH income
- $37,329
- Composite
- 15.86/100
- National rank
- #9260
- State rank
- #784 of 826 in TX
Livability — Orange
- Score
- 71/100
- State rank
- #286
- US rank
- #6456
Category grades
Schools grade is shown separately in the Schools card above.
Census & demographics
- Census place
- Orange, TX
- County
- Orange County · 87,112 people
- City population
- 22,976
- Metro
- Beaumont-Port Arthur, TX
- Population (ZIP)
- 28,983
- Household income
- $64,373
- Rent vs Own
- Severe rent burden
- 1018.0
Population outlook (Orange County) Hauer SSP2
- Today (2025)
- 88,065 people
- By 2030
- 89,591 · +1.7%
- By 2040
- 91,982 · +4.4%
- By 2050
- 93,023 · +5.6%
- By 2075
- 94,871 · +7.7%
- By 2100
- 88,155 · +0.1%
Race, ethnicity, and origin ACS 2023
- Neighborhood character
- Majority White (64%)
- Race & ethnicity
- White 64% Black 21% Hispanic / Latino 11% Two or more races 9%
- Hispanic origin (detail)
- Mexican 7%
- Common ancestry
- Lithuanian 13% Italian 1% Slovak 1%
- Foreign-born
- 5% · Canada
- Languages at home
- 91% English-only · Spanish 7% French/Haitian/Cajun 1% Other Asian/Pacific 1%
Political lean MEDSL · Orange
- 2024 margin
- Solid R (+66.8) · D 16.4% · R 83.1%
- 2008→2024 swing
- -19.6pp toward R · 2008: -47.1pp · 2024: -66.8pp
- All cycles
- 2024: R+66.8 2020: R+63.4 2016: R+61.9 2012: R+54.3 2008: R+47.1
Not yet ingested
- Civics
- —
Market trends
- HPI YoY
- ▲ 1.01%
- Current HPI
- 264.14
- Rent YoY
- ▲ 5.71%
- Metro
- Beaumont-Port Arthur, TX
- State GDP YoY
- ▲ 3.95%
- F500 in state
- 110
Industry mix (Fortune 500 HQ in TX)
| Industry | F500 HQs | Revenue |
|---|---|---|
| Energy | 16 | $1,198B |
|
||
| Technology | 5 | $198B |
|
||
| Engineering / Construction | 4 | $72B |
|
||
| Energy Services | 3 | $60B |
|
||
| Utilities | 3 | $41B |
|
||
| Healthcare | 2 | $330B |
|
||
Price history
+82.1% since first listed10 events — show timeline
- 2026-04-06 Listed $99,950 HARMLS
- 2026-02-10 Listing Removed — HARMLS
- 2026-01-05 Listed $125,000 HARMLS
- 2025-12-31 Listing Removed — HARMLS
- 2025-10-02 Listed $130,000 HARMLS
- 2023-01-10 Listing Removed — HARMLS
- 2022-11-03 Listed $134,000 HARMLS
- 2018-05-15 Sold (MLS) — BBOR
- 2018-04-20 Listed $54,900 BBOR
- 2008-04-01 Sold (Public Records) — Public Records
Property tax history
+2.6%/yrLatest (2025): $3,255 · -3.5% YoY. Source: county tax records.
Cash-flow waterfall
monthlySold comps — $/sqft
last 12 mo · ≤1 miLoading sold comps…