1516 Commercial Pl · Crystal Springs, FL
Flood risk 1/10 · Minimal
- FEMA flood zone
- X (unshaded)
- Chance of flooding over 30 yrs
- 0.0%
- Est. flood insurance / yr
- $507 – $1,088
Fire risk 4/10 · Minor
- Est. fire insurance / yr
- $947 – $1,759
Heat risk 9/10 · Severe
- Hot days now (above 108°F)
- 7 days/yr
- Hot days in 30 yrs
- 23 days/yr
Wind risk 9/10 · Severe
- Chance of severe wind over 30 yrs
- 99.0%
Air-quality risk 2/10 · Minimal
- Unhealthy air days now
- 1 days/yr
- Unhealthy air days in 30 yrs
- 2 days/yr
Risk factors via First Street. Map © Google.
Why this score? — see what drove the B- grade
The composite is a weighted blend of 9 inputs, each scored 0–100. Each bar is that input's sub-score; the figure is the points it added to the 100-point composite (weight × sub-score).
- Cash flow +30.0/30.0
- DSCR +10.0/10.0
- 1% rule +8.6/10.0
- ARV discount +7.4/15.0
- Schools +4.3/10.0
- Livability +3.2/5.0
- Rent growth +2.5/5.0
- Condition / age +2.5/5.0
- Appreciation +0.0/10.0
$115,000
🖨 Deal sheet 📄 Offer letter ✓ Due diligence
Listing remarks
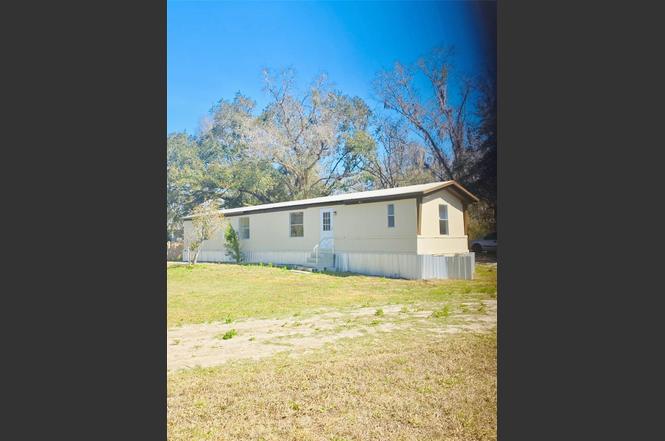
Under contract-accepting backup offers. Newly Remodeled 2 Bedroom, 2 Bathroom Mobile Home on Spacious Corner Lot Move-in ready and beautifully updated! This newly remodeled 2-bedroom, 2-bath mobile home sits on a generous . 41-acre corner lot, offering plenty of space and privacy. The home features fresh interior and exterior paint, creating a clean, modern look throughout. Both bathrooms have been completely updated, and durable vinyl flooring runs throughout the home for easy maintenance and a seamless finish. Enjoy a light, bright interior with neutral colors that complement any décor style. Whether you're a first-time buyer, downsizing, or looking for an affordable investment
Key facts
- Spacious corner lot
- Updated bathrooms
- 0.41 acre lot
Tags
Property features AI
Finance
- Other: Zoning: AR; Total lot size about 0.41 acres (approx. 132 x 136); Living area reported as 696 square feet
- HOA & community: No association; Pets allowed
Exterior
- Parking: No designated parking
- Utilities: Private water source; Septic tank; Cable available; Water available
- Home design: Manufactured single-wide home; One story; Faces west
- Construction: Metal frame construction; Metal siding; Metal roof; Crawlspace foundation; Has additional parcel(s)
- Exterior features: Corner lot; Located in county; Road surfaces include dirt, other, and paved
Interior
- Kitchen: Range; Refrigerator
- Bedrooms: 2 bedrooms
- Flooring: Vinyl
- Bathrooms: 2 full bathrooms
- Heating & cooling: Heating: Other; Cooling: Mini-split unit(s)
- Interior features: Kitchen and family room combined; Open floorplan; Split bedroom layout; 3 total rooms
- Laundry & utility: Indoor laundry
Neighborhood map
What this means for you Summary
Snapshot
- This is a 2-bed/2.0-bath manufactured listed at $115k.
Deal economics
- At list price, monthly cash flow is $527 ($6k/yr) — positive.
- The deal already cash-flows at list — no discount required.
- Meets the 1% rule at list price ($2k rent vs $115k).
- Recommended offer: $112k (3.0% below list) — sets the bar for market timing.
- Cap rate 11.8% vs local median 3.8% in Crystal Springs — top-decile yield for the area; either an underpriced asset or a hidden risk that comps aren't pricing in. Stress-test before assuming the spread holds.
Location & tenants
- Location reads 64/100 on livability (#687 in FL) — a middle-class / working-renter tenant base. Strengths: cost of living A+, housing A+; Watch: crime C-, amenities F, commute F.
- Pasco (suburban): math 50% / reading 52% proficiency, ranked #32 of 73 in FL (top 44%) — acceptable for families but not a draw, mixed tenant base, ~2y average lease.
- Zoned schools: Zephyrhills High School (math 35% / reading 37%, grade F, #359 of 667 statewide, top 55%, 1,656 students, 70% FRL) — zoned schools average 70% FRL vs 48% district-wide (21 pts higher); higher-poverty schools than district average — tighter screening recommended.
- Zoned-school proficiency averages 36% at this address vs 51% district-wide (-15 pts) — the specific schools serving this property underperform the Pasco average; the district grade overstates school quality for this exact location.
- Market conditions: 235 active listings in the ZIP; 6,765 units permitted in Pasco County in 2024 (1,250 in 5+ unit buildings).
Forward outlook
- Local home prices are declining (-3.0%/yr); year-one equity from $795 of loan paydown is wiped out by about $3k of value loss. Plan a longer hold.
- Pasco County population projected at +29% by 2050 — long-run rental-demand tailwind backs the buy-and-hold thesis.
- At projected returns (-3.0% appreciation + 3.0% rent growth), your $32k cash investment doubles in ~7 years — after that, you're playing with house money.
Negotiation context
- It's been on market 55 days — a 3% lower offer ($112k) is reasonable based on typical stale-listing flexibility.
- 3 sale attempts since 19y ago; this cycle's ask has dropped $35k (23%) from the opening price — seller is motivated, your offer sets the floor, not the list.
- Current owner paid $45k; list at $115k implies a 156% gain — meaningful room to come down on a strong offer.
Risks & watch-outs
- Climate carrying-cost: severe wind risk, 99% chance of damaging wind over 30y; extreme-heat days projected 7→23/yr by 2055 (HVAC capex compounding) — expect insurance premiums to compound above CPI over the hold.
Questions for the listing agent
- It's been on market 55 days. Have you received any prior offers? Is the seller open to a 3% concession, seller financing, or rate buy-down credit?
- Is there a deadline driving the sale (1031 exchange, divorce, estate, relocation)? That informs how much negotiation room exists.
- Schools are F-rated, which usually means shorter tenancies and higher turnover. Who's the typical renter profile here, and what's been the actual vacancy rate?
- What's the average days-on-market for RENTAL listings here right now (not sales)? A rising rental-DOM trend means longer vacancies and softer asking-rent achievability than the comps imply.
- What's the recent tenant-quality profile in this submarket — average credit score on applications, eviction rate, late-payment / NSF rate, and stable-employment percentage? A property-management company in the area should have these aggregated.
- How much new for-sale + rental construction is in the pipeline within 1–3 miles? Heavy new supply typically softens prices + rents 12–24 months out; constrained supply supports both.
Investment metrics
- 1% rule
- 1.36% ✓
- Cap rate
- 11.79%
- Cash-on-cash
- 19.65%
- DSCR
- 1.87
- GRM
- 6.1
CMA / ARV
- ARV (on-the-fly)
- $114,840
- Comps found
- 1
Show comp detail 1 sale within ~0.75 mi
| Address | Dist | Beds/Ba | Sqft | Sold | Price | $/sf | Match |
|---|---|---|---|---|---|---|---|
| 1516 Commercial Pl | 0.00mi | 2/2.0 | 696 (0%) | 1mo | $115,000 | $165 | 99 |
Match score weights: distance 35% · size 25% · config 20% · recency 20%. Top-matched comps best support the ARV.
Projected returns pro-forma
-3.0% appreciation · 3.0% rent growth · sell at horizon
- IRR
- 11.7%
- Equity multiple
- 1.46×
- Total profit
- $14,915
- Equity at exit
- $17,147
- IRR
- 20.6%
- Equity multiple
- 2.74×
- Total profit
- $56,099
- Equity at exit
- $9,943
Cash invested: $32,200 (down + closing). Projections, not guarantees.
Landlord ↔ Tenant lean methodology
- Overall (STATE)
- 87 Strongly Landlord-Friendly
- State Florida
- 87 Strongly Landlord-Friendly · R+3
- County
- — inherits STATE
- City
- — inherits STATE
ZIP-level market 33540
- Home prices YoY
- -3.0%
- Active inventory
- 235
- Price-to-rent
- 6.1×
Monthly cashflow live
- Estimated rent
- $1,558 medium interval (Pro) →
- Mortgage (P&I)
- −$603
- Tax from tax record
- −$53 /mo · $635/yr
- Insurance
- −$48
- HOA
- −$0
- Vacancy / Maint / Mgmt
- −$327
- Net cashflow
- $527
Break-even live
UW: 25.0% down · 7.5% · 30yr · 1.5% tax · 5.0% vac · 8.0% maint · 8.0% mgmt
Financing live
Cash to close
- Down payment
- $28,750
- Closing costs
- $3,450
- Reserves months
- —
- Total cash needed
- —
Loan-product check · same deal, 3 products live
Conventional
25% down · 7.5% · 30yr
- Down + closing
- —
- Monthly P&I
- —
- Monthly cashflow
- —
- DSCR
- —
- Eligible?
- —
Personal DTI + credit; lowest rate.
DSCR
20% down · 8.5% · 30yr
- Down + closing
- —
- Monthly P&I
- —
- Monthly cashflow
- —
- DSCR
- —
- Eligible?
- —
No personal income docs; deal must DSCR.
Hard money
10% down · 12.0% · 12mo
- Down + closing
- —
- Monthly P&I
- —
- Monthly cashflow
- —
- DSCR
- —
- Eligible?
- —
Short-term bridge; refi at stabilization.
Listing history 12 events
-
2026-05-04status Pending
-
2026-05-01price $115,000
-
2026-04-23price $130,000
-
2026-04-15price $137,000
-
2026-04-13status Active
-
2026-04-13price $145,000
-
2026-04-06status Pending
-
2026-03-03$150,000 Active
-
2017-07-13soldstatus $45,000
-
2008-12-03soldstatus $65,100
-
2007-11-05$129,500
-
2005-04-15soldstatus $65,000
ⓘ Source: listings_history table (triggers on properties + properties_extension) + one-shot
backfill from property_details.listing_events for pre-trigger history.
Tax reassessment forecast FL · Resets to sale price
- Current annual tax
- $635 · $53/mo
- Projected year-2 tax
- $954 · $80/mo
- Expected delta
- +$320/yr (+$27/mo · 50.4%)
ⓘ Screening estimate from a state-policy table — verify with the county assessor before closing.
Climate risk First Street
- Flood 1/10 Low FEMA zone X (unshaded) · 0% chance over 30 yrs
- Wildfire 4/10 Moderate
- Heat 9/10 Extreme 7 d/yr ≥108°F today · 23 d/yr by 30 yrs out
- Wind 9/10 Extreme 99% chance of damaging wind over 30 yrs
- Air quality 2/10 Low 1 unhealthy d/yr today · 2 by 30 yrs out
Nearby sold comps map
Loading sold comps map…
Walkable amenities ~0.75 mi
Loading nearby amenities…
Taxation est. · year 1
- Rental income
- $18,701
- − Mortgage interest
- −$6,442
- − Property taxes
- −$635
- − Insurance
- −$575
- − Repairs & maintenance
- −$1,496
- − Management
- −$1,496
- − Depreciation
- −$3,345
- Taxable income
- $4,712
- Est. tax owed @ 24.0%
- −$1,131
- After-tax cash flow
- $5,196/yr
For passive investors: Depreciation is non-cash, so a rental often shows a tax loss while cash-flowing — sheltering income. Rental losses are passive: they offset passive income freely, and up to $25,000/yr can offset ordinary (W-2) income if you actively participate and your MAGI is under $100k (phasing out to $0 by $150k); unused losses carry forward. On sale, claimed depreciation is recaptured at up to 25%, and gains may owe capital-gains tax (a 1031 exchange can defer both). Figures are a year-1 estimate at your 24.0% rate — not tax advice; consult a CPA.
Schools (NCES district)
- District
- Pasco
- NCES district ID
- 1201530
- Math proficiency
- 50% ▼ -10.00%
- Reading proficiency
- 52% ▼ -5.00%
- Median HH income
- $45,039
- Composite
- 43.14/100
- National rank
- #3074
- State rank
- #32 of 73 in FL
Livability — Crystal Springs
- Score
- 64/100
- State rank
- #687
- US rank
- #14320
Category grades
Schools grade is shown separately in the Schools card above.
Census & demographics
- Census place
- Crystal Springs, FL
- Population (ZIP)
- 11,098
Population outlook (Pasco County) Hauer SSP2
- Today (2025)
- 570,045 people
- By 2030
- 605,844 · +6.3%
- By 2040
- 674,806 · +18.4%
- By 2050
- 736,022 · +29.1%
- By 2075
- 862,900 · +51.4%
- By 2100
- 906,364 · +59.0%
Race, ethnicity, and origin ACS 2023
- Neighborhood character
- Predominantly White (77%)
- Race & ethnicity
- White 77% Hispanic / Latino 14% Two or more races 10% Black 3% Asian 1%
- Hispanic origin (detail)
- Mexican 2% Puerto Rican 8% Cuban 2%
- Common ancestry
- Lithuanian 4% Romanian 3% Italian 2%
- Foreign-born
- 11% · Canada, Vietnam
- Languages at home
- 87% English-only · Spanish 9% French/Haitian/Cajun 2% Other Indo-European 1%
Political lean MEDSL · Pasco
- 2024 margin
- Strong R (+25.2) · D 36.9% · R 62.1% · Other 1.0%
- 2008→2024 swing
- -21.6pp toward R · 2008: -3.6pp · 2024: -25.2pp
- All cycles
- 2024: R+25.2 2020: R+20.1 2016: R+21.6 2012: R+6.7 2008: R+3.6
Not yet ingested
- Civics
- —
Market trends
- HPI YoY
- ▼ -11.57%
- Current HPI
- 370.8747
- Rent YoY
- —
- Metro
- —
- State GDP YoY
- ▲ 3.28%
- F500 in state
- 36
Industry mix (Fortune 500 HQ in FL)
| Industry | F500 HQs | Revenue |
|---|---|---|
| Industrial Technology | 2 | $29B |
|
||
| Insurance | 2 | $17B |
|
||
| Retail | 1 | $60B |
|
||
| Technology Distribution | 1 | $58B |
|
||
| Homebuilding | 1 | $35B |
|
||
| Technology Manufacturing | 1 | $35B |
|
||
Price history
+76.9% since first listed12 events — show timeline
- 2026-05-04 Pending — Stellar MLS as Distributed by MLS Grid
- 2026-05-01 Price Changed $115,000 Stellar MLS as Distributed by MLS Grid
- 2026-04-23 Price Changed $130,000 Stellar MLS as Distributed by MLS Grid
- 2026-04-15 Price Changed $137,000 Stellar MLS as Distributed by MLS Grid
- 2026-04-13 Relisted — Stellar MLS as Distributed by MLS Grid
- 2026-04-13 Price Changed $145,000 Stellar MLS as Distributed by MLS Grid
- 2026-04-06 Pending — Stellar MLS as Distributed by MLS Grid
- 2026-03-03 Listed $150,000 Stellar MLS as Distributed by MLS Grid
- 2017-07-13 Sold (Public Records) $45,000 Public Records
- 2008-12-03 Sold (Public Records) $65,100 Public Records
- 2007-11-05 Listed $129,500 Stellar MLS as Distributed by MLS Grid
- 2005-04-15 Sold (Public Records) $65,000 Public Records
Property tax history
+5.3%/yrLatest (2025): $635 · +4.0% YoY. Source: county tax records.
Cash-flow waterfall
monthlySold comps — $/sqft
last 12 mo · ≤1 miLoading sold comps…