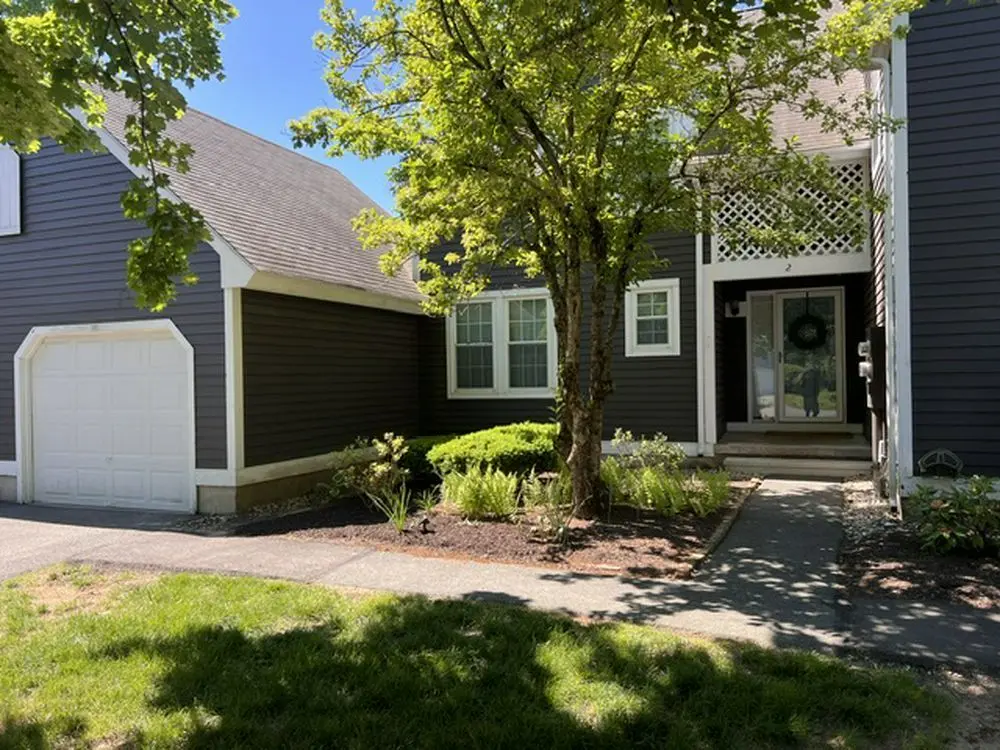
2 Fairmount Ln · Granby, CT
Flood risk No data
- FEMA flood zone
- —
- Chance of flooding over 30 yrs
- —
- Est. flood insurance / yr
- —
Fire risk No data
- Est. fire insurance / yr
- —
Heat risk No data
- Hot days now (above threshold)
- —
- Hot days in 30 yrs
- —
Wind risk No data
- Chance of severe wind over 30 yrs
- —
Air-quality risk No data
- Unhealthy air days now
- —
- Unhealthy air days in 30 yrs
- —
Risk factors via First Street. Map © Google.
Why this score? — see what drove the D- grade
The composite is a weighted blend of 9 inputs, each scored 0–100. Each bar is that input's sub-score; the figure is the points it added to the 100-point composite (weight × sub-score).
- Cash flow +9.0/30.0
- ARV discount +7.5/15.0
- 1% rule +5.1/10.0
- Schools +5.1/10.0
- DSCR +2.5/10.0
- Rent growth +2.5/5.0
- Livability +2.5/5.0
- Condition / age +2.5/5.0
- Appreciation +0.0/10.0
$279,900
🖨 Deal sheet 📄 Offer letter ✓ Due diligence
Listing remarks
Wow is what you will say the minute you step into this sun-filled, meticulously maintained end-unit townhouse in sought-after Chatsworth Village! Offering the perfect blend of modern convenience and carefree comfort, this beautiful home welcomes you with streaming natural light, gleaming hardwood floors, and a fresh neutral color palette throughout. The heart of the home features a beautifully updated eat-in kitchen, complete with sleek quartz countertops, a classic subway tile backsplash and stainless-steel appliances perfect for testing out your culinary skills or hosting casual gatherings. New water heater installed in 2023. Unwind in the spacious, inviting living room, where a cozy fi
Key facts
- Private deck
- Convenient garage
- Full basement
Tags
Neighborhood map
What this means for you Summary
Snapshot
- This is a 2-bed/1.5-bath condo listed at $280k.
Deal economics
- At list price, monthly cash flow is $-219 ($-3k/yr) — negative.
- The deal already cash-flows at list — no discount required.
- Meets the 1% rule at list price ($3k rent vs $280k).
Location & tenants
- Location reads: area grade D — affects rentability + tenant quality, not the cash-flow math above.
- Granby School District (suburban): math 45% / reading 64% proficiency, ranked #57 of 153 in CT (top 37%) — acceptable for families but not a draw, mixed tenant base, ~2y average lease; only 7% free/reduced lunch — higher-income household profile.
- Market conditions: 41 active listings in the ZIP; 2 comparable units currently listed for rent nearby; 1,867 units permitted in Capitol Planning Region in 2024 (1,399 in 5+ unit buildings).
Forward outlook
- Local home prices are declining (-3.0%/yr); year-one equity from $2k of loan paydown is wiped out by about $8k of value loss. Plan a longer hold.
Negotiation context
- Only 14 days on market — expect competitive offers; lowballing is unlikely to land.
- Current owner paid $230k; 22% above their basis — modest negotiation headroom, anchor on the comps not their cost.
Questions for the listing agent
- What do current leases actually rent for vs. the listed asking? Can we see a recent rent roll and the last 12 months of T-12 income?
- What does the HOA fee cover, when was the last increase, and are there any pending special assessments or reserve-fund shortfalls?
- Any open or pending special assessments — roof, HVAC, plumbing, elevator, façade? What's the per-unit balance and payoff schedule, and is the seller paying it off at close or rolling it to the buyer?
- Is there a deadline driving the sale (1031 exchange, divorce, estate, relocation)? That informs how much negotiation room exists.
- The area grade is low — what's the realistic commute time and amenity access for the typical tenant pool here? Any planned neighborhood developments (good or bad) we should know about?
- What's the average days-on-market for RENTAL listings here right now (not sales)? A rising rental-DOM trend means longer vacancies and softer asking-rent achievability than the comps imply.
- What's the recent tenant-quality profile in this submarket — average credit score on applications, eviction rate, late-payment / NSF rate, and stable-employment percentage? A property-management company in the area should have these aggregated.
- How much new apartment / multifamily construction is in the pipeline within 1–3 miles? Heavy new supply (>2% of stock underway) typically softens rents 12–24 months out; light construction supports rent growth.
Investment metrics
- 1% rule
- 1.01% ✓
- Cap rate
- 5.35%
- Cash-on-cash
- -3.36%
- DSCR
- 0.85
- GRM
- 8.2
CMA / ARV
No comps found within radius.
Projected returns pro-forma
-3.0% appreciation · 3.0% rent growth · sell at horizon
- IRR
- -21.7%
- Equity multiple
- 0.25×
- Total profit
- $-58,964
- Equity at exit
- $41,734
- IRR
- -15.1%
- Equity multiple
- 0.13×
- Total profit
- $-67,853
- Equity at exit
- $24,201
Cash invested: $78,372 (down + closing). Projections, not guarantees.
Landlord ↔ Tenant lean methodology
- Overall (STATE)
- 27 Tenant-Leaning
- State Connecticut
- 27 Tenant-Leaning · D+7
- County
- — inherits STATE
- City
- — inherits STATE
ZIP-level market 06035
- Home prices YoY
- -28.1%
- Active inventory
- 41
- Price-to-rent
- 8.2×
Monthly cashflow live
- Estimated rent
- $2,835 medium interval (Pro) →
- Mortgage (P&I)
- −$1,468
- Tax from tax record
- −$376 /mo · $4,509/yr
- Insurance
- −$117
- HOA est. from 2 same-building comps
- −$499
- Vacancy / Maint / Mgmt
- −$595
- Net cashflow
- $-219
Break-even live
UW: 25.0% down · 7.5% · 30yr · 1.5% tax · 5.0% vac · 8.0% maint · 8.0% mgmt
Financing live
Cash to close
- Down payment
- $69,975
- Closing costs
- $8,397
- Reserves months
- —
- Total cash needed
- —
Loan-product check · same deal, 3 products live
Conventional
25% down · 7.5% · 30yr
- Down + closing
- —
- Monthly P&I
- —
- Monthly cashflow
- —
- DSCR
- —
- Eligible?
- —
Personal DTI + credit; lowest rate.
DSCR
20% down · 8.5% · 30yr
- Down + closing
- —
- Monthly P&I
- —
- Monthly cashflow
- —
- DSCR
- —
- Eligible?
- —
No personal income docs; deal must DSCR.
Hard money
10% down · 12.0% · 12mo
- Down + closing
- —
- Monthly P&I
- —
- Monthly cashflow
- —
- DSCR
- —
- Eligible?
- —
Short-term bridge; refi at stabilization.
Rent comps 2 comps
| Address | Beds | Baths | Sqft | Rent | $/sqft | DOM | Units | Dist |
|---|---|---|---|---|---|---|---|---|
| 3 Murthas Way Granby, CT | 1.0–3.0 | 1.0–2.5 | 1251 | $2,902 | $2.32 | 1d | 15 | 0.58mi |
| 280 Salmon Brook St Granby, CT | 1.0–3.0 | 1.0–2.0 | 1318 | $2,688 | $2.04 | 1d | 19 | 1.21mi |
HOA detail condo
- Monthly dues
- $0 · $0/yr
- Likely covers
- water
- Assessments
- None detected in remarks — confirm with the listing agent.
Listing history 10 events
-
2026-06-18days on market $279,900 Active 14 DOM
-
2026-06-17days on market $279,900 Active 13 DOM
-
2026-06-16days on market $279,900 Active 12 DOM
-
2026-06-15days on market $279,900 Active 11 DOM
-
2026-06-13days on market $279,900 Active 9 DOM
-
2026-06-10days on market $279,900 Active 6 DOM
-
2026-06-09days on market $279,900 Active 5 DOM
-
2026-06-08days on market $279,900 Active 4 DOM
-
2026-06-07remarks 699-char remark
-
2026-06-07$279,900 Active 3 DOM
ⓘ Source: listings_history table (triggers on properties + properties_extension) + one-shot
backfill from property_details.listing_events for pre-trigger history.
Tax reassessment forecast CT · Partial reset (capped growth)
- Current annual tax
- $4,509 · $376/mo
- Projected year-2 tax
- $5,249 · $437/mo
- Expected delta
- +$740/yr (+$62/mo · 16.4%)
ⓘ Screening estimate from a state-policy table — verify with the county assessor before closing.
Nearby sold comps map
Loading sold comps map…
Walkable amenities ~0.75 mi
Loading nearby amenities…
Taxation est. · year 1
- Rental income
- $34,022
- − Mortgage interest
- −$15,679
- − Property taxes
- −$4,509
- − Insurance
- −$1,400
- − Repairs & maintenance
- −$2,722
- − Management
- −$2,722
- − HOA
- −$5,988
- − Depreciation
- −$8,143
- Taxable loss
- −$7,139
- Est. tax savings @ 24.0%
- +$1,713
- After-tax cash flow
- $-919/yr
For passive investors: Depreciation is non-cash, so a rental often shows a tax loss while cash-flowing — sheltering income. Rental losses are passive: they offset passive income freely, and up to $25,000/yr can offset ordinary (W-2) income if you actively participate and your MAGI is under $100k (phasing out to $0 by $150k); unused losses carry forward. On sale, claimed depreciation is recaptured at up to 25%, and gains may owe capital-gains tax (a 1031 exchange can defer both). Figures are a year-1 estimate at your 24.0% rate — not tax advice; consult a CPA.
Schools (NCES district)
- District
- Granby School District
- NCES district ID
- 0901680
- Math proficiency
- 45% ▼ -18.00%
- Reading proficiency
- 64% ▼ -13.00%
- Median HH income
- $100,173
- Composite
- 51.24/100
- National rank
- #1751
- State rank
- #57 of 153 in CT
Livability — Granby
No livability data for this city. (Only ~50 U.S. cities are tracked.)
Census & demographics
- Population (ZIP)
- 7,939
Population outlook (Capitol County) Hauer SSP2
- By 2040
- 1,063,519
Race, ethnicity, and origin ACS 2023
- Neighborhood character
- Predominantly White (91%)
- Race & ethnicity
- White 91% Two or more races 6% Hispanic / Latino 3% Asian 2%
- Common ancestry
- Romanian 10% Lithuanian 9% Slovak 2%
- Foreign-born
- 6% · Canada, Vietnam, China
- Languages at home
- 90% English-only · Other Indo-European 4% Spanish 2% Russian/Polish/Slavic 2%
Political lean MEDSL · Capitol
- 2024 margin
- Strong D (+21.9) · D 60.1% · R 38.2% · Other 1.7%
- All cycles
- 2024: D+21.9
Not yet ingested
- Civics
- —
Market trends
- HPI YoY
- ▼ -95.64%
- Current HPI
- 244.0696
- Rent YoY
- —
- Metro
- —
- State GDP YoY
- ▲ 1.06%
- F500 in state
- 38
Industry mix (Fortune 500 HQ in CT)
| Industry | F500 HQs | Revenue |
|---|---|---|
| Industrial Machinery | 4 | $38B |
|
||
| Insurance | 3 | $71B |
|
||
| Financial Services | 2 | $25B |
|
||
| Transportation / Logistics | 2 | $18B |
|
||
| Healthcare | 1 | $247B |
|
||
| Telecommunications | 1 | $55B |
|
||
Price history
+51.3% since first listed5 events — show timeline
- 2026-06-04 Listed $279,900 ForSaleByOwner.com
- 2022-12-20 Sold (Public Records) $230,000 Public Records
- 2021-10-20 Sold (Public Records) $193,000 Public Records
- 2009-11-02 Sold (Public Records) $149,900 Public Records
- 2007-06-11 Sold (Public Records) $185,000 Public Records
Property tax history
+1.6%/yrLatest (2025): $4,509 · +3.3% YoY. Source: county tax records.
Cash-flow waterfall
monthlySold comps — $/sqft
last 12 mo · ≤1 miLoading sold comps…