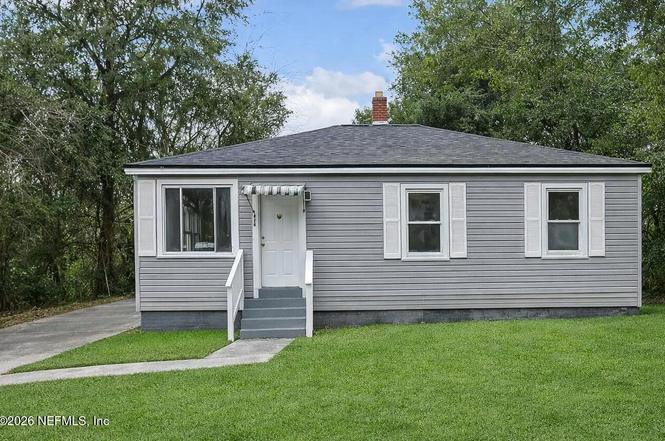
628 E 59th St · Jacksonville, FL
Flood risk 5/10 · Moderate
- FEMA flood zone
- X (unshaded)
- Chance of flooding over 30 yrs
- 0.23%
- Est. flood insurance / yr
- $507 – $1,088
Fire risk 2/10 · Minimal
- Est. fire insurance / yr
- $947 – $1,759
Heat risk 9/10 · Severe
- Hot days now (above 107°F)
- 7 days/yr
- Hot days in 30 yrs
- 20 days/yr
Wind risk 9/10 · Severe
- Chance of severe wind over 30 yrs
- 99.0%
Air-quality risk 4/10 · Minor
- Unhealthy air days now
- 6 days/yr
- Unhealthy air days in 30 yrs
- 6 days/yr
Risk factors via First Street. Map © Google.
Why this score? — see what drove the B+ grade
The composite is a weighted blend of 9 inputs, each scored 0–100. Each bar is that input's sub-score; the figure is the points it added to the 100-point composite (weight × sub-score).
- Cash flow +30.0/30.0
- ARV discount +15.0/15.0
- DSCR +10.0/10.0
- 1% rule +9.7/10.0
- Livability +4.2/5.0
- Schools +3.9/10.0
- Condition / age +2.5/5.0
- Rent growth +2.2/5.0
- Appreciation +0.0/10.0
$97,000
🖨 Deal sheet 📄 Offer letter ✓ Due diligence
Listing remarks MLS
If TLC stood for This house had Limited Care then you found a TLC. NICE INVESTMENT PROPERTY across the street FROM PARKS AND TOWN.
Key facts
- Manageable yard
- Local amenities
- Detached shed
Tags
Property features AI
Exterior
- Parking: Off-street parking; On-street parking
- Utilities: Public sewer; Electricity connected; Sewer connected; Water connected
- Home design: Single family residence; One level; Entry level: 1
- Construction: Frame construction with vinyl siding; Shingle roof
- Exterior features: Chain link fence; Shed(s); City street frontage; Asphalt road
Interior
- Kitchen: Electric range; Refrigerator
- Bedrooms: 3 bedrooms
- Flooring: Carpet; Tile; Vinyl
- Bathrooms: 1 full bathroom
- Heating & cooling: Central heating (electric); Central air (electric)
- Interior features: Eat-in kitchen; Primary bathroom with tub and shower
- Laundry & utility: In-unit washer hookup; In-unit electric dryer hookup
Neighborhood map
What this means for you Summary
Snapshot
- This is a 3-bed/1.0-bath single-family listed at $97k.
Deal economics
- At list price, monthly cash flow is $410 ($5k/yr) — positive.
- The deal already cash-flows at list — no discount required.
- Meets the 1% rule at list price ($1k rent vs $97k).
- Recommended offer: $85k (12.0% below list) — sets the bar for market timing.
- Cap rate 11.4% vs local median 4.0% in Jacksonville — top-decile yield for the area; either an underpriced asset or a hidden risk that comps aren't pricing in. Stress-test before assuming the spread holds.
Location & tenants
- Location reads 83/100 on livability (#50 in FL, #911 nationally) — a professional / high-income tenant draw. Strengths: amenities A+, commute A+, housing A+.
- Duval (urban): math 46% / reading 45% proficiency, ranked #48 of 73 in FL (top 66%) — families likely to look elsewhere, expect single-tenant / working-renter base with shorter leases.
- Market conditions: Rents soft (-1.4%/yr); 291 active listings in the ZIP; 40 comparable units currently listed for rent nearby; rentals at typical pace (median 15d on market — plan ~3-4 weeks tenant-placement turnaround); lower-income renter base — watch delinquency; 6,503 units permitted in Duval County in 2024 (1,131 in 5+ unit buildings).
- This rent runs 42% of the median local income ($41k/yr) — at the standard rent-burdened threshold; future hikes will face affordability resistance.
Forward outlook
- Local home prices are declining (-3.0%/yr); year-one equity from $671 of loan paydown is wiped out by about $3k of value loss. Plan a longer hold.
- Duval County population projected at +19% by 2050 — long-run rental-demand tailwind backs the buy-and-hold thesis.
- At projected returns (-3.0% appreciation + 0.0% rent growth), your $27k cash investment doubles in ~10 years — after that, you're playing with house money.
Negotiation context
- It's been on market 212 days — a 12% lower offer ($85k) is reasonable based on typical stale-listing flexibility.
- 11 sale attempts since 22y ago; this cycle's ask has dropped $12k (11%) from the opening price — seller is motivated, your offer sets the floor, not the list.
Risks & watch-outs
- Watch-outs: built in 1943 — expect roof / HVAC / electrical / plumbing capex.
- Climate carrying-cost: moderate flood risk; severe wind risk, 99% chance of damaging wind over 30y; extreme-heat days projected 7→20/yr by 2055 (HVAC capex compounding) — expect insurance premiums to compound above CPI over the hold.
Questions for the listing agent
- It's been on market 212 days. Have you received any prior offers? Is the seller open to a 12% concession, seller financing, or rate buy-down credit?
- Built in 1943 — when were the roof, HVAC, electrical panel, plumbing, and water heater last replaced?
- Why hasn't it sold? Are there any deal-killer items the seller is aware of (foundation, flood, title, zoning, code violations)?
- Is there a deadline driving the sale (1031 exchange, divorce, estate, relocation)? That informs how much negotiation room exists.
- Schools are B-rated — typically a magnet for longer-tenancy family renters. What's the average tenant stay here, and is there a school-zone premium baked into asking?
- What's the average days-on-market for RENTAL listings here right now (not sales)? A rising rental-DOM trend means longer vacancies and softer asking-rent achievability than the comps imply.
- What's the recent tenant-quality profile in this submarket — average credit score on applications, eviction rate, late-payment / NSF rate, and stable-employment percentage? A property-management company in the area should have these aggregated.
- How much new for-sale + rental construction is in the pipeline within 1–3 miles? Heavy new supply typically softens prices + rents 12–24 months out; constrained supply supports both.
Investment metrics
- 1% rule
- 1.47% ✓
- Cap rate
- 11.36%
- Cash-on-cash
- 18.10%
- DSCR
- 1.81
- GRM
- 5.7
CMA / ARV
- ARV (on-the-fly)
- $154,051
- Comps found
- 12
Show comp detail 12 sales within ~0.75 mi
| Address | Dist | Beds/Ba | Sqft | Sold | Price | $/sf | Match |
|---|---|---|---|---|---|---|---|
| 628 E 59th St | 0.00mi | 3/1.0 | 1,213 (0%) | 1mo | $97,000 | $80 | 99 |
| 7115 Nelms St | 0.19mi | 3/1.0 | 1,130 (-7%) | 4mo | $95,000 | $84 | 76 |
| 558 E 60th St | 0.13mi | 3/2.0 | 1,306 (+8%) | 2mo | $210,000 | $161 | 76 |
| 732 57th Street Ct | 0.13mi | 3/1.0 | 1,089 (-10%) | 3mo | $153,900 | $141 | 74 |
| 8020 Oakwood St | 0.56mi | 2/1.0 (-1) | 1,156 (-5%) | 6mo | $65,000 | $56 | 56 |
| 222 Trout River Dr | 0.68mi | 2/1.0 (-1) | 1,248 (+3%) | 5mo | $127,500 | $102 | 55 |
| 264 E 45th St | 0.65mi | 3/1.0 | 1,328 (+10%) | 2mo | $105,000 | $79 | 52 |
| 118 E 45th St | 0.73mi | 3/1.0 | 1,132 (-7%) | 3mo | $161,000 | $142 | 52 |
| 140 E 45th St | 0.71mi | 3/2.0 | 1,166 (-4%) | 4mo | $194,000 | $166 | 52 |
| 110 Tallulah Ave | 0.67mi | 3/1.0 | 1,102 (-9%) | 2mo | $181,000 | $164 | 52 |
| 6711 Drayton St | 0.66mi | 3/1.0 | 1,088 (-10%) | 3mo | $138,000 | $127 | 50 |
| 8024 Hawthorne St | 0.62mi | 2/1.0 (-1) | 1,042 (-14%) | 2mo | $115,000 | $110 | 41 |
Match score weights: distance 35% · size 25% · config 20% · recency 20%. Top-matched comps best support the ARV.
Projected returns pro-forma
-3.0% appreciation · 0.0% rent growth · sell at horizon
- IRR
- 6.1%
- Equity multiple
- 1.23×
- Total profit
- $6,235
- Equity at exit
- $14,463
- IRR
- 12.5%
- Equity multiple
- 1.85×
- Total profit
- $23,044
- Equity at exit
- $8,387
Cash invested: $27,160 (down + closing). Projections, not guarantees.
Landlord ↔ Tenant lean methodology
- Overall (STATE)
- 87 Strongly Landlord-Friendly
- State Florida
- 87 Strongly Landlord-Friendly · R+3
- County
- — inherits STATE
- City
- — inherits STATE
ZIP-level market 32208
- Home prices YoY
- -33.6%
- Rents YoY
- -1.4%
- Active inventory
- 291
- Price-to-rent
- 5.7×
Monthly cashflow live
- Estimated rent
- $1,430 high interval (Pro) →
- Mortgage (P&I)
- −$509
- Tax from tax record
- −$171 /mo · $2,050/yr
- Insurance
- −$40
- HOA
- −$0
- Vacancy / Maint / Mgmt
- −$300
- Net cashflow
- $410
Break-even live
UW: 25.0% down · 7.5% · 30yr · 1.5% tax · 5.0% vac · 8.0% maint · 8.0% mgmt
Financing live
Cash to close
- Down payment
- $24,250
- Closing costs
- $2,910
- Reserves months
- —
- Total cash needed
- —
Loan-product check · same deal, 3 products live
Conventional
25% down · 7.5% · 30yr
- Down + closing
- —
- Monthly P&I
- —
- Monthly cashflow
- —
- DSCR
- —
- Eligible?
- —
Personal DTI + credit; lowest rate.
DSCR
20% down · 8.5% · 30yr
- Down + closing
- —
- Monthly P&I
- —
- Monthly cashflow
- —
- DSCR
- —
- Eligible?
- —
No personal income docs; deal must DSCR.
Hard money
10% down · 12.0% · 12mo
- Down + closing
- —
- Monthly P&I
- —
- Monthly cashflow
- —
- DSCR
- —
- Eligible?
- —
Short-term bridge; refi at stabilization.
Rent comps 40 comps
| Address | Beds | Baths | Sqft | Rent | $/sqft | DOM | Units | Dist |
|---|---|---|---|---|---|---|---|---|
| 6945 Nelms St Jacksonville, FL | 4.0 | 2.0 | 1128 | $1,550 | $1.37 | 3d | 1 | 0.14mi |
| 524 E 60th St Jacksonville, FL | 3.0 | 1.0 | 1212 | $1,195 | $0.99 | 7d | 1 | 0.16mi |
| 814 E 60th St Jacksonville, FL | 2.0 | 1.0 | 981 | $1,199 | $1.22 | 2d | 1 | 0.16mi |
| 525 E 60th St Jacksonville, FL | 3.0 | 2.0 | 1120 | $1,471 | $1.31 | 24d | 1 | 0.16mi |
| 7140 Buffalo Ave Jacksonville, FL | 2.0 | 1.0 | 832 | $1,321 | $1.59 | 24d | 1 | 0.17mi |
| 516 E 58th St Jacksonville, FL | 4.0 | 2.0 | 1232 | $1,725 | $1.40 | 7d | 1 | 0.18mi |
| 841 E 60th St Jacksonville, FL | 3.0 | 1.0 | 954 | $1,225 | $1.28 | 24d | 1 | 0.20mi |
| 567 E 55th St Jacksonville, FL | 3.0 | 2.0 | 1230 | $1,488 | $1.21 | 14d | 1 | 0.21mi |
| 555 E 55th St Jacksonville, FL | 3.0 | 2.0 | 1230 | $1,488 | $1.21 | 10d | 1 | 0.22mi |
| 549 E 55th St Jacksonville, FL | 3.0 | 2.0 | 1230 | $1,488 | $1.21 | 10d | 1 | 0.23mi |
| 8027 Floyd St Jacksonville, FL | 2.0 | 1.5 | 935 | $1,300 | $1.39 | 3d | 1 | 0.33mi |
| 7545 Wilder Ave Jacksonville, FL | 3.0 | 1.0 | 1300 | $1,150 | $0.88 | 3d | 1 | 0.43mi |
| 7525 Oakwood St Jacksonville, FL | 3.0 | 1.0 | 945 | $1,375 | $1.46 | 14d | 1 | 0.44mi |
| 41 Tallulah Ave Jacksonville, FL | 3.0 | 1.0 | 1092 | $1,390 | $1.27 | 3d | 1 | 0.54mi |
| 217 E 48th St Jacksonville, FL | 3.0 | 1.0 | 979 | $1,096 | $1.12 | 10d | 1 | 0.56mi |
| 33 W 55th St Jacksonville, FL | 4.0 | 2.0 | 1387 | $1,321 | $0.95 | 3d | 1 | 0.59mi |
| 349 E 45th St Jacksonville, FL | 2.0 | 1.0 | 954 | $1,175 | $1.23 | 7d | 1 | 0.61mi |
| 7115 Lucky Dr W Jacksonville, FL | 3.0 | 1.0 | 1158 | $1,500 | $1.30 | 24d | 1 | 0.65mi |
| 345 E 44th St Jacksonville, FL | 3.0 | 1.0 | 1145 | $1,150 | $1.00 | 24d | 1 | 0.65mi |
| 209 Woodrow St Jacksonville, FL | 3.0 | 1.0 | 1282 | $1,325 | $1.03 | 24d | 1 | 0.72mi |
| 205 E 44th St Jacksonville, FL | 3.0 | 1.0 | 955 | $1,075 | $1.13 | 21d | 1 | 0.73mi |
| 6418 Sapphire Dr Jacksonville, FL | 3.0 | 1.5 | 1296 | $1,350 | $1.04 | 24d | 1 | 0.77mi |
| 222 E 43rd St Jacksonville, FL | 2.0 | 1.0 | 840 | $946 | $1.13 | 24d | 1 | 0.79mi |
| 18 W 43rd St Jacksonville, FL | 2.0 | 1.0 | 750 | $795 | $1.06 | 4d | 1 | 0.93mi |
| 343 W 60th St Jacksonville, FL | 3.0 | 1.0 | 1238 | $1,299 | $1.05 | 21d | 1 | 0.96mi |
| 319 W 49th St Jacksonville, FL | 2.0 | 1.0 | 977 | $1,200 | $1.23 | 24d | 1 | 0.99mi |
| 5035 N Main St Jacksonville, FL | 3.0 | 1.0–2.0 | 816 | $1,459 | $1.79 | 24d | 69 | 0.99mi |
| 356 Duray Ct Jacksonville, FL | 3.0 | 2.0 | 1070 | $1,425 | $1.33 | 14d | 1 | 1.00mi |
| 141 W 43rd St Jacksonville, FL | 3.0 | 2.0 | 1022 | $1,231 | $1.20 | 3d | 1 | 1.01mi |
| 385 Duray Ct Jacksonville, FL | 3.0 | 1.0 | 932 | $1,250 | $1.34 | 20d | 1 | 1.04mi |
| 346 W 68th St Jacksonville, FL | 3.0 | 1.0 | 1114 | $1,385 | $1.24 | 4d | 1 | 1.06mi |
| 425 W 47th St Jacksonville, FL | 3.0 | 1.5 | 1083 | $1,193 | $1.10 | 7d | 1 | 1.06mi |
| 6460 Lanark Ave Jacksonville, FL | 2.0 | 1.0 | 708 | $1,095 | $1.55 | 24d | 1 | 1.14mi |
| 472 W 65th St Jacksonville, FL | 3.0 | 1.0 | 1312 | $1,295 | $0.99 | 21d | 1 | 1.14mi |
| 7124 Lorain St Jacksonville, FL | 3.0 | 1.0 | 864 | $1,043 | $1.21 | 3d | 1 | 1.16mi |
| 535 W 59th St Jacksonville, FL | 3.0 | 2.0 | 816 | $1,395 | $1.71 | 7d | 1 | 1.16mi |
| 562 W 49th St Jacksonville, FL | 3.0 | 1.0 | 1091 | $1,195 | $1.10 | 24d | 1 | 1.17mi |
| 22 W 38th St Jacksonville, FL | 2.0 | 1.0 | 800 | $1,100 | $1.38 | 24d | 1 | 1.21mi |
| 7511 N Shore Dr Jacksonville, FL | 2.0 | 1.0 | 1014 | $1,350 | $1.33 | 4d | 1 | 1.24mi |
| 4918 N Pearl St Jacksonville, FL | 2.0 | 1.0 | 850 | $895 | $1.05 | 24d | 1 | 1.25mi |
Listing history 43 events
-
2026-05-12status Pending
-
2026-04-27historical Active Under Contract
-
2026-04-17status Active
-
2026-04-06status Active
-
2026-04-06historical
-
2026-03-23historical Active Under Contract
-
2026-03-18price $97,000
-
2026-03-12price $98,000
-
2026-02-24price $100,000
-
2026-02-10price $102,500
-
2026-02-03price $104,000
-
2026-01-27price $105,000
-
2026-01-22price $107,500
-
2026-01-14price $109,000
-
2025-12-23status Active
-
2025-11-26historical
-
2025-11-13status Active
-
2025-11-13price $110,000
-
2025-11-13historical
-
2025-11-12status Active
-
2025-10-31historical Active Under Contract
-
2025-10-28price $105,000
-
2025-10-10status Active
-
2025-10-10price $110,000
-
2025-10-09historical
-
2025-09-30price $95,000
-
2025-09-23price $100,000
-
2025-09-16price $105,000
-
2025-09-03$109,000 Active
-
2025-08-26soldstatus $1,750,000
-
2025-08-26soldstatus $1,750,000
-
2025-04-29soldstatus $601,200
-
2013-07-10$13,500 130-char remark
Show marketing remark (130 chars)
If TLC stood for This house had Limited Care then you found a TLC. NICE INVESTMENT PROPERTY across the street FROM PARKS AND TOWN.
-
2012-09-27historical 122-char remark
Show marketing remark (122 chars)
NICE INVESTMENT PROPERTY NOT FAR FROM PARKS AND TOWN. THIS CAN BE INCLUDED IN A GROUP OF 4 PROPERTIES WITH THE SAME OWNER.
-
2012-02-29$15,000 122-char remark
Show marketing remark (122 chars)
NICE INVESTMENT PROPERTY NOT FAR FROM PARKS AND TOWN. THIS CAN BE INCLUDED IN A GROUP OF 4 PROPERTIES WITH THE SAME OWNER.
-
2011-12-09historical
-
2011-01-11$35,000
-
2004-09-15historical
-
2004-09-10soldstatus $64,000
-
2004-08-27soldstatus $64,000
-
2004-03-12$75,000
-
1981-11-01soldstatus $27,000
-
1981-08-01soldstatus $12,500
ⓘ Source: listings_history table (triggers on properties + properties_extension) + one-shot
backfill from property_details.listing_events for pre-trigger history.
Tax reassessment forecast FL · Resets to sale price
- Current annual tax
- $2,050 · $171/mo
- Projected year-2 tax
- $2,050 · $171/mo
- Expected delta
- $0/yr ($0/mo · 0.0%)
ⓘ Screening estimate from a state-policy table — verify with the county assessor before closing.
Climate risk First Street
- Flood 5/10 Major FEMA zone X (unshaded) · 23% chance over 30 yrs
- Wildfire 2/10 Low
- Heat 9/10 Extreme 7 d/yr ≥107°F today · 20 d/yr by 30 yrs out
- Wind 9/10 Extreme 99% chance of damaging wind over 30 yrs
- Air quality 4/10 Moderate 6 unhealthy d/yr today · 6 by 30 yrs out
Nearby sold comps map
Loading sold comps map…
Walkable amenities ~0.75 mi
Loading nearby amenities…
Taxation est. · year 1
- Rental income
- $17,158
- − Mortgage interest
- −$5,434
- − Property taxes
- −$2,050
- − Insurance
- −$485
- − Repairs & maintenance
- −$1,373
- − Management
- −$1,373
- − Depreciation
- −$2,822
- Taxable income
- $3,623
- Est. tax owed @ 24.0%
- −$869
- After-tax cash flow
- $4,047/yr
For passive investors: Depreciation is non-cash, so a rental often shows a tax loss while cash-flowing — sheltering income. Rental losses are passive: they offset passive income freely, and up to $25,000/yr can offset ordinary (W-2) income if you actively participate and your MAGI is under $100k (phasing out to $0 by $150k); unused losses carry forward. On sale, claimed depreciation is recaptured at up to 25%, and gains may owe capital-gains tax (a 1031 exchange can defer both). Figures are a year-1 estimate at your 24.0% rate — not tax advice; consult a CPA.
Schools (NCES district)
- District
- Duval
- NCES district ID
- 1200480
- Math proficiency
- 46% ▼ -11.00%
- Reading proficiency
- 45% ▼ -4.00%
- Median HH income
- $48,987
- Composite
- 38.97/100
- National rank
- #4076
- State rank
- #48 of 73 in FL
Livability — Jacksonville
- Score
- 83/100
- State rank
- #50
- US rank
- #911
Category grades
Schools grade is shown separately in the Schools card above.
Census & demographics
- Census place
- Jacksonville, FL
- County
- Duval County · 1,015,274 people
- City population
- 979,034
- Metro
- Jacksonville, FL
- Population (ZIP)
- 32,699
- Household income
- $41,324
- Rent vs Own
- Severe rent burden
- 1765.0
Population outlook (Duval County) Hauer SSP2
- Today (2025)
- 1,013,010 people
- By 2030
- 1,059,228 · +4.6%
- By 2040
- 1,141,439 · +12.7%
- By 2050
- 1,205,258 · +19.0%
- By 2075
- 1,324,282 · +30.7%
- By 2100
- 1,319,620 · +30.3%
Race, ethnicity, and origin ACS 2023
- Neighborhood character
- Predominantly Black (77%)
- Race & ethnicity
- Black 77% White 16% Two or more races 4% Hispanic / Latino 3%
- Common ancestry
- Italian 1%
- Foreign-born
- 2% · Canada
- Languages at home
- 97% English-only · Spanish 2%
Political lean MEDSL · Duval
- 2024 margin
- Toss-up / Even · D 48.7% · R 50.1% · Other 1.2%
- 2008→2024 swing
- +0.4pp no change · 2008: -1.9pp · 2024: -1.5pp
- All cycles
- 2024: R+1.5 2020: D+3.8 2016: R+1.5 2012: R+3.6 2008: R+1.9
Not yet ingested
- Civics
- —
Market trends
- HPI YoY
- ▼ -110.56%
- Current HPI
- 217.9706
- Rent YoY
- ▼ -1.36%
- Metro
- Jacksonville, FL
- State GDP YoY
- ▲ 3.28%
- F500 in state
- 36
Industry mix (Fortune 500 HQ in FL)
| Industry | F500 HQs | Revenue |
|---|---|---|
| Industrial Technology | 2 | $29B |
|
||
| Insurance | 2 | $17B |
|
||
| Retail | 1 | $60B |
|
||
| Technology Distribution | 1 | $58B |
|
||
| Homebuilding | 1 | $35B |
|
||
| Technology Manufacturing | 1 | $35B |
|
||
Price history
+676.0% since first listed43 events — show timeline
- 2026-05-12 Pending — realMLS
- 2026-04-27 Contingent — realMLS
- 2026-04-17 Relisted — realMLS
- 2026-04-06 Relisted — realMLS
- 2026-04-06 Listing Removed — realMLS
- 2026-03-23 Contingent — realMLS
- 2026-03-18 Price Changed $97,000 realMLS
- 2026-03-12 Price Changed $98,000 realMLS
- 2026-02-24 Price Changed $100,000 realMLS
- 2026-02-10 Price Changed $102,500 realMLS
- 2026-02-03 Price Changed $104,000 realMLS
- 2026-01-27 Price Changed $105,000 realMLS
- 2026-01-22 Price Changed $107,500 realMLS
- 2026-01-14 Price Changed $109,000 realMLS
- 2025-12-23 Relisted — realMLS
- 2025-11-26 Listing Removed — realMLS
- 2025-11-13 Relisted — realMLS
- 2025-11-13 Price Changed $110,000 realMLS
- 2025-11-13 Listing Removed — realMLS
- 2025-11-12 Relisted — realMLS
- 2025-10-31 Contingent — realMLS
- 2025-10-28 Price Changed $105,000 realMLS
- 2025-10-10 Relisted — realMLS
- 2025-10-10 Price Changed $110,000 realMLS
- 2025-10-09 Listing Removed — realMLS
- 2025-09-30 Price Changed $95,000 realMLS
- 2025-09-23 Price Changed $100,000 realMLS
- 2025-09-16 Price Changed $105,000 realMLS
- 2025-09-03 Listed $109,000 realMLS
- 2025-08-26 Sold (Public Records) $1,750,000 Public Records
- 2025-08-26 Sold (Public Records) $1,750,000 Public Records
- 2025-04-29 Sold (Public Records) $601,200 Public Records
- 2013-07-10 Listed $13,500 realMLS
- 2012-09-27 Listing Removed — realMLS
- 2012-02-29 Listed $15,000 realMLS
- 2011-12-09 Listing Removed — realMLS
- 2011-01-11 Listed $35,000 realMLS
- 2004-09-15 Listing Removed — realMLS
- 2004-09-10 Sold (Public Records) $64,000 Public Records
- 2004-08-27 Sold (MLS) $64,000 realMLS
- 2004-03-12 Listed $75,000 realMLS
- 1981-11-01 Sold (Public Records) $27,000 Public Records
- 1981-08-01 Sold (Public Records) $12,500 Public Records
Property tax history
+6.1%/yrLatest (2025): $2,050 · +17.2% YoY. Source: county tax records.
Cash-flow waterfall
monthlySold comps — $/sqft
last 12 mo · ≤1 miLoading sold comps…