163 Half Moon Rd · McCord Bend, MO
Flood risk 1/10 · Minimal
- FEMA flood zone
- X (unshaded)
- Chance of flooding over 30 yrs
- 0.0%
- Est. flood insurance / yr
- $507 – $1,088
Fire risk 3/10 · Minor
- Est. fire insurance / yr
- $1,054 – $1,958
Heat risk 5/10 · Moderate
- Hot days now (above 104°F)
- 7 days/yr
- Hot days in 30 yrs
- 20 days/yr
Wind risk 2/10 · Minimal
- Chance of severe wind over 30 yrs
- 1.0%
Air-quality risk 1/10 · Minimal
- Unhealthy air days now
- 0 days/yr
- Unhealthy air days in 30 yrs
- 0 days/yr
Risk factors via First Street. Map © Google.
Why this score? — see what drove the B- grade
The composite is a weighted blend of 9 inputs, each scored 0–100. Each bar is that input's sub-score; the figure is the points it added to the 100-point composite (weight × sub-score).
- Cash flow +26.2/30.0
- DSCR +8.9/10.0
- ARV discount +7.5/15.0
- Appreciation +7.0/10.0
- 1% rule +6.0/10.0
- Schools +3.2/10.0
- Livability +2.6/5.0
- Rent growth +2.5/5.0
- Condition / age +2.5/5.0
$94,900
🖨 Deal sheet 📄 Offer letter ✓ Due diligence
Listing remarks MLS
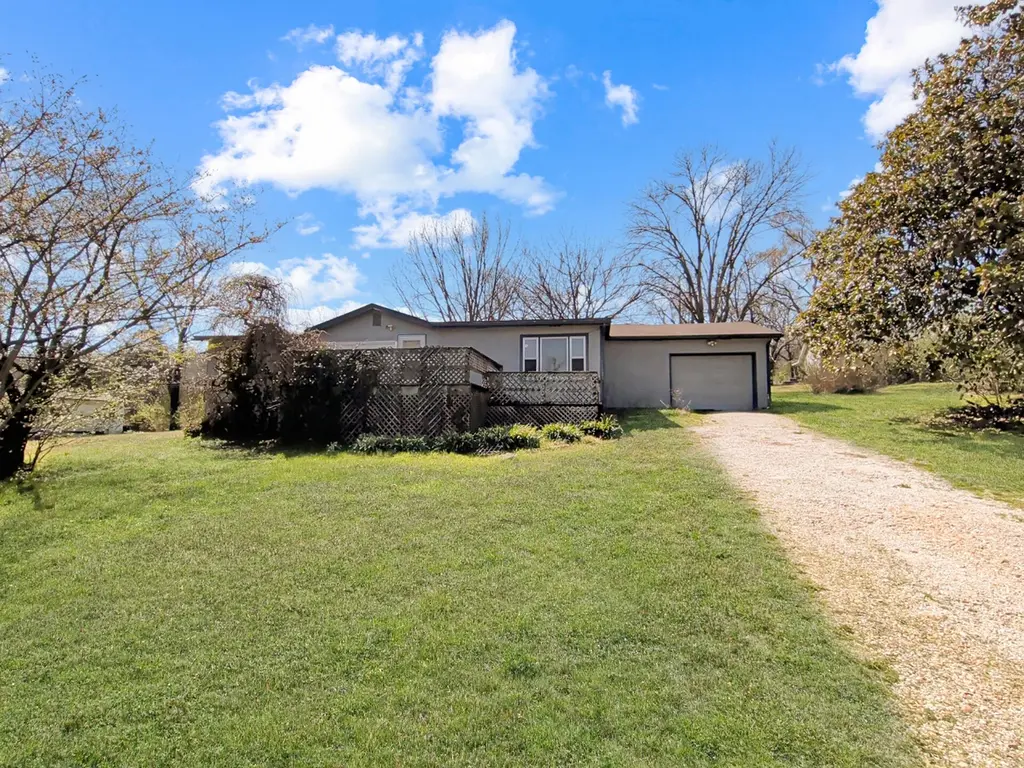
This inviting Cape Fair residence offers approximately 1,812 square feet of versatile living space, featuring two bedrooms and one well-appointed bathroom. The home includes a functional layout complemented by a one-car attached garage for convenient parking and storage. Outdoor living is made easy with a private deck, perfect for enjoying the peaceful surroundings near Table Rock Lake. Located in the Holiday Hill community, this property provides a comfortable and move-in-ready environment for any resident seeking a well-maintained home in Stone County.
Key facts
- Private deck
- Near table rock lake
- 0.9 acre lot
Tags
Neighborhood map
What this means for you Summary
Snapshot
- This is a 2-bed/1.0-bath other listed at $95k.
Deal economics
- At list price, monthly cash flow is $243 ($3k/yr) — positive.
- The deal already cash-flows at list — no discount required.
- Meets the 1% rule at list price ($1k rent vs $95k).
- Recommended offer: $89k (6.0% below list) — sets the bar for market timing.
- Cap rate 9.4% vs local median 1.3% in McCord Bend — top-decile yield for the area; either an underpriced asset or a hidden risk that comps aren't pricing in. Stress-test before assuming the spread holds.
Location & tenants
- Location reads 51/100 on livability (#875 in MO) — a working-class tenant base; expect higher turnover. Strengths: cost of living A+, housing A+; Watch: health & safety C-, schools F, crime F.
- Reeds Spring R-IV (rural): math 34% / reading 42% proficiency, ranked #182 of 324 in MO (top 56%) — families likely to look elsewhere, expect single-tenant / working-renter base with shorter leases.
- Market conditions: 78 active listings in the ZIP; 191 units permitted in Stone County in 2024 (0 in 5+ unit buildings).
Forward outlook
- In year one you build about $4k of equity ($656 loan paydown + $4k appreciation (4.0% local appreciation)).
- Stone County population projected at -30% by 2050 — secular population decline; favor cash flow + early exit over multi-decade hold.
- At projected returns (4.0% appreciation + 3.0% rent growth), your $27k cash investment doubles in ~4 years — after that, you're playing with house money.
- By year 8, paydown + projected appreciation supports a ~$33k cash-out refi (75% LTV) — recoverable capital for the next deal without selling this one.
Negotiation context
- It's been on market 66 days — a 6% lower offer ($89k) is reasonable based on typical stale-listing flexibility.
Risks & watch-outs
- Climate carrying-cost: extreme-heat days projected 7→20/yr by 2055 (HVAC capex compounding) — expect insurance premiums to compound above CPI over the hold.
Questions for the listing agent
- It's been on market 66 days. Have you received any prior offers? Is the seller open to a 6% concession, seller financing, or rate buy-down credit?
- Built in 1965 — when were the roof, HVAC, electrical panel, plumbing, and water heater last replaced?
- Why hasn't it sold? Are there any deal-killer items the seller is aware of (foundation, flood, title, zoning, code violations)?
- Is there a deadline driving the sale (1031 exchange, divorce, estate, relocation)? That informs how much negotiation room exists.
- Schools are F-rated, which usually means shorter tenancies and higher turnover. Who's the typical renter profile here, and what's been the actual vacancy rate?
- Crime grade is F in this area — have there been break-ins, vandalism, or insurance claims at this property in the last 3 years? What carrier currently insures it and at what premium?
- What's the average days-on-market for RENTAL listings here right now (not sales)? A rising rental-DOM trend means longer vacancies and softer asking-rent achievability than the comps imply.
- What's the recent tenant-quality profile in this submarket — average credit score on applications, eviction rate, late-payment / NSF rate, and stable-employment percentage? A property-management company in the area should have these aggregated.
- How much new for-sale + rental construction is in the pipeline within 1–3 miles? Heavy new supply typically softens prices + rents 12–24 months out; constrained supply supports both.
Investment metrics
- 1% rule
- 1.10% ✓
- Cap rate
- 9.37%
- Cash-on-cash
- 10.99%
- DSCR
- 1.49
- GRM
- 7.6
CMA / ARV
- ARV (median comp)
- $323,123
- List price
- $94,900
- Delta
- -70.63%
- Verdict
- UNDERPRICED
- Comps
- 8 within 1.0 mi
Projected returns pro-forma
3.99% appreciation · 3.0% rent growth · sell at horizon
- IRR
- 20.1%
- Equity multiple
- 2.20×
- Total profit
- $31,991
- Equity at exit
- $48,085
- IRR
- 20.5%
- Equity multiple
- 4.24×
- Total profit
- $86,109
- Equity at exit
- $78,623
Cash invested: $26,572 (down + closing). Projections, not guarantees.
Landlord ↔ Tenant lean methodology
- Overall (STATE)
- 81 Strongly Landlord-Friendly
- State Missouri
- 81 Strongly Landlord-Friendly · R+10
- County
- — inherits STATE
- City
- — inherits STATE
ZIP-level market 65624
- Home prices YoY
- 1.9%
- Active inventory
- 78
- Price-to-rent
- 7.6×
Monthly cashflow live
- Estimated rent
- $1,044 medium interval (Pro) →
- Mortgage (P&I)
- −$498
- Tax from tax record
- −$44 /mo · $533/yr
- Insurance
- −$40
- HOA
- −$0
- Vacancy / Maint / Mgmt
- −$219
- Net cashflow
- $243
Break-even live
UW: 25.0% down · 7.5% · 30yr · 1.5% tax · 5.0% vac · 8.0% maint · 8.0% mgmt
Financing live
Cash to close
- Down payment
- $23,725
- Closing costs
- $2,847
- Reserves months
- —
- Total cash needed
- —
Loan-product check · same deal, 3 products live
Conventional
25% down · 7.5% · 30yr
- Down + closing
- —
- Monthly P&I
- —
- Monthly cashflow
- —
- DSCR
- —
- Eligible?
- —
Personal DTI + credit; lowest rate.
DSCR
20% down · 8.5% · 30yr
- Down + closing
- —
- Monthly P&I
- —
- Monthly cashflow
- —
- DSCR
- —
- Eligible?
- —
No personal income docs; deal must DSCR.
Hard money
10% down · 12.0% · 12mo
- Down + closing
- —
- Monthly P&I
- —
- Monthly cashflow
- —
- DSCR
- —
- Eligible?
- —
Short-term bridge; refi at stabilization.
Listing history 19 events
-
2026-06-19days on market $94,900 Active 66 DOM
-
2026-06-18days on market $94,900 Active 65 DOM
-
2026-06-17days on market $94,900 Active 64 DOM
-
2026-06-17price $94,900 Active 63 DOM
-
2026-06-16days on market $109,900 Active 63 DOM
-
2026-06-15days on market $109,900 Active 62 DOM
-
2026-06-14days on market $109,900 Active 60 DOM
-
2026-06-12days on market $109,900 Active 59 DOM
-
2026-06-09days on market $109,900 Active 56 DOM
-
2026-06-08days on market $109,900 Active 55 DOM
-
2026-06-07days on market $109,900 Active 54 DOM
-
2026-06-05days on market $109,900 Active 51 DOM
-
2026-06-03days on market $109,900 Active 50 DOM
-
2026-06-02days on market $109,900 Active 49 DOM
-
2026-06-01days on market $109,900 Active 48 DOM
-
2026-05-31days on market $109,900 Active 47 DOM
-
2026-05-30days on market $109,900 Active 46 DOM
-
2026-05-12price $109,900 561-char remark
Show marketing remark (561 chars)
This inviting Cape Fair residence offers approximately 1,812 square feet of versatile living space, featuring two bedrooms and one well-appointed bathroom. The home includes a functional layout complemented by a one-car attached garage for convenient parking and storage. Outdoor living is made easy with a private deck, perfect for enjoying the peaceful surroundings near Table Rock Lake. Located in the Holiday Hill community, this property provides a comfortable and move-in-ready environment for any resident seeking a well-maintained home in Stone County.
-
2026-04-14$124,900 Active 561-char remark
Show marketing remark (561 chars)
This inviting Cape Fair residence offers approximately 1,812 square feet of versatile living space, featuring two bedrooms and one well-appointed bathroom. The home includes a functional layout complemented by a one-car attached garage for convenient parking and storage. Outdoor living is made easy with a private deck, perfect for enjoying the peaceful surroundings near Table Rock Lake. Located in the Holiday Hill community, this property provides a comfortable and move-in-ready environment for any resident seeking a well-maintained home in Stone County.
ⓘ Source: listings_history table (triggers on properties + properties_extension) + one-shot
backfill from property_details.listing_events for pre-trigger history.
Tax reassessment forecast MO · Resets to sale price
- Current annual tax
- $533 · $44/mo
- Projected year-2 tax
- $921 · $77/mo
- Expected delta
- +$387/yr (+$32/mo · 72.6%)
ⓘ Screening estimate from a state-policy table — verify with the county assessor before closing.
Climate risk First Street
- Flood 1/10 Low FEMA zone X (unshaded) · 0% chance over 30 yrs
- Wildfire 3/10 Moderate
- Heat 5/10 Major 7 d/yr ≥104°F today · 20 d/yr by 30 yrs out
- Wind 2/10 Low 100% chance of damaging wind over 30 yrs
- Air quality 1/10 Low 0 unhealthy d/yr today · 0 by 30 yrs out
Nearby sold comps map
Loading sold comps map…
Walkable amenities ~0.75 mi
Loading nearby amenities…
Taxation est. · year 1
- Rental income
- $12,532
- − Mortgage interest
- −$5,316
- − Property taxes
- −$533
- − Insurance
- −$474
- − Repairs & maintenance
- −$1,003
- − Management
- −$1,003
- − Depreciation
- −$2,761
- Taxable income
- $1,442
- Est. tax owed @ 24.0%
- −$346
- After-tax cash flow
- $2,574/yr
For passive investors: Depreciation is non-cash, so a rental often shows a tax loss while cash-flowing — sheltering income. Rental losses are passive: they offset passive income freely, and up to $25,000/yr can offset ordinary (W-2) income if you actively participate and your MAGI is under $100k (phasing out to $0 by $150k); unused losses carry forward. On sale, claimed depreciation is recaptured at up to 25%, and gains may owe capital-gains tax (a 1031 exchange can defer both). Figures are a year-1 estimate at your 24.0% rate — not tax advice; consult a CPA.
Schools (NCES district)
- District
- Reeds Spring R-IV
- NCES district ID
- 2926160
- Math proficiency
- 34% ▼ -3.00%
- Reading proficiency
- 42% ▼ -1.00%
- Median HH income
- $42,158
- Composite
- 32.06/100
- National rank
- #5819
- State rank
- #182 of 324 in MO
Livability — McCord Bend
- Score
- 51/100
- State rank
- #875
- US rank
- #25259
Category grades
Schools grade is shown separately in the Schools card above.
Census & demographics
- Population (ZIP)
- 1,722
Population outlook (Stone County) Hauer SSP2
- Today (2025)
- 28,147 people
- By 2030
- 26,405 · -6.2%
- By 2040
- 22,762 · -19.1%
- By 2050
- 19,706 · -30.0%
- By 2075
- 14,742 · -47.6%
- By 2100
- 10,832 · -61.5%
Race, ethnicity, and origin ACS 2023
- Neighborhood character
- Predominantly White (87%)
- Race & ethnicity
- White 87% Two or more races 7% Hispanic / Latino 6%
- Hispanic origin (detail)
- Mexican 4%
- Common ancestry
- Lithuanian 4% Slovak 2% Portuguese 2%
- Foreign-born
- 2% · Canada
- Languages at home
- 95% English-only · Spanish 5%
Political lean MEDSL · Stone
- 2024 margin
- Solid R (+61.4) · D 18.9% · R 80.3%
- 2008→2024 swing
- -24.1pp toward R · 2008: -37.3pp · 2024: -61.4pp
- All cycles
- 2024: R+61.4 2020: R+61.1 2016: R+62.1 2012: R+49.2 2008: R+37.3
Not yet ingested
- Civics
- —
Market trends
- HPI YoY
- ▲ 3.99%
- Current HPI
- 209.4136
- Rent YoY
- —
- Metro
- —
- State GDP YoY
- ▲ 1.84%
- F500 in state
- 20
Industry mix (Fortune 500 HQ in MO)
| Industry | F500 HQs | Revenue |
|---|---|---|
| Healthcare | 1 | $163B |
|
||
| Insurance | 1 | $21B |
|
||
| Industrial Technology | 1 | $17B |
|
||
| Retail | 1 | $16B |
|
||
| Industrial Distribution | 1 | $10B |
|
||
| Utilities | 1 | $9B |
|
||
Price history
-12.0% since first listed2 events — show timeline
- 2026-05-12 Price Changed $109,900 SOMO
- 2026-04-14 Listed $124,900 SOMO
Property tax history
+1.5%/yrLatest (2025): $533 · -0.0% YoY. Source: county tax records.
Cash-flow waterfall
monthlySold comps — $/sqft
last 12 mo · ≤1 miLoading sold comps…