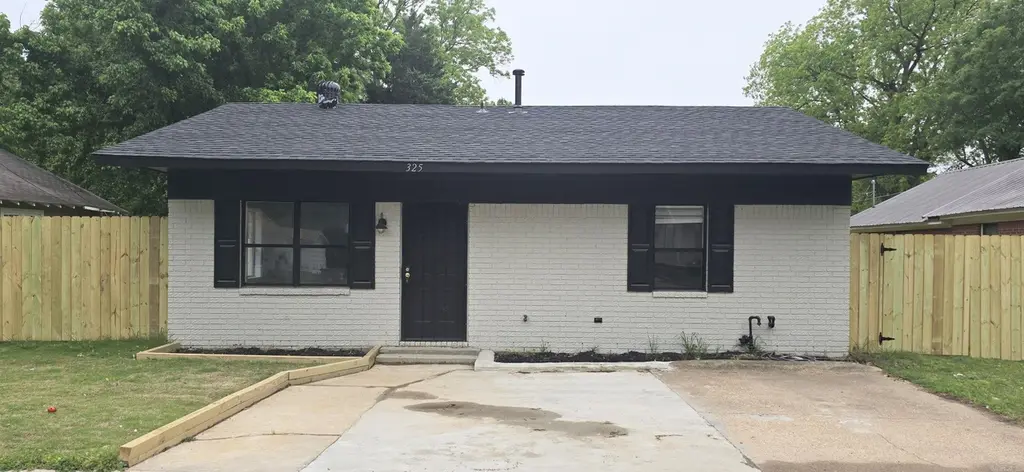
325 Arkansas Ave E · Wynne, AR
Flood risk 1/10 · Minimal
- FEMA flood zone
- X
- Chance of flooding over 30 yrs
- 0.0%
- Est. flood insurance / yr
- $507 – $1,088
Fire risk 2/10 · Minimal
- Est. fire insurance / yr
- $1,499 – $2,785
Heat risk 6/10 · Moderate
- Hot days now (above 109°F)
- 7 days/yr
- Hot days in 30 yrs
- 20 days/yr
Wind risk 4/10 · Minor
- Chance of severe wind over 30 yrs
- 11.0%
Air-quality risk 1/10 · Minimal
- Unhealthy air days now
- 0 days/yr
- Unhealthy air days in 30 yrs
- 0 days/yr
Risk factors via First Street. Map © Google.
Why this score? — see what drove the D+ grade
The composite is a weighted blend of 9 inputs, each scored 0–100. Each bar is that input's sub-score; the figure is the points it added to the 100-point composite (weight × sub-score).
- Cash flow +21.1/30.0
- DSCR +6.7/10.0
- ARV discount +5.0/15.0
- 1% rule +4.4/10.0
- Schools +3.2/10.0
- Livability +2.7/5.0
- Rent growth +2.5/5.0
- Condition / age +2.5/5.0
- Appreciation +0.0/10.0
$92,000
🖨 Deal sheet (PDF) 📄 Offer letter ✓ Due diligence
Listing remarks
Move-In Ready! Newly remodeled 2 bedroom, 1 bath home is conveniently located and has been beautifully updated. Fresh paint and new flooring throughout, gives it a clean, updated feel from the moment you walk in. The eat-in kitchen provides a functional and welcoming space, complete with a convenient pass-through window that opens to the living room—perfect for entertaining or staying connected while cooking. Enjoy peace of mind with a new roof and take advantage of the fully fenced backyard, offering privacy and space for outdoor enjoyment complete with a concrete patio and new fence.
Key facts
- Fresh paint
- Pass-through window
- New flooring
Tags
Property features AI
Finance
- Other: Approximate living area reported as 938; Property located in Cross County, Wynne, AR
Exterior
- Parking: Parking pads
- Utilities: Public sewer; Public water; Municipal electric service (Entergy)
- Home design: Inside city limits; Located in I BLOCK subdivision
- Construction: Architectural shingle roof; Slab foundation; Built on approximately 0.12 acres (107 x 50)
- Exterior features: Brick exterior; Paved road access; Level lot
Interior
- Flooring: Luxury vinyl
- Bathrooms: 1 full bathroom
- Heating & cooling: Central electric heat; Central electric cooling
- Interior features: Luxury vinyl flooring; Level interior
Neighborhood map
What this means for you Summary
Snapshot
- This is a 2-bed/1.0-bath single-family listed at $92k.
Deal economics
- At list price, monthly cash flow is $131 ($2k/yr) — positive.
- The deal already cash-flows at list — no discount required.
- To meet the 1% rule (rent ≥ 1% of price), the offer needs to be $87k (5.6% below list).
- Recommended offer: $87k (5.6% below list) — sets the bar for 1% rule.
- Cap rate 8.0% vs local median 4.5% in Wynne — top-decile yield for the area; either an underpriced asset or a hidden risk that comps aren't pricing in. Stress-test before assuming the spread holds.
Location & tenants
- Location reads 54/100 on livability (#427 in AR) — a working-class tenant base; expect higher turnover. Strengths: cost of living A+, housing A, health & safety A; Watch: schools D, crime F, amenities F.
- Wynne School District (town): math 36% / reading 39% proficiency, ranked #96 of 238 in AR (top 40%) — families likely to look elsewhere, expect single-tenant / working-renter base with shorter leases.
- Market conditions: 99 active listings in the ZIP; 17 units permitted in Cross County in 2024 (0 in 5+ unit buildings).
Forward outlook
- Local home prices are declining (-3.0%/yr); year-one equity from $636 of loan paydown is wiped out by about $3k of value loss. Plan a longer hold.
- Cross County population projected at -20% by 2050 — secular population decline; favor cash flow + early exit over multi-decade hold.
Negotiation context
- It's been on market 46 days — a 3% lower offer ($89k) is reasonable based on typical stale-listing flexibility.
- Current owner paid $40k; list at $92k implies a 130% gain — meaningful room to come down on a strong offer.
Risks & watch-outs
- Climate carrying-cost: extreme-heat days projected 7→20/yr by 2055 (HVAC capex compounding) — expect insurance premiums to compound above CPI over the hold.
Questions for the listing agent
- It's been on market 46 days. Have you received any prior offers? Is the seller open to a 6% concession, seller financing, or rate buy-down credit?
- Is there a deadline driving the sale (1031 exchange, divorce, estate, relocation)? That informs how much negotiation room exists.
- Schools are D-rated, which usually means shorter tenancies and higher turnover. Who's the typical renter profile here, and what's been the actual vacancy rate?
- Crime grade is F in this area — have there been break-ins, vandalism, or insurance claims at this property in the last 3 years? What carrier currently insures it and at what premium?
- The area grade is low — what's the realistic commute time and amenity access for the typical tenant pool here? Any planned neighborhood developments (good or bad) we should know about?
- What's the average days-on-market for RENTAL listings here right now (not sales)? A rising rental-DOM trend means longer vacancies and softer asking-rent achievability than the comps imply.
- What's the recent tenant-quality profile in this submarket — average credit score on applications, eviction rate, late-payment / NSF rate, and stable-employment percentage? A property-management company in the area should have these aggregated.
- How much new for-sale + rental construction is in the pipeline within 1–3 miles? Heavy new supply typically softens prices + rents 12–24 months out; constrained supply supports both.
Investment metrics
- 1% rule
- 0.94% ✗
- Cap rate
- 8.01%
- Cash-on-cash
- 6.12%
- DSCR
- 1.27
- GRM
- 8.8
CMA / ARV
- ARV (on-the-fly)
- $87,234
- Comps found
- 3
Show comp detail 3 sales within ~0.75 mi
| Address | Dist | Beds/Ba | Sqft | Sold | Price | $/sf | Match |
|---|---|---|---|---|---|---|---|
| 206 C E Brawner Rd | 0.75mi | 3/1.0 (+1) | 972 (+4%) | 4mo | $117,900 | $121 | 50 |
| 601 Rowena St | 0.04mi | 3/2.0 (+1) | 1,056 (+13%) | 23mo | $98,000 | $93 | 49 |
| 118 10th St | 0.75mi | 3/1.0 (+1) | 1,075 (+15%) | 16mo | $38,000 | $35 | 22 |
Match score weights: distance 35% · size 25% · config 20% · recency 20%. Top-matched comps best support the ARV.
Projected returns pro-forma
-3.0% appreciation · 3.0% rent growth · sell at horizon
- IRR
- -6.9%
- Equity multiple
- 0.74×
- Total profit
- $-6,575
- Equity at exit
- $13,717
- IRR
- 2.7%
- Equity multiple
- 1.19×
- Total profit
- $4,904
- Equity at exit
- $7,954
Cash invested: $25,760 (down + closing). Projections, not guarantees.
Landlord ↔ Tenant lean methodology
- Overall (STATE)
- 92 Strongly Landlord-Friendly
- State Arkansas
- 92 Strongly Landlord-Friendly · R+14
- County
- — inherits STATE
- City
- — inherits STATE
ZIP-level market 72396
- Home prices YoY
- -17.6%
- Active inventory
- 99
- Price-to-rent
- 8.8×
Monthly cashflow live
- Estimated rent
- $869 medium interval (Pro) →
- Mortgage (P&I)
- −$482
- Tax from tax record
- −$34 /mo · $409/yr
- Insurance
- −$38
- HOA
- −$0
- Vacancy / Maint / Mgmt
- −$182
- Net cashflow
- $131
Break-even live
Sensitivity live
| Price | -10% $183 | -5% $157 | +0% $131 | +5% $105 | +10% $79 |
|---|---|---|---|---|---|
| Rent | -10% $63 | -5% $97 | +0% $131 | +5% $166 | +10% $200 |
| Rate | -1.0pp $178 | -0.5pp $155 | base $131 | +0.5pp $108 | +1.0pp $83 |
UW: 25.0% down · 7.5% · 30yr · 1.5% tax · 5.0% vac · 8.0% maint · 8.0% mgmt
Financing live
Cash to close
- Down payment
- $23,000
- Closing costs
- $2,760
- Reserves months
- —
- Total cash needed
- —
Loan-product check · same deal, 3 products live
Conventional
25% down · 7.5% · 30yr
- Down + closing
- —
- Monthly P&I
- —
- Monthly cashflow
- —
- DSCR
- —
- Eligible?
- —
Personal DTI + credit; lowest rate.
DSCR
20% down · 8.5% · 30yr
- Down + closing
- —
- Monthly P&I
- —
- Monthly cashflow
- —
- DSCR
- —
- Eligible?
- —
No personal income docs; deal must DSCR.
Hard money
10% down · 12.0% · 12mo
- Down + closing
- —
- Monthly P&I
- —
- Monthly cashflow
- —
- DSCR
- —
- Eligible?
- —
Short-term bridge; refi at stabilization.
Listing history 7 events
-
2026-06-04statusdays on market $92,000 Under Contract 46 DOM
-
2026-06-02days on market $92,000 Active 45 DOM
-
2026-06-01days on market $92,000 Active 44 DOM
-
2026-05-31days on market $92,000 Active 43 DOM
-
2026-05-31days on market $92,000 Active 42 DOM
-
2026-04-18$92,000 New Listing
-
2006-06-14soldstatus $40,000
ⓘ Source: listings_history table (triggers on properties + properties_extension) + one-shot
backfill from property_details.listing_events for pre-trigger history.
Tax reassessment forecast AR · Resets to sale price
- Current annual tax
- $409 · $34/mo
- Projected year-2 tax
- $589 · $49/mo
- Expected delta
- +$180/yr (+$15/mo · 44.0%)
ⓘ Screening estimate from a state-policy table — verify with the county assessor before closing.
Climate risk First Street
- Flood 1/10 Low FEMA zone X · 0% chance over 30 yrs
- Wildfire 2/10 Low
- Heat 6/10 Major 7 d/yr ≥109°F today · 20 d/yr by 30 yrs out
- Wind 4/10 Moderate 11% chance of damaging wind over 30 yrs
- Air quality 1/10 Low 0 unhealthy d/yr today · 0 by 30 yrs out
Nearby sold comps map
Loading sold comps map…
Walkable amenities ~0.75 mi
Loading nearby amenities…
Taxation est. · year 1
- Rental income
- $10,425
- − Mortgage interest
- −$5,153
- − Property taxes
- −$409
- − Insurance
- −$460
- − Repairs & maintenance
- −$834
- − Management
- −$834
- − Depreciation
- −$2,676
- Taxable income
- $58
- Est. tax owed @ 24.0%
- −$14
- After-tax cash flow
- $1,563/yr
For passive investors: Depreciation is non-cash, so a rental often shows a tax loss while cash-flowing — sheltering income. Rental losses are passive: they offset passive income freely, and up to $25,000/yr can offset ordinary (W-2) income if you actively participate and your MAGI is under $100k (phasing out to $0 by $150k); unused losses carry forward. On sale, claimed depreciation is recaptured at up to 25%, and gains may owe capital-gains tax (a 1031 exchange can defer both). Figures are a year-1 estimate at your 24.0% rate — not tax advice; consult a CPA.
Schools (NCES district)
- District
- Wynne School District
- NCES district ID
- 0514430
- Math proficiency
- 36% ▼ -8.00%
- Reading proficiency
- 39% ▼ -7.00%
- Median HH income
- $40,508
- Composite
- 31.51/100
- National rank
- #5970
- State rank
- #96 of 238 in AR
Livability — Wynne
- Score
- 54/100
- State rank
- #427
- US rank
- #24166
Category grades
Schools grade is shown separately in the Schools card above.
Census & demographics
- Census place
- Wynne, AR
- Population (ZIP)
- 12,854
Population outlook (Cross County) Hauer SSP2
- Today (2025)
- 16,293 people
- By 2030
- 15,636 · -4.0%
- By 2040
- 14,312 · -12.2%
- By 2050
- 13,050 · -19.9%
- By 2075
- 10,362 · -36.4%
- By 2100
- 7,873 · -51.7%
Race, ethnicity, and origin ACS 2023
- Neighborhood character
- Predominantly White (71%)
- Race & ethnicity
- White 71% Black 20% Two or more races 9% Hispanic / Latino 3%
- Common ancestry
- Italian 3% Slovak 1% Lithuanian 1%
- Foreign-born
- 2%
- Languages at home
- 97% English-only · Arabic 2% Spanish 1%
Political lean MEDSL · Cross
- 2024 margin
- Solid R (+47.6) · D 25.1% · R 72.7% · Other 2.1%
- 2008→2024 swing
- -22.2pp toward R · 2008: -25.4pp · 2024: -47.6pp
- All cycles
- 2024: R+47.6 2020: R+45.7 2016: R+37.8 2012: R+29.8 2008: R+25.4
Not yet ingested
- Civics
- —
Market trends
- HPI YoY
- ▼ -39.26%
- Current HPI
- 184.1112
- Rent YoY
- —
- Metro
- —
- State GDP YoY
- ▲ 3.80%
- F500 in state
- 10
Industry mix (Fortune 500 HQ in AR)
| Industry | F500 HQs | Revenue |
|---|---|---|
| Retail | 1 | $681B |
|
||
| Food / Agriculture | 1 | $53B |
|
||
| Retail / Energy | 1 | $22B |
|
||
| Transportation / Logistics | 1 | $12B |
|
||
| Energy | 1 | $4B |
|
||
Price history
+130.0% since first listed2 events — show timeline
- 2026-04-18 Listed $92,000 CARMLS
- 2006-06-14 Sold (Public Records) $40,000 Public Records
Property tax history
+0.8%/yrLatest (2025): $409 · +9.3% YoY. Source: county tax records.
Cash-flow waterfall
monthlySold comps — $/sqft
last 12 mo · ≤1 miLoading sold comps…