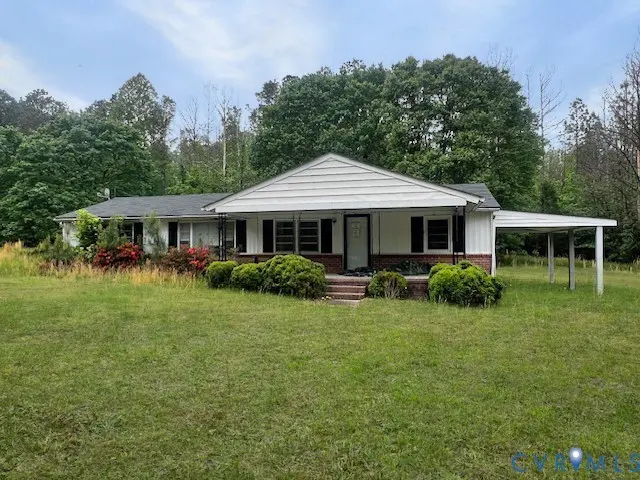
565 Town Bridge Rd · Saluda, VA
Flood risk 1/10 · Minimal
- FEMA flood zone
- X (unshaded)
- Chance of flooding over 30 yrs
- 0.0%
- Est. flood insurance / yr
- $507 – $1,088
Fire risk 4/10 · Minor
- Est. fire insurance / yr
- $666 – $1,236
Heat risk 8/10 · Major
- Hot days now (above 107°F)
- 7 days/yr
- Hot days in 30 yrs
- 16 days/yr
Wind risk 6/10 · Moderate
- Chance of severe wind over 30 yrs
- 74.0%
Air-quality risk 1/10 · Minimal
- Unhealthy air days now
- 0 days/yr
- Unhealthy air days in 30 yrs
- 0 days/yr
Risk factors via First Street. Map © Google.
Why this score? — see what drove the C grade
The composite is a weighted blend of 9 inputs, each scored 0–100. Each bar is that input's sub-score; the figure is the points it added to the 100-point composite (weight × sub-score).
- Cash flow +16.4/30.0
- ARV discount +15.0/15.0
- Appreciation +5.4/10.0
- DSCR +5.1/10.0
- Schools +4.5/10.0
- 1% rule +3.4/10.0
- Rent growth +2.5/5.0
- Condition / age +2.5/5.0
- Livability +2.4/5.0
$159,000
🖨 Deal sheet (PDF) 📄 Offer letter ✓ Due diligence
Listing remarks
Unlock the potential of this 1,220 sq. ft. single-family home, perfectly situated on a generous 0.88-acre level lot. Built in 1962, this 3-bedroom, 1-bathroom residence offers a classic ranch-style footprint that is prime for a modern overhaul. With no HOA fees to contend with, investors have full flexibility for creative renovations or potential expansion. The property includes a carport and garage, providing essential storage and workspace during the rehab process. ARV Potential: Nearby renovated homes in the 23149 area are seeing sales prices ranging from $280k to over $350k, suggesting significant equity growth for the right project.
Key facts
- Generous level lot
- Garage
- Carport
Tags
Property features AI
Exterior
- Parking: No garage
- Utilities: Well water; Septic tank
- Home design: Single-story home; Entry level is 1; Resale property
- Construction: Brick veneer and vinyl siding with frame construction; Drywall interior surfaces; Composition roof
- Exterior features: Lot approximately 0.88 acres; Zoned LDR
Interior
- Kitchen: No kitchen appliance details provided
- Bedrooms: Bedroom located on the main level
- Flooring: Carpet; Tile; Wood
- Bathrooms: 1 full bathroom with tub and shower
- Heating & cooling: Electric baseboard heating
- Interior features: Bedroom on main level; Crawl space basement
- Laundry & utility: Electric water heater
Neighborhood map
What this means for you Summary
Snapshot
- This is a 3-bed/1.0-bath single-family listed at $159k.
Deal economics
- At list price, monthly cash flow is $90 ($1k/yr) — positive.
- The deal already cash-flows at list — no discount required.
- To meet the 1% rule (rent ≥ 1% of price), the offer needs to be $134k (16.0% below list).
- Recommended offer: $134k (16.0% below list) — sets the bar for 1% rule.
- Cap rate 7.0% vs local median 3.0% in Saluda — top-decile yield for the area; either an underpriced asset or a hidden risk that comps aren't pricing in. Stress-test before assuming the spread holds.
Location & tenants
- Location reads 47/100 on livability (#557 in VA) — a working-class tenant base; expect higher turnover. Strengths: crime A, cost of living A, schools B; Watch: amenities F, commute F, employment F.
- Middlesex County Public School District (rural): math 45% / reading 59% proficiency, ranked #90 of 131 in VA (top 69%) — acceptable for families but not a draw, mixed tenant base, ~2y average lease.
- Market conditions: 28 active listings in the ZIP; 97 units permitted in Middlesex County in 2024 (0 in 5+ unit buildings).
Forward outlook
- In year one you build about $2k of equity ($1k loan paydown + $1k appreciation (0.7% local appreciation)).
- Middlesex County population projected at -21% by 2050 — secular population decline; favor cash flow + early exit over multi-decade hold.
- At projected returns (0.7% appreciation + 3.0% rent growth), your $45k cash investment doubles in ~9 years — after that, you're playing with house money.
Negotiation context
- It's been on market 47 days — a 3% lower offer ($154k) is reasonable based on typical stale-listing flexibility.
Risks & watch-outs
- Climate carrying-cost: major wind risk, 74% chance of damaging wind over 30y; extreme-heat days projected 7→16/yr by 2055 (HVAC capex compounding) — expect insurance premiums to compound above CPI over the hold.
Questions for the listing agent
- It's been on market 47 days. Have you received any prior offers? Is the seller open to a 16% concession, seller financing, or rate buy-down credit?
- Built in 1962 — when were the roof, HVAC, electrical panel, plumbing, and water heater last replaced?
- Is there a deadline driving the sale (1031 exchange, divorce, estate, relocation)? That informs how much negotiation room exists.
- Schools are B-rated — typically a magnet for longer-tenancy family renters. What's the average tenant stay here, and is there a school-zone premium baked into asking?
- What's the average days-on-market for RENTAL listings here right now (not sales)? A rising rental-DOM trend means longer vacancies and softer asking-rent achievability than the comps imply.
- What's the recent tenant-quality profile in this submarket — average credit score on applications, eviction rate, late-payment / NSF rate, and stable-employment percentage? A property-management company in the area should have these aggregated.
- How much new for-sale + rental construction is in the pipeline within 1–3 miles? Heavy new supply typically softens prices + rents 12–24 months out; constrained supply supports both.
Investment metrics
- 1% rule
- 0.84% ✗
- Cap rate
- 6.97%
- Cash-on-cash
- 2.42%
- DSCR
- 1.11
- GRM
- 9.9
CMA / ARV
- ARV (median comp)
- $233,000
- List price
- $159,000
- Delta
- -31.76%
- Verdict
- UNDERPRICED
- Comps
- 2 within 1.0 mi
Show comp detail 1 sale within ~0.75 mi
| Address | Dist | Beds/Ba | Sqft | Sold | Price | $/sf | Match |
|---|---|---|---|---|---|---|---|
| 124 Zion Branch Rd | 0.69mi | 3/2.0 | 1,288 (+6%) | 3mo | $326,000 | $253 | 52 |
Match score weights: distance 35% · size 25% · config 20% · recency 20%. Top-matched comps best support the ARV.
Projected returns pro-forma
0.71% appreciation · 3.0% rent growth · sell at horizon
- IRR
- 2.9%
- Equity multiple
- 1.14×
- Total profit
- $6,412
- Equity at exit
- $51,928
- IRR
- 7.6%
- Equity multiple
- 1.90×
- Total profit
- $39,856
- Equity at exit
- $67,225
Cash invested: $44,520 (down + closing). Projections, not guarantees.
Landlord ↔ Tenant lean methodology
- Overall (STATE)
- 55 Moderately Landlord-Leaning
- State Virginia
- 55 Moderately Landlord-Leaning · D+2
- County
- — inherits STATE
- City
- — inherits STATE
ZIP-level market 23149
- Home prices YoY
- 0.2%
- Active inventory
- 28
- Price-to-rent
- 9.9×
Monthly cashflow live
- Estimated rent
- $1,336 medium interval (Pro) →
- Mortgage (P&I)
- −$834
- Tax from tax record
- −$66 /mo · $792/yr
- Insurance
- −$66
- HOA
- −$0
- Vacancy / Maint / Mgmt
- −$281
- Net cashflow
- $90
Break-even live
Sensitivity live
| Price | -10% $180 | -5% $135 | +0% $90 | +5% $45 | +10% $0 |
|---|---|---|---|---|---|
| Rent | -10% $-16 | -5% $37 | +0% $90 | +5% $142 | +10% $195 |
| Rate | -1.0pp $170 | -0.5pp $130 | base $90 | +0.5pp $48 | +1.0pp $7 |
UW: 25.0% down · 7.5% · 30yr · 1.5% tax · 5.0% vac · 8.0% maint · 8.0% mgmt
Financing live
Cash to close
- Down payment
- $39,750
- Closing costs
- $4,770
- Reserves months
- —
- Total cash needed
- —
Loan-product check · same deal, 3 products live
Conventional
25% down · 7.5% · 30yr
- Down + closing
- —
- Monthly P&I
- —
- Monthly cashflow
- —
- DSCR
- —
- Eligible?
- —
Personal DTI + credit; lowest rate.
DSCR
20% down · 8.5% · 30yr
- Down + closing
- —
- Monthly P&I
- —
- Monthly cashflow
- —
- DSCR
- —
- Eligible?
- —
No personal income docs; deal must DSCR.
Hard money
10% down · 12.0% · 12mo
- Down + closing
- —
- Monthly P&I
- —
- Monthly cashflow
- —
- DSCR
- —
- Eligible?
- —
Short-term bridge; refi at stabilization.
Listing history 16 events
-
2026-06-18days on market $159,000 Active 47 DOM
-
2026-06-17days on market $159,000 Active 46 DOM
-
2026-06-16days on market $159,000 Active 45 DOM
-
2026-06-15days on market $159,000 Active 44 DOM
-
2026-06-15days on market $159,000 Active 43 DOM
-
2026-06-13days on market $159,000 Active 42 DOM
-
2026-06-12days on market $159,000 Active 41 DOM
-
2026-06-09days on market $159,000 Active 38 DOM
-
2026-06-08days on market $159,000 Active 37 DOM
-
2026-06-08days on market $159,000 Active 36 DOM
-
2026-06-07days on market $159,000 Active 35 DOM
-
2026-06-03days on market $159,000 Active 32 DOM
-
2026-06-02days on market $159,000 Active 31 DOM
-
2026-06-01days on market $159,000 Active 30 DOM
-
2026-05-31days on market $159,000 Active 29 DOM
-
2026-05-02$159,000 Active 645-char remark
ⓘ Source: listings_history table (triggers on properties + properties_extension) + one-shot
backfill from property_details.listing_events for pre-trigger history.
Tax reassessment forecast VA · Resets to sale price
- Current annual tax
- $792 · $66/mo
- Projected year-2 tax
- $1,304 · $109/mo
- Expected delta
- +$512/yr (+$43/mo · 64.7%)
ⓘ Screening estimate from a state-policy table — verify with the county assessor before closing.
Climate risk First Street
- Flood 1/10 Low FEMA zone X (unshaded) · 0% chance over 30 yrs
- Wildfire 4/10 Moderate
- Heat 8/10 Severe 7 d/yr ≥107°F today · 16 d/yr by 30 yrs out
- Wind 6/10 Major 74% chance of damaging wind over 30 yrs
- Air quality 1/10 Low 0 unhealthy d/yr today · 0 by 30 yrs out
Nearby sold comps map
Loading sold comps map…
Walkable amenities ~0.75 mi
Loading nearby amenities…
Taxation est. · year 1
- Rental income
- $16,036
- − Mortgage interest
- −$8,906
- − Property taxes
- −$792
- − Insurance
- −$795
- − Repairs & maintenance
- −$1,283
- − Management
- −$1,283
- − Depreciation
- −$4,625
- Taxable loss
- −$1,648
- Est. tax savings @ 24.0%
- +$396
- After-tax cash flow
- $1,472/yr
For passive investors: Depreciation is non-cash, so a rental often shows a tax loss while cash-flowing — sheltering income. Rental losses are passive: they offset passive income freely, and up to $25,000/yr can offset ordinary (W-2) income if you actively participate and your MAGI is under $100k (phasing out to $0 by $150k); unused losses carry forward. On sale, claimed depreciation is recaptured at up to 25%, and gains may owe capital-gains tax (a 1031 exchange can defer both). Figures are a year-1 estimate at your 24.0% rate — not tax advice; consult a CPA.
Schools (NCES district)
- District
- Middlesex County Public School District
- NCES district ID
- 5102490
- Math proficiency
- 45% ▼ -35.00%
- Reading proficiency
- 59% ▼ -11.00%
- Median HH income
- $51,986
- Composite
- 44.58/100
- National rank
- #2783
- State rank
- #90 of 131 in VA
Livability — Saluda
- Score
- 47/100
- State rank
- #557
- US rank
- #26208
Category grades
Schools grade is shown separately in the Schools card above.
Census & demographics
- Population (ZIP)
- 2,535
Population outlook (Middlesex County) Hauer SSP2
- Today (2025)
- 9,829 people
- By 2030
- 9,340 · -5.0%
- By 2040
- 8,411 · -14.4%
- By 2050
- 7,795 · -20.7%
- By 2075
- 7,471 · -24.0%
- By 2100
- 7,049 · -28.3%
Race, ethnicity, and origin ACS 2023
- Neighborhood character
- Diverse neighborhood (Simpson 0.58)
- Race & ethnicity
- White 63% Two or more races 19% Black 15% Hispanic / Latino 6%
- Hispanic origin (detail)
- Mexican 2%
- Common ancestry
- Lithuanian 7% Romanian 3% Slovak 3%
- Foreign-born
- 5% · Canada
- Languages at home
- 94% English-only · Spanish 6%
Political lean MEDSL · Middlesex
- 2024 margin
- Strong R (+27.4) · D 35.9% · R 63.3%
- 2008→2024 swing
- -8.2pp toward R · 2008: -19.2pp · 2024: -27.4pp
- All cycles
- 2024: R+27.4 2020: R+25.1 2016: R+26.0 2012: R+20.6 2008: R+19.2
Not yet ingested
- Civics
- —
Market trends
- HPI YoY
- ▲ 0.71%
- Current HPI
- 360.0601
- Rent YoY
- —
- Metro
- —
- State GDP YoY
- ▲ 2.40%
- F500 in state
- 50
Industry mix (Fortune 500 HQ in VA)
| Industry | F500 HQs | Revenue |
|---|---|---|
| Aerospace / Defense | 4 | $236B |
|
||
| Technology / Defense | 3 | $32B |
|
||
| Financial Services | 2 | $176B |
|
||
| Utilities | 2 | $27B |
|
||
| Insurance | 2 | $25B |
|
||
| Technology | 2 | $15B |
|
||
Price history
1 event — show timeline
- 2026-05-02 Listed $159,000 CVRMLS
Property tax history
+3.7%/yrLatest (2025): $792 · +0.0% YoY. Source: county tax records.
Cash-flow waterfall
monthlySold comps — $/sqft
last 12 mo · ≤1 miLoading sold comps…