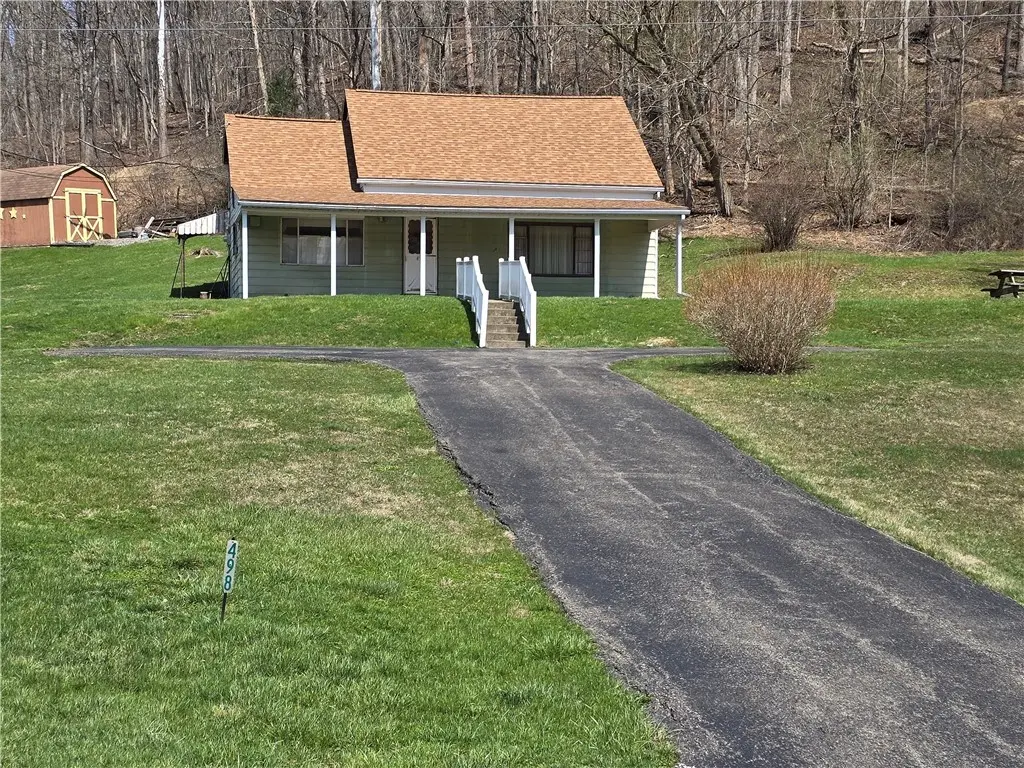
498 Lardintown Rd · Tarentum, PA
Flood risk 4/10 · Minor
- FEMA flood zone
- X (unshaded)
- Chance of flooding over 30 yrs
- 0.24%
- Est. flood insurance / yr
- $507 – $1,088
Fire risk 1/10 · Minimal
- Est. fire insurance / yr
- $511 – $949
Heat risk 4/10 · Minor
- Hot days now (above 97°F)
- 7 days/yr
- Hot days in 30 yrs
- 18 days/yr
Wind risk 2/10 · Minimal
- Chance of severe wind over 30 yrs
- —
Air-quality risk 3/10 · Minor
- Unhealthy air days now
- 3 days/yr
- Unhealthy air days in 30 yrs
- 5 days/yr
Risk factors via First Street. Map © Google.
Why this score? — see what drove the D+ grade
The composite is a weighted blend of 9 inputs, each scored 0–100. Each bar is that input's sub-score; the figure is the points it added to the 100-point composite (weight × sub-score).
- Cash flow +15.0/30.0
- ARV discount +7.5/15.0
- Appreciation +5.2/10.0
- 1% rule +5.0/10.0
- DSCR +5.0/10.0
- Livability +4.0/5.0
- Schools +3.3/10.0
- Rent growth +2.5/5.0
- Condition / age +2.5/5.0
$25,000
🖨 Deal sheet 📄 Offer letter ✓ Due diligence
Listing remarks
Investor special or the perfect opportunity to start fresh! This 5 bedroom, 1 1/2 bath home sits on a generous 1.34 acre lot with plenty of room to build, expand, or reimagine. The existing structure will require significant repair work or could be removed entirely to make way for new construction. The value is truly in the land and the potential of the property. With over an acre of space, this is a great canvas for a new build or a renovation project for the right buyer. Whether you’re an investor, builder, or someone looking for acreage to create your own vision, this property offers the chance to bring your ideas to life. Tons of opportunity here!
Key facts
- Acreage to create
- 1.34 acre lot
- 1.34 acre lot
Tags
Neighborhood map
What this means for you Summary
Snapshot
- This is a 3-bed/2.0-bath single-family listed at $25k.
Deal economics
- At list price, monthly cash flow is $921 ($11k/yr) — positive.
- The deal already cash-flows at list — no discount required.
- Meets the 1% rule at list price ($1k rent vs $25k).
- Cap rate 50.5% vs local median 9.6% in Tarentum — top-decile yield for the area; either an underpriced asset or a hidden risk that comps aren't pricing in. Stress-test before assuming the spread holds.
Location & tenants
- Location reads 79/100 on livability (#240 in PA, #2,066 nationally) — a middle-class / working-renter tenant base. Strengths: commute A+, cost of living A+, housing A+; Watch: schools C-, amenities F, employment F.
- Highlands SD (suburban): math 29% / reading 48% proficiency, ranked #376 of 539 in PA (top 70%) — families likely to look elsewhere, expect single-tenant / working-renter base with shorter leases.
- Market conditions: 39 active listings in the ZIP; 2,996 units permitted in Allegheny County in 2024 (1,588 in 5+ unit buildings).
Forward outlook
- In year one you build about $286 of equity ($173 loan paydown + $113 appreciation (0.5% local appreciation)).
- At projected returns (0.5% appreciation + 3.0% rent growth), your $7k cash investment doubles in ~1 year — after that, you're playing with house money.
Negotiation context
- Only 7 days on market — expect competitive offers; lowballing is unlikely to land.
- 2 sale attempts with the ask held roughly flat each time — persistent listings suggest the price (not the market) is what's stuck; bring a comps-based counter.
Risks & watch-outs
- Watch-outs: built in 1930 — expect roof / HVAC / electrical / plumbing capex.
Questions for the listing agent
- Built in 1930 — when were the roof, HVAC, electrical panel, plumbing, and water heater last replaced?
- Is there a deadline driving the sale (1031 exchange, divorce, estate, relocation)? That informs how much negotiation room exists.
- The area grade is low — what's the realistic commute time and amenity access for the typical tenant pool here? Any planned neighborhood developments (good or bad) we should know about?
- What's the average days-on-market for RENTAL listings here right now (not sales)? A rising rental-DOM trend means longer vacancies and softer asking-rent achievability than the comps imply.
- What's the recent tenant-quality profile in this submarket — average credit score on applications, eviction rate, late-payment / NSF rate, and stable-employment percentage? A property-management company in the area should have these aggregated.
- How much new for-sale + rental construction is in the pipeline within 1–3 miles? Heavy new supply typically softens prices + rents 12–24 months out; constrained supply supports both.
Investment metrics
- 1% rule
- 5.54% ✓
- Cap rate
- 50.50%
- Cash-on-cash
- 157.89%
- DSCR
- 8.03
- GRM
- 1.5
CMA / ARV
No comps found within radius.
Projected returns pro-forma
0.45% appreciation · 3.0% rent growth · sell at horizon
- IRR
- —
- Equity multiple
- 9.36×
- Total profit
- $58,487
- Equity at exit
- $7,832
- IRR
- —
- Equity multiple
- 19.64×
- Total profit
- $130,448
- Equity at exit
- $9,884
Cash invested: $7,000 (down + closing). Projections, not guarantees.
Landlord ↔ Tenant lean methodology
- Overall (STATE)
- 62 Landlord-Friendly
- State Pennsylvania
- 62 Landlord-Friendly · EVEN
- County
- — inherits STATE
- City
- — inherits STATE
ZIP-level market 15084
- Home prices YoY
- 0.2%
- Active inventory
- 39
- Price-to-rent
- 1.5×
Monthly cashflow live
- Estimated rent
- $1,385 medium interval (Pro) →
- Mortgage (P&I)
- −$131
- Tax est. 1.5%
- −$31 /mo · $375/yr
- Insurance
- −$10
- HOA
- −$0
- Vacancy / Maint / Mgmt
- −$291
- Net cashflow
- $921
Break-even live
UW: 25.0% down · 7.5% · 30yr · 1.5% tax · 5.0% vac · 8.0% maint · 8.0% mgmt
Financing live
Cash to close
- Down payment
- $6,250
- Closing costs
- $750
- Reserves months
- —
- Total cash needed
- —
Loan-product check · same deal, 3 products live
Conventional
25% down · 7.5% · 30yr
- Down + closing
- —
- Monthly P&I
- —
- Monthly cashflow
- —
- DSCR
- —
- Eligible?
- —
Personal DTI + credit; lowest rate.
DSCR
20% down · 8.5% · 30yr
- Down + closing
- —
- Monthly P&I
- —
- Monthly cashflow
- —
- DSCR
- —
- Eligible?
- —
No personal income docs; deal must DSCR.
Hard money
10% down · 12.0% · 12mo
- Down + closing
- —
- Monthly P&I
- —
- Monthly cashflow
- —
- DSCR
- —
- Eligible?
- —
Short-term bridge; refi at stabilization.
Listing history 4 events
-
2026-04-21status Pending
-
2026-04-17status Active
-
2026-04-02status Pending
-
2026-03-28$25,000 Active
ⓘ Source: listings_history table (triggers on properties + properties_extension) + one-shot
backfill from property_details.listing_events for pre-trigger history.
Climate risk First Street
- Flood 4/10 Moderate FEMA zone X (unshaded) · 24% chance over 30 yrs
- Wildfire 1/10 Low
- Heat 4/10 Moderate 7 d/yr ≥97°F today · 18 d/yr by 30 yrs out
- Wind 2/10 Low
- Air quality 3/10 Moderate 3 unhealthy d/yr today · 5 by 30 yrs out
Nearby sold comps map
Loading sold comps map…
Walkable amenities ~0.75 mi
Loading nearby amenities…
Taxation est. · year 1
- Rental income
- $16,614
- − Mortgage interest
- −$1,400
- − Property taxes
- −$375
- − Insurance
- −$125
- − Repairs & maintenance
- −$1,329
- − Management
- −$1,329
- − Depreciation
- −$727
- Taxable income
- $11,328
- Est. tax owed @ 24.0%
- −$2,719
- After-tax cash flow
- $8,333/yr
For passive investors: Depreciation is non-cash, so a rental often shows a tax loss while cash-flowing — sheltering income. Rental losses are passive: they offset passive income freely, and up to $25,000/yr can offset ordinary (W-2) income if you actively participate and your MAGI is under $100k (phasing out to $0 by $150k); unused losses carry forward. On sale, claimed depreciation is recaptured at up to 25%, and gains may owe capital-gains tax (a 1031 exchange can defer both). Figures are a year-1 estimate at your 24.0% rate — not tax advice; consult a CPA.
Schools (NCES district)
- District
- Highlands SD
- NCES district ID
- 4211880
- Math proficiency
- 29% ▼ -9.00%
- Reading proficiency
- 48% ▼ -9.00%
- Median HH income
- $43,730
- Composite
- 32.58/100
- National rank
- #5679
- State rank
- #376 of 539 in PA
Livability — Tarentum
- Score
- 79/100
- State rank
- #240
- US rank
- #2066
Category grades
Schools grade is shown separately in the Schools card above.
Census & demographics
- Population (ZIP)
- 9,884
Population outlook (Allegheny County) Hauer SSP2
- Today (2025)
- 1,250,282 people
- By 2030
- 1,256,482 · +0.5%
- By 2040
- 1,256,318 · +0.5%
- By 2050
- 1,244,169 · -0.5%
- By 2075
- 1,197,693 · -4.2%
- By 2100
- 1,093,187 · -12.6%
Race, ethnicity, and origin ACS 2023
- Neighborhood character
- Predominantly White (92%)
- Race & ethnicity
- White 92% Two or more races 4% Black 3% Hispanic / Latino 1%
- Common ancestry
- Romanian 14% Lithuanian 2% Serbian 2%
- Foreign-born
- 1%
- Languages at home
- 98% English-only · French/Haitian/Cajun 1%
Political lean MEDSL · Allegheny
- 2024 margin
- Strong D (+20.3) · D 59.7% · R 39.4%
- 2008→2024 swing
- +4.8pp toward D · 2008: 15.5pp · 2024: 20.3pp
- All cycles
- 2024: D+20.3 2020: D+20.4 2016: D+16.4 2012: D+14.4 2008: D+15.5
Not yet ingested
- Civics
- —
Market trends
- HPI YoY
- ▲ 0.45%
- Current HPI
- 230.7532
- Rent YoY
- —
- Metro
- —
- State GDP YoY
- ▲ 1.68%
- F500 in state
- 34
Industry mix (Fortune 500 HQ in PA)
| Industry | F500 HQs | Revenue |
|---|---|---|
| Healthcare | 2 | $309B |
|
||
| Insurance | 2 | $27B |
|
||
| Telecommunications / Media | 1 | $124B |
|
||
| Industrial Distribution | 1 | $22B |
|
||
| Financial Services | 1 | $20B |
|
||
| Chemicals / Materials | 1 | $18B |
|
||
Price history
4 events — show timeline
- 2026-04-21 Pending — West Penn MLS
- 2026-04-17 Relisted — West Penn MLS
- 2026-04-02 Pending — West Penn MLS
- 2026-03-28 Listed $25,000 West Penn MLS
Property tax history
+0.8%/yrLatest (2026): $2,003 · +0.0% YoY. Source: county tax records.
Cash-flow waterfall
monthlySold comps — $/sqft
last 12 mo · ≤1 miLoading sold comps…