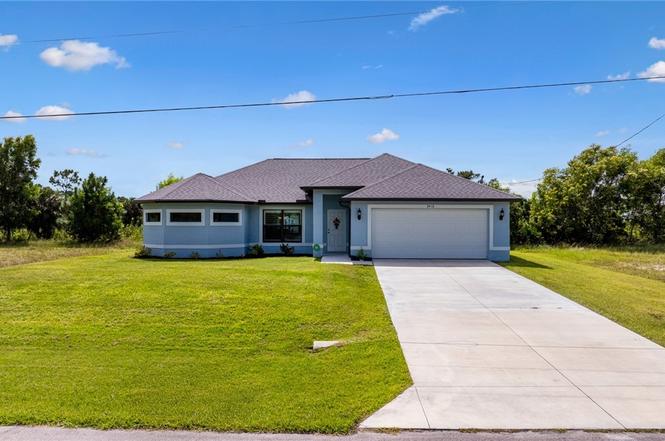
3410 NW 45th St · Cape Coral, FL
Flood risk 8/10 · Major
- FEMA flood zone
- AE
- Chance of flooding over 30 yrs
- 0.99%
- Est. flood insurance / yr
- $1,737 – $8,500
Fire risk 4/10 · Minor
- Est. fire insurance / yr
- $947 – $1,759
Heat risk 10/10 · Severe
- Hot days now (above 107°F)
- 7 days/yr
- Hot days in 30 yrs
- 29 days/yr
Wind risk 10/10 · Severe
- Chance of severe wind over 30 yrs
- 99.0%
Air-quality risk 2/10 · Minimal
- Unhealthy air days now
- 1 days/yr
- Unhealthy air days in 30 yrs
- 1 days/yr
Risk factors via First Street. Map © Google.
Why this score? — see what drove the F grade
The composite is a weighted blend of 9 inputs, each scored 0–100. Each bar is that input's sub-score; the figure is the points it added to the 100-point composite (weight × sub-score).
- Cash flow +12.4/30.0
- Schools +4.1/10.0
- Livability +3.9/5.0
- DSCR +3.7/10.0
- 1% rule +3.6/10.0
- Condition / age +2.5/5.0
- Rent growth +1.1/5.0
- ARV discount +0.0/15.0
- Appreciation +0.0/10.0
$345,875
🖨 Deal sheet 📄 Offer letter ✓ Due diligence
Listing remarks MLS
Located on the Dewberry Canal this waterfront property is perfect for fishing from your own back yard or slip a boat into the water and enjoy the connected canals and Lake areas. This property is close to shopping, schools, The Coral Oaks Golf Course, boating, The Burnt Store Marina, and everything else that makes living in the Cape great.
Key facts
- Seawall in place
- Great room concept
- Waterfront canal
Tags
Property features AI
Finance
- Financial info: Pets allowed
- HOA & community: Non-gated community; No association fee listed
Exterior
- Parking: Attached garage; 2 garage spaces; Driveway; Paved; Garage door opener
- Security: Smoke detectors
- Utilities: Well water; Septic tank; Cable available
- Home design: Single-story; Entry level: 1; Faces north; Resale property; Has view
- Construction: Block, concrete, and stucco construction; Shingle roof; Well (water source)
- Exterior features: Lanai; Screened porch; Porch; Seawall; Room for pool; Shutters (manual); Sprinkler/irrigation; Oversized lot; Automatic sprinklers; South exposure; Public maintained paved road
Interior
- Kitchen: Dishwasher; Range; Self-cleaning oven; Microwave; Refrigerator; Freezer; Kitchen island; Water purifier; Breakfast bar
- Bedrooms: Bedroom on main level
- Flooring: Carpet; Tile
- Bathrooms: 2 full bathrooms; Dual sinks; Separate shower; Bathtub
- Heating & cooling: Central heating (electric); Central air conditioning (electric); Ceiling fans
- Interior features: Breakfast bar; Tray ceilings; Living/dining room; Split bedroom layout; Window treatments; Separate shower; Bathtub; Dual sinks; Kitchen island; Walk-in closets; Bedroom on main level
- Laundry & utility: Washer; Dryer; Inside laundry
Neighborhood map
What this means for you Summary
Snapshot
- This is a 3-bed/2.0-bath single-family listed at $346k.
Deal economics
- At list price, monthly cash flow is $-483 ($-6k/yr) — negative.
- To cash-flow at today's rent, offer at most $261k (24.7% below list).
- To meet the 1% rule (rent ≥ 1% of price), the offer needs to be $297k (14.2% below list).
- Recommended offer: $261k (24.7% below list) — sets the bar for cash-flow.
- Cap rate 6.1% vs local median 3.1% in Cape Coral — top-decile yield for the area; either an underpriced asset or a hidden risk that comps aren't pricing in. Stress-test before assuming the spread holds.
Location & tenants
- Location reads 77/100 on livability (#208 in FL, #3,098 nationally) — a middle-class / working-renter tenant base. Strengths: housing A+, health & safety A+, amenities B+; Watch: commute F.
- Lee (suburban): math 47% / reading 50% proficiency, ranked #42 of 73 in FL (top 58%) — families likely to look elsewhere, expect single-tenant / working-renter base with shorter leases.
- Market conditions: Rents falling (-5.5%/yr); 2652 active listings in the ZIP; 17 comparable units currently listed for rent nearby; rentals at typical pace (median 24d on market — plan ~3-4 weeks tenant-placement turnaround); solid renter incomes; 15,411 units permitted in Lee County in 2024 (4,686 in 5+ unit buildings).
- This rent runs 39% of the median local income ($91k/yr) — at the standard rent-burdened threshold; future hikes will face affordability resistance.
Forward outlook
- Local home prices are declining (-3.0%/yr); year-one equity from $2k of loan paydown is wiped out by about $10k of value loss. Plan a longer hold.
- Lee County population projected at +44% by 2050 — long-run rental-demand tailwind backs the buy-and-hold thesis.
Negotiation context
- It's been on market 232 days — a 12% lower offer ($304k) is reasonable based on typical stale-listing flexibility.
- 5 sale attempts since 7y ago; this cycle's ask has dropped $39k (10%) from the opening price — seller is motivated, your offer sets the floor, not the list.
- Current owner paid $9k; list at $346k implies a 3876% gain — meaningful room to come down on a strong offer.
Risks & watch-outs
- Watch-outs: flood insurance adds $427/mo.
- Climate carrying-cost: in FEMA flood zone AE (mandatory federal flood insurance); severe wind risk, 99% chance of damaging wind over 30y; extreme-heat days projected 7→29/yr by 2055 (HVAC capex compounding) — expect insurance premiums to compound above CPI over the hold.
Questions for the listing agent
- What do current leases actually rent for vs. the listed asking? Can we see a recent rent roll and the last 12 months of T-12 income?
- It's been on market 232 days. Have you received any prior offers? Is the seller open to a 25% concession, seller financing, or rate buy-down credit?
- What's the actual annual flood-insurance premium (NFIP or private), and is the property in a SFHA with mandatory coverage?
- Why hasn't it sold? Are there any deal-killer items the seller is aware of (foundation, flood, title, zoning, code violations)?
- Is there a deadline driving the sale (1031 exchange, divorce, estate, relocation)? That informs how much negotiation room exists.
- Schools are B-rated — typically a magnet for longer-tenancy family renters. What's the average tenant stay here, and is there a school-zone premium baked into asking?
- The area grade is low — what's the realistic commute time and amenity access for the typical tenant pool here? Any planned neighborhood developments (good or bad) we should know about?
- What's the average days-on-market for RENTAL listings here right now (not sales)? A rising rental-DOM trend means longer vacancies and softer asking-rent achievability than the comps imply.
- What's the recent tenant-quality profile in this submarket — average credit score on applications, eviction rate, late-payment / NSF rate, and stable-employment percentage? A property-management company in the area should have these aggregated.
- How much new for-sale + rental construction is in the pipeline within 1–3 miles? Heavy new supply typically softens prices + rents 12–24 months out; constrained supply supports both.
Investment metrics
- 1% rule
- 0.86% ✗
- Cap rate
- 6.10%
- Cash-on-cash
- -0.70%
- DSCR
- 0.97
- GRM
- 9.7
CMA / ARV
- ARV (on-the-fly)
- $295,362
- Comps found
- 3
Show comp detail 3 sales within ~0.75 mi
| Address | Dist | Beds/Ba | Sqft | Sold | Price | $/sf | Match |
|---|---|---|---|---|---|---|---|
| 4318 NW 38th Pl | 0.52mi | 4/2.0 (+1) | 1,818 (+13%) | 14mo | $312,990 | $172 | 38 |
| 3715 NW 41st Ln | 0.66mi | 4/2.0 (+1) | 1,830 (+13%) | 10mo | $335,000 | $183 | 33 |
| 4751 NW 39th Ave | 0.65mi | 4/2.0 (+1) | 1,830 (+13%) | 24mo | $414,900 | $227 | 22 |
Match score weights: distance 35% · size 25% · config 20% · recency 20%. Top-matched comps best support the ARV.
Projected returns pro-forma
-3.0% appreciation · 0.0% rent growth · sell at horizon
- IRR
- -30.6%
- Equity multiple
- 0.02×
- Total profit
- $-95,205
- Equity at exit
- $51,571
- IRR
- -58.8%
- Equity multiple
- -0.60×
- Total profit
- $-154,874
- Equity at exit
- $29,905
Cash invested: $96,845 (down + closing). Projections, not guarantees.
Landlord ↔ Tenant lean methodology
- Overall (STATE)
- 87 Strongly Landlord-Friendly
- State Florida
- 87 Strongly Landlord-Friendly · R+3
- County
- — inherits STATE
- City
- — inherits STATE
ZIP-level market 33993
- Home prices YoY
- -14.1%
- Rents YoY
- -5.5%
- Active inventory
- 2652
- Price-to-rent
- 9.7×
Monthly cashflow live
- Estimated rent
- $2,969 high interval (Pro) →
- Mortgage (P&I)
- −$1,814
- Tax from tax record
- −$444 /mo · $5,327/yr
- Insurance
- −$144
- Flood insurance flood zone
- −$427 /mo · $5,118/yr
- HOA
- −$0
- Vacancy / Maint / Mgmt
- −$623
- Net cashflow
- $-483
Break-even live
UW: 25.0% down · 7.5% · 30yr · 1.5% tax · 5.0% vac · 8.0% maint · 8.0% mgmt
Financing live
Cash to close
- Down payment
- $86,469
- Closing costs
- $10,376
- Reserves months
- —
- Total cash needed
- —
Loan-product check · same deal, 3 products live
Conventional
25% down · 7.5% · 30yr
- Down + closing
- —
- Monthly P&I
- —
- Monthly cashflow
- —
- DSCR
- —
- Eligible?
- —
Personal DTI + credit; lowest rate.
DSCR
20% down · 8.5% · 30yr
- Down + closing
- —
- Monthly P&I
- —
- Monthly cashflow
- —
- DSCR
- —
- Eligible?
- —
No personal income docs; deal must DSCR.
Hard money
10% down · 12.0% · 12mo
- Down + closing
- —
- Monthly P&I
- —
- Monthly cashflow
- —
- DSCR
- —
- Eligible?
- —
Short-term bridge; refi at stabilization.
Rent comps 17 comps
| Address | Beds | Baths | Sqft | Rent | $/sqft | DOM | Units | Dist |
|---|---|---|---|---|---|---|---|---|
| 4157 NW 39th Ave Cape Coral, FL | 3.0 | 2.0 | 1515 | $2,500 | $1.65 | 23d | 1 | 0.65mi |
| 4157 NW 39th Ave Cape Coral, FL | 3.0 | 2.0 | 1515 | $2,500 | $1.65 | 3d | 1 | 0.65mi |
| 3929 NW 42nd Ln Cape Coral, FL | 3.0 | 2.0 | 1333 | $1,995 | $1.50 | 23d | 1 | 0.71mi |
| 3911 NW 40th Ln Cape Coral, FL | 3.0 | 2.0 | 1363 | $3,500 | $2.57 | 23d | 1 | 0.89mi |
| 3617 NW 38th Ter Cape Coral, FL | 4.0 | 3.0 | 1903 | $2,200 | $1.16 | 23d | 1 | 1.11mi |
| 1010 Islamorada Blvd Punta Gorda, FL | 3.0 | 2.0 | 1592 | $4,700 | $2.95 | 23d | 1 | 1.21mi |
| 17947 Courtside Landings Cir Punta Gorda, FL | 3.0 | 2.0 | 1338 | $5,500 | $4.11 | 23d | 1 | 1.24mi |
| 1001 Islamorada Blvd Unit 12A Punta Gorda, FL | 2.0 | 2.0 | 1365 | $1,600 | $1.17 | 15d | 1 | 1.27mi |
| 3812 NW 38th St Cape Coral, FL | 3.0 | 2.0 | 1920 | $2,600 | $1.35 | 23d | 1 | 1.27mi |
| 3191 Matecumbe Key Rd #206 Punta Gorda, FL | 2.0 | 2.0 | 1102 | $4,400 | $3.99 | 23d | 1 | 1.29mi |
| 3181 Matecumbe Key Rd Punta Gorda, FL | 2.0 | 2.0 | 1254 | $2,450 | $1.95 | 23d | 2 | 1.32mi |
| 5 Pirates Ln Unit 54B Punta Gorda, FL | 2.0 | 2.0 | 1516 | $4,600 | $3.03 | 23d | 1 | 1.32mi |
| 3170 Matecumbe Key Rd #134 Punta Gorda, FL | 2.0 | 2.0 | 1188 | $1,899 | $1.60 | 23d | 1 | 1.34mi |
| 1610 Islamorada Blvd Unit 64A Punta Gorda, FL | 2.0 | 2.0 | 1516 | $2,000 | $1.32 | 23d | 1 | 1.38mi |
| 2091 King Tarpon Dr Punta Gorda, FL | 3.0 | 2.0 | 1640 | $5,200 | $3.17 | 23d | 1 | 1.41mi |
| 3001 King Tarpon Dr Punta Gorda, FL | 3.0 | 2.0 | 1734 | $5,500 | $3.17 | 23d | 1 | 1.42mi |
| 3020 Matecumbe Key Rd #103 Punta Gorda, FL | 2.0 | 2.0 | 1148 | $5,200 | $4.53 | 23d | 1 | 1.49mi |
Listing history 23 events
-
2026-06-17days on market $345,875 Active 232 DOM
-
2026-06-16days on market $345,875 Active 231 DOM
-
2026-06-16days on market $345,875 Active 230 DOM
-
2026-06-13days on market $345,875 Active 228 DOM
-
2026-06-09days on market $345,875 Active 224 DOM
-
2026-06-07days on market $345,875 Active 222 DOM
-
2026-06-02days on market $345,875 Active 217 DOM
-
2026-06-01days on market $345,875 Active 216 DOM
-
2026-06-01days on market $345,875 Active 215 DOM
-
2026-02-21price $345,875
-
2025-11-19price $360,000
-
2025-10-28$384,900 Active
-
2021-01-05soldstatus $8,700
-
2020-12-14soldstatus $10,000 Closed 341-char remark
Show marketing remark (341 chars)
Located on the Dewberry Canal this waterfront property is perfect for fishing from your own back yard or slip a boat into the water and enjoy the connected canals and Lake areas. This property is close to shopping, schools, The Coral Oaks Golf Course, boating, The Burnt Store Marina, and everything else that makes living in the Cape great.
-
2020-11-06status Pending 341-char remark
Show marketing remark (341 chars)
Located on the Dewberry Canal this waterfront property is perfect for fishing from your own back yard or slip a boat into the water and enjoy the connected canals and Lake areas. This property is close to shopping, schools, The Coral Oaks Golf Course, boating, The Burnt Store Marina, and everything else that makes living in the Cape great.
-
2020-10-04status Active 341-char remark
Show marketing remark (341 chars)
Located on the Dewberry Canal this waterfront property is perfect for fishing from your own back yard or slip a boat into the water and enjoy the connected canals and Lake areas. This property is close to shopping, schools, The Coral Oaks Golf Course, boating, The Burnt Store Marina, and everything else that makes living in the Cape great.
-
2020-09-30historical 341-char remark
Show marketing remark (341 chars)
Located on the Dewberry Canal this waterfront property is perfect for fishing from your own back yard or slip a boat into the water and enjoy the connected canals and Lake areas. This property is close to shopping, schools, The Coral Oaks Golf Course, boating, The Burnt Store Marina, and everything else that makes living in the Cape great.
-
2019-11-14status Active 341-char remark
Show marketing remark (341 chars)
Located on the Dewberry Canal this waterfront property is perfect for fishing from your own back yard or slip a boat into the water and enjoy the connected canals and Lake areas. This property is close to shopping, schools, The Coral Oaks Golf Course, boating, The Burnt Store Marina, and everything else that makes living in the Cape great.
-
2019-11-08historical 341-char remark
Show marketing remark (341 chars)
Located on the Dewberry Canal this waterfront property is perfect for fishing from your own back yard or slip a boat into the water and enjoy the connected canals and Lake areas. This property is close to shopping, schools, The Coral Oaks Golf Course, boating, The Burnt Store Marina, and everything else that makes living in the Cape great.
-
2019-11-05status Active 341-char remark
Show marketing remark (341 chars)
Located on the Dewberry Canal this waterfront property is perfect for fishing from your own back yard or slip a boat into the water and enjoy the connected canals and Lake areas. This property is close to shopping, schools, The Coral Oaks Golf Course, boating, The Burnt Store Marina, and everything else that makes living in the Cape great.
-
2019-11-02historical 341-char remark
Show marketing remark (341 chars)
Located on the Dewberry Canal this waterfront property is perfect for fishing from your own back yard or slip a boat into the water and enjoy the connected canals and Lake areas. This property is close to shopping, schools, The Coral Oaks Golf Course, boating, The Burnt Store Marina, and everything else that makes living in the Cape great.
-
2019-09-27$10,000 Active 341-char remark
Show marketing remark (341 chars)
Located on the Dewberry Canal this waterfront property is perfect for fishing from your own back yard or slip a boat into the water and enjoy the connected canals and Lake areas. This property is close to shopping, schools, The Coral Oaks Golf Course, boating, The Burnt Store Marina, and everything else that makes living in the Cape great.
-
1982-07-01soldstatus $5,900
ⓘ Source: listings_history table (triggers on properties + properties_extension) + one-shot
backfill from property_details.listing_events for pre-trigger history.
Tax reassessment forecast FL · Resets to sale price
- Current annual tax
- $5,327 · $444/mo
- Projected year-2 tax
- $5,327 · $444/mo
- Expected delta
- $0/yr ($0/mo · 0.0%)
ⓘ Screening estimate from a state-policy table — verify with the county assessor before closing.
Climate risk First Street
- Flood 8/10 Severe FEMA zone AE · 99% chance over 30 yrs
- Wildfire 4/10 Moderate
- Heat 10/10 Extreme 7 d/yr ≥107°F today · 29 d/yr by 30 yrs out
- Wind 10/10 Extreme 99% chance of damaging wind over 30 yrs
- Air quality 2/10 Low 1 unhealthy d/yr today · 1 by 30 yrs out
Nearby sold comps map
Loading sold comps map…
Walkable amenities ~0.75 mi
Loading nearby amenities…
Taxation est. · year 1
- Rental income
- $35,623
- − Mortgage interest
- −$19,374
- − Property taxes
- −$5,327
- − Insurance
- −$6,848
- − Repairs & maintenance
- −$2,850
- − Management
- −$2,850
- − Depreciation
- −$10,062
- Taxable loss
- −$11,687
- Est. tax savings @ 24.0%
- +$2,805
- After-tax cash flow
- $-2,993/yr
For passive investors: Depreciation is non-cash, so a rental often shows a tax loss while cash-flowing — sheltering income. Rental losses are passive: they offset passive income freely, and up to $25,000/yr can offset ordinary (W-2) income if you actively participate and your MAGI is under $100k (phasing out to $0 by $150k); unused losses carry forward. On sale, claimed depreciation is recaptured at up to 25%, and gains may owe capital-gains tax (a 1031 exchange can defer both). Figures are a year-1 estimate at your 24.0% rate — not tax advice; consult a CPA.
Schools (NCES district)
- District
- Lee
- NCES district ID
- 1201080
- Math proficiency
- 47% ▼ -11.00%
- Reading proficiency
- 50% ▼ -4.00%
- Median HH income
- $49,518
- Composite
- 41.49/100
- National rank
- #3458
- State rank
- #42 of 73 in FL
Livability — Cape Coral
- Score
- 77/100
- State rank
- #208
- US rank
- #3098
Category grades
Schools grade is shown separately in the Schools card above.
Census & demographics
- Census place
- Cape Coral, FL
- County
- Lee County · 788,662 people
- City population
- 217,388
- Metro
- Cape Coral-Fort Myers, FL
- Population (ZIP)
- 35,580
- Household income
- $90,577
- Rent vs Own
- Severe rent burden
- 286.0
Population outlook (Lee County) Hauer SSP2
- Today (2025)
- 871,946 people
- By 2030
- 955,468 · +9.6%
- By 2040
- 1,113,587 · +27.7%
- By 2050
- 1,256,891 · +44.1%
- By 2075
- 1,560,270 · +78.9%
- By 2100
- 1,726,848 · +98.0%
Race, ethnicity, and origin ACS 2023
- Neighborhood character
- Diverse neighborhood (Simpson 0.58)
- Race & ethnicity
- White 57% Hispanic / Latino 30% Two or more races 21% Black 7% Asian 2%
- Hispanic origin (detail)
- Mexican 2% Puerto Rican 6% Cuban 17% Dominican 1%
- Common ancestry
- Romanian 2% Hispanic 2% Lithuanian 2%
- Foreign-born
- 21% · Canada, Jamaica, China
- Languages at home
- 73% English-only · Spanish 24% French/Haitian/Cajun 1% Russian/Polish/Slavic 1%
Political lean MEDSL · Lee
- 2024 margin
- Strong R (+28.4) · D 35.5% · R 63.9%
- 2008→2024 swing
- -18.0pp toward R · 2008: -10.4pp · 2024: -28.4pp
- All cycles
- 2024: R+28.4 2020: R+19.2 2016: R+20.4 2012: R+16.6 2008: R+10.4
Not yet ingested
- Civics
- —
Market trends
- HPI YoY
- ▼ -55.34%
- Current HPI
- 337.0575
- Rent YoY
- ▼ -5.51%
- Metro
- Cape Coral-Fort Myers, FL
- State GDP YoY
- ▲ 3.28%
- F500 in state
- 36
Industry mix (Fortune 500 HQ in FL)
| Industry | F500 HQs | Revenue |
|---|---|---|
| Industrial Technology | 2 | $29B |
|
||
| Insurance | 2 | $17B |
|
||
| Retail | 1 | $60B |
|
||
| Technology Distribution | 1 | $58B |
|
||
| Homebuilding | 1 | $35B |
|
||
| Technology Manufacturing | 1 | $35B |
|
||
Price history
+5762.3% since first listed14 events — show timeline
- 2026-02-21 Price Changed $345,875 FORTMLS
- 2025-11-19 Price Changed $360,000 FORTMLS
- 2025-10-28 Listed $384,900 FORTMLS
- 2021-01-05 Sold (Public Records) $8,700 Public Records
- 2020-12-14 Sold (MLS) $10,000 FORTMLS
- 2020-11-06 Pending — FORTMLS
- 2020-10-04 Relisted — FORTMLS
- 2020-09-30 Listing Removed — FORTMLS
- 2019-11-14 Relisted — FORTMLS
- 2019-11-08 Listing Removed — FORTMLS
- 2019-11-05 Relisted — FORTMLS
- 2019-11-02 Listing Removed — FORTMLS
- 2019-09-27 Listed $10,000 FORTMLS
- 1982-07-01 Sold (Public Records) $5,900 Public Records
Property tax history
+29.9%/yrLatest (2025): $5,327 · +5.1% YoY. Source: county tax records.
Cash-flow waterfall
monthlySold comps — $/sqft
last 12 mo · ≤1 miLoading sold comps…