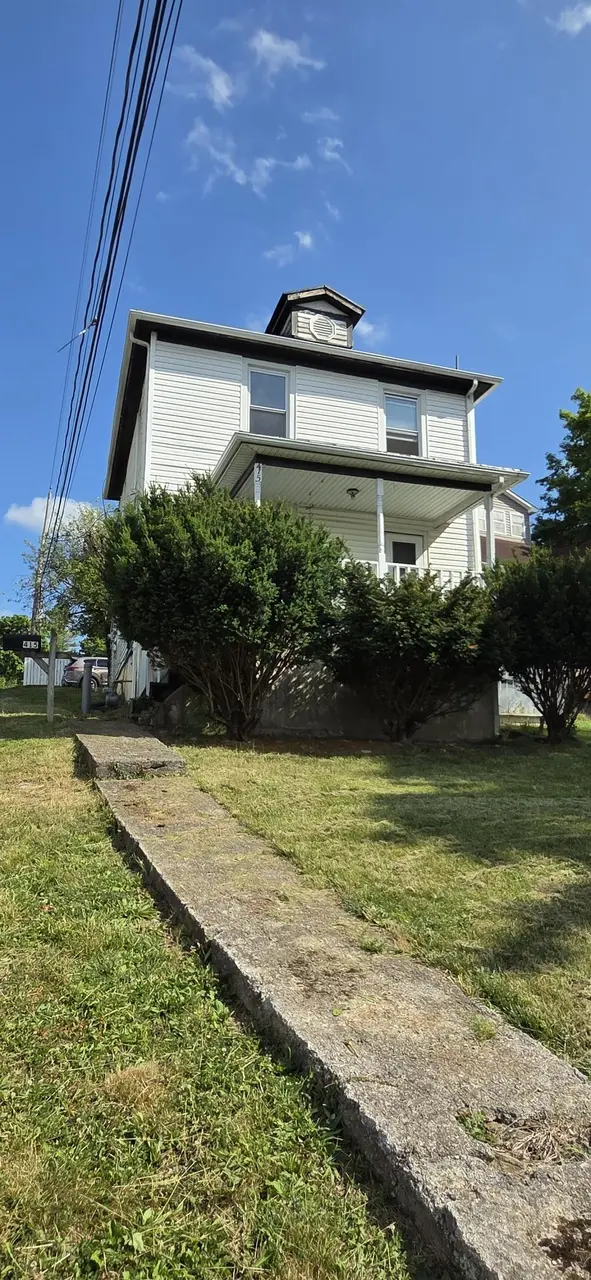
415 N Randolph St · Lexington, VA
Flood risk 1/10 · Minimal
- FEMA flood zone
- X (unshaded)
- Chance of flooding over 30 yrs
- 0.0%
- Est. flood insurance / yr
- $473 – $860
Fire risk 3/10 · Minor
- Est. fire insurance / yr
- $666 – $1,236
Heat risk 6/10 · Moderate
- Hot days now (above 102°F)
- 7 days/yr
- Hot days in 30 yrs
- 19 days/yr
Wind risk 2/10 · Minimal
- Chance of severe wind over 30 yrs
- 1.0%
Air-quality risk 1/10 · Minimal
- Unhealthy air days now
- 0 days/yr
- Unhealthy air days in 30 yrs
- 0 days/yr
Risk factors via First Street. Map © Google.
Why this score? — see what drove the C- grade
The composite is a weighted blend of 9 inputs, each scored 0–100. Each bar is that input's sub-score; the figure is the points it added to the 100-point composite (weight × sub-score).
- Cash flow +14.3/30.0
- ARV discount +13.2/15.0
- Schools +7.1/10.0
- DSCR +4.3/10.0
- Livability +4.0/5.0
- 1% rule +3.0/10.0
- Rent growth +2.5/5.0
- Condition / age +2.5/5.0
- Appreciation +0.0/10.0
$235,000
🖨 Deal sheet (PDF) 📄 Offer letter ✓ Due diligence
Listing remarks
Property sold in ''AS IS/Where IS'' condition. Prime Lexington location with spectacular VMI Football Stadium views! Don't miss this unique opportunity to own a home in the heart of downtown Lexington, so close you can enjoy game-day excitement right from your own front porch. Host friends, tailgate at home, and cheer on the Keydets without ever leaving your property! This classic home features 3 bedrooms, 2 full bathrooms, living room, dining room, kitchen, and off street parking. Outdoor living spaces abound with spacious open front porch overlooking the stadium, rear screened porch for relaxing and entertaining, and second-floor rear porch offering additional outdoor enjoyment. The prope
Key facts
- Off street parking
- Open front porch
- Downtown lexington
Tags
Property features AI
Exterior
- Utilities: Public water; Public sewer
- Home design: Single-family residential; Residential zoning; Corner lot
- Construction: Vinyl siding; Metal roof
- Exterior features: Balcony; Porch (screened)
Interior
- Flooring: Vinyl flooring; Wood flooring
- Bathrooms: 2 full bathrooms
- Heating & cooling: Natural gas heating; Baseboard heating; Electric heating; Ceiling fans; No central air
- Interior features: Electric water heater; Crawl space basement
Neighborhood map
What this means for you Summary
Snapshot
- This is a 3-bed/2.0-bath single-family listed at $235k.
Deal economics
- At list price, monthly cash flow is $41 ($495/yr) — positive.
- The deal already cash-flows at list — no discount required.
- To meet the 1% rule (rent ≥ 1% of price), the offer needs to be $187k (20.5% below list).
- Recommended offer: $187k (20.5% below list) — sets the bar for 1% rule.
- Cap rate 6.5% vs local median 3.3% in Lexington — top-decile yield for the area; either an underpriced asset or a hidden risk that comps aren't pricing in. Stress-test before assuming the spread holds.
Location & tenants
- Location reads 80/100 on livability (#62 in VA, #1,813 nationally) — a professional / high-income tenant draw. Strengths: crime A+, amenities A+, health & safety A+; Watch: commute F.
- Lexington City Public School District (town): math 82% / reading 88% proficiency, ranked #4 of 131 in VA (top 3%) — strong family-tenant draw, lease renewals of 3-5y typical; only 18% free/reduced lunch — higher-income household profile.
- Zoned schools: Harrington Waddell Elementary (math 82% / reading 87%, grade A+, #71 of 1,108 statewide, top 8%, 324 students, 32% FRL); Lylburn Downing Middle (math 82% / reading 87%, grade A+, #14 of 342 statewide, top 4%, 161 students, 26% FRL).
- Market conditions: 148 active listings in the ZIP; 3 comparable units currently listed for rent nearby; rentals at typical pace (median 17d on market — plan ~3-4 weeks tenant-placement turnaround); solid renter incomes; 1 units permitted in Lexington city in 2024 (0 in 5+ unit buildings).
Forward outlook
- Local home prices are declining (-3.0%/yr); year-one equity from $2k of loan paydown is wiped out by about $7k of value loss. Plan a longer hold.
- Lexington County population projected at +17% by 2050 — long-run rental-demand tailwind backs the buy-and-hold thesis.
Negotiation context
- Only 4 days on market — expect competitive offers; lowballing is unlikely to land.
Risks & watch-outs
- Watch-outs: built in 1922 — expect roof / HVAC / electrical / plumbing capex.
- Climate carrying-cost: extreme-heat days projected 7→19/yr by 2055 (HVAC capex compounding) — expect insurance premiums to compound above CPI over the hold.
Questions for the listing agent
- Built in 1922 — when were the roof, HVAC, electrical panel, plumbing, and water heater last replaced?
- Is there a deadline driving the sale (1031 exchange, divorce, estate, relocation)? That informs how much negotiation room exists.
- Schools are A-rated — typically a magnet for longer-tenancy family renters. What's the average tenant stay here, and is there a school-zone premium baked into asking?
- What's the average days-on-market for RENTAL listings here right now (not sales)? A rising rental-DOM trend means longer vacancies and softer asking-rent achievability than the comps imply.
- What's the recent tenant-quality profile in this submarket — average credit score on applications, eviction rate, late-payment / NSF rate, and stable-employment percentage? A property-management company in the area should have these aggregated.
- How much new for-sale + rental construction is in the pipeline within 1–3 miles? Heavy new supply typically softens prices + rents 12–24 months out; constrained supply supports both.
Investment metrics
- 1% rule
- 0.80% ✗
- Cap rate
- 6.50%
- Cash-on-cash
- 0.75%
- DSCR
- 1.03
- GRM
- 10.5
CMA / ARV
- ARV (on-the-fly)
- $269,400
- Comps found
- 11
Show comp detail 11 sales within ~0.75 mi
| Address | Dist | Beds/Ba | Sqft | Sold | Price | $/sf | Match |
|---|---|---|---|---|---|---|---|
| 224 N Randolph St | 0.10mi | 4/1.0 (+1) | 1,300 (-4%) | 8mo | $170,000 | $131 | 74 |
| 308 Massie St | 0.26mi | 3/2.0 | 1,478 (+10%) | 5mo | $281,000 | $190 | 68 |
| 110 E Mcdowell St | 0.64mi | 3/1.0 | 1,377 (+2%) | 1mo | $275,000 | $200 | 62 |
| 704 Mccorkle Dr | 0.38mi | 2/2.0 (-1) | 1,365 (+1%) | 16mo | $241,000 | $177 | 62 |
| 320 N Lewis St | 0.27mi | 3/2.5 | 1,462 (+8%) | 13mo | $385,000 | $263 | 61 |
| 412 Morningside Dr | 0.39mi | 3/1.5 | 1,442 (+7%) | 12mo | $250,000 | $173 | 58 |
| 15 Poyntz Place Pl | 0.38mi | 3/2.0 | 1,408 (+4%) | 20mo | $345,000 | $245 | 58 |
| 407 Morningside Dr | 0.39mi | 3/2.0 | 1,240 (-8%) | 14mo | $350,000 | $282 | 57 |
| 415 Wills Rd | 0.39mi | 3/2.5 | 1,471 (+9%) | 16mo | $330,000 | $224 | 51 |
| 207 S Jefferson St | 0.65mi | 2/1.0 (-1) | 1,230 (-9%) | 14mo | $344,150 | $280 | 34 |
| 61 Old Buena Vista Rd | 0.72mi | 3/2.0 | 1,482 (+10%) | 21mo | $297,000 | $200 | 32 |
Match score weights: distance 35% · size 25% · config 20% · recency 20%. Top-matched comps best support the ARV.
Projected returns pro-forma
-3.0% appreciation · 3.0% rent growth · sell at horizon
- IRR
- -15.1%
- Equity multiple
- 0.46×
- Total profit
- $-35,540
- Equity at exit
- $35,039
- IRR
- -6.6%
- Equity multiple
- 0.58×
- Total profit
- $-27,921
- Equity at exit
- $20,319
Cash invested: $65,800 (down + closing). Projections, not guarantees.
Landlord ↔ Tenant lean methodology
- Overall (STATE)
- 55 Moderately Landlord-Leaning
- State Virginia
- 55 Moderately Landlord-Leaning · D+2
- County
- — inherits STATE
- City
- — inherits STATE
ZIP-level market 24450
- Home prices YoY
- -22.8%
- Active inventory
- 148
- Price-to-rent
- 10.5×
Monthly cashflow live
- Estimated rent
- $1,869 medium interval (Pro) →
- Mortgage (P&I)
- −$1,232
- Tax from tax record
- −$105 /mo · $1,259/yr
- Insurance
- −$98
- HOA
- −$0
- Vacancy / Maint / Mgmt
- −$392
- Net cashflow
- $41
Break-even live
Sensitivity live
| Price | -10% $174 | -5% $108 | +0% $41 | +5% $-25 | +10% $-92 |
|---|---|---|---|---|---|
| Rent | -10% $-106 | -5% $-33 | +0% $41 | +5% $115 | +10% $189 |
| Rate | -1.0pp $160 | -0.5pp $101 | base $41 | +0.5pp $-20 | +1.0pp $-82 |
UW: 25.0% down · 7.5% · 30yr · 1.5% tax · 5.0% vac · 8.0% maint · 8.0% mgmt
Financing live
Cash to close
- Down payment
- $58,750
- Closing costs
- $7,050
- Reserves months
- —
- Total cash needed
- —
Loan-product check · same deal, 3 products live
Conventional
25% down · 7.5% · 30yr
- Down + closing
- —
- Monthly P&I
- —
- Monthly cashflow
- —
- DSCR
- —
- Eligible?
- —
Personal DTI + credit; lowest rate.
DSCR
20% down · 8.5% · 30yr
- Down + closing
- —
- Monthly P&I
- —
- Monthly cashflow
- —
- DSCR
- —
- Eligible?
- —
No personal income docs; deal must DSCR.
Hard money
10% down · 12.0% · 12mo
- Down + closing
- —
- Monthly P&I
- —
- Monthly cashflow
- —
- DSCR
- —
- Eligible?
- —
Short-term bridge; refi at stabilization.
Rent comps 3 comps
| Address | Beds | Baths | Sqft | Rent | $/sqft | DOM | Units | Dist |
|---|---|---|---|---|---|---|---|---|
| 3 Jean Francis DR Lexington, VA | 3.0 | 2.0 | 1200 | $2,200 | $1.83 | 16d | 1 | 0.46mi |
| 45 Holly Park Ln #222 Lexington, VA | 2.0 | 2.0 | 1254 | $1,450 | $1.16 | 16d | 1 | 0.62mi |
| 203 Myers St Apt B Lexington, VA | 2.0 | 1.0 | 1000 | $1,400 | $1.40 | 16d | 1 | 0.68mi |
Listing history 3 events
-
2026-06-22days on market $235,000 Active 4 DOM
-
2026-06-17remarks 699-char remark
-
2026-06-17$235,000 Active 1 DOM
ⓘ Source: listings_history table (triggers on properties + properties_extension) + one-shot
backfill from property_details.listing_events for pre-trigger history.
Tax reassessment forecast VA · Resets to sale price
- Current annual tax
- $1,259 · $105/mo
- Projected year-2 tax
- $1,927 · $161/mo
- Expected delta
- +$668/yr (+$56/mo · 53.0%)
ⓘ Screening estimate from a state-policy table — verify with the county assessor before closing.
Climate risk First Street
- Flood 1/10 Low FEMA zone X (unshaded) · 0% chance over 30 yrs
- Wildfire 3/10 Moderate
- Heat 6/10 Major 7 d/yr ≥102°F today · 19 d/yr by 30 yrs out
- Wind 2/10 Low 100% chance of damaging wind over 30 yrs
- Air quality 1/10 Low 0 unhealthy d/yr today · 0 by 30 yrs out
Nearby sold comps map
Loading sold comps map…
Walkable amenities ~0.75 mi
Loading nearby amenities…
Taxation est. · year 1
- Rental income
- $22,428
- − Mortgage interest
- −$13,164
- − Property taxes
- −$1,259
- − Insurance
- −$1,175
- − Repairs & maintenance
- −$1,794
- − Management
- −$1,794
- − Depreciation
- −$6,836
- Taxable loss
- −$3,595
- Est. tax savings @ 24.0%
- +$863
- After-tax cash flow
- $1,358/yr
For passive investors: Depreciation is non-cash, so a rental often shows a tax loss while cash-flowing — sheltering income. Rental losses are passive: they offset passive income freely, and up to $25,000/yr can offset ordinary (W-2) income if you actively participate and your MAGI is under $100k (phasing out to $0 by $150k); unused losses carry forward. On sale, claimed depreciation is recaptured at up to 25%, and gains may owe capital-gains tax (a 1031 exchange can defer both). Figures are a year-1 estimate at your 24.0% rate — not tax advice; consult a CPA.
Schools (NCES district)
- District
- Lexington City Public School District
- NCES district ID
- 5102220
- Math proficiency
- 82% ▼ -9.00%
- Reading proficiency
- 88% ▬ 0.00%
- Median HH income
- $37,249
- Composite
- 70.57/100
- National rank
- #258
- State rank
- #4 of 131 in VA
Livability — Lexington
- Score
- 80/100
- State rank
- #62
- US rank
- #1813
Category grades
Schools grade is shown separately in the Schools card above.
Census & demographics
- Census place
- Lexington, VA
- County
- Rockbridge County · 17,714 people
- City population
- 17,714
- Metro
- nan
- Population (ZIP)
- 17,714
- Household income
- $76,587
- Rent vs Own
- Severe rent burden
- 429.0
Population outlook (Lexington County) Hauer SSP2
- Today (2025)
- 8,814 people
- By 2030
- 9,156 · +3.9%
- By 2040
- 9,636 · +9.3%
- By 2050
- 10,345 · +17.4%
- By 2075
- 12,696 · +44.0%
- By 2100
- 14,268 · +61.9%
Race, ethnicity, and origin ACS 2023
- Neighborhood character
- Predominantly White (86%)
- Race & ethnicity
- White 86% Two or more races 5% Black 4% Hispanic / Latino 3% Asian 2%
- Common ancestry
- Serbian 4% Italian 2% Slovak 2%
- Foreign-born
- 4% · China, Canada, South Korea
- Languages at home
- 95% English-only · Spanish 2% Chinese 1% Korean 1%
Political lean MEDSL · Lexington
- 2024 margin
- Strong D (+26.7) · D 62.7% · R 36.0% · Other 1.3%
- 2008→2024 swing
- +1.3pp toward D · 2008: 25.4pp · 2024: 26.7pp
- All cycles
- 2024: D+26.7 2020: D+32.0 2016: D+30.6 2012: D+12.6 2008: D+25.4
Not yet ingested
- Civics
- —
Market trends
- HPI YoY
- ▼ -83.84%
- Current HPI
- 283.7394
- Rent YoY
- —
- Metro
- nan
- State GDP YoY
- ▲ 2.40%
- F500 in state
- 50
Industry mix (Fortune 500 HQ in VA)
| Industry | F500 HQs | Revenue |
|---|---|---|
| Aerospace / Defense | 4 | $236B |
|
||
| Technology / Defense | 3 | $32B |
|
||
| Financial Services | 2 | $176B |
|
||
| Utilities | 2 | $27B |
|
||
| Insurance | 2 | $25B |
|
||
| Technology | 2 | $15B |
|
||
Price history
1 event — show timeline
- 2026-06-17 Listed $235,000 RHR
Property tax history
+2.8%/yrLatest (2025): $1,259 · +0.0% YoY. Source: county tax records.
Cash-flow waterfall
monthlySold comps — $/sqft
last 12 mo · ≤1 miLoading sold comps…