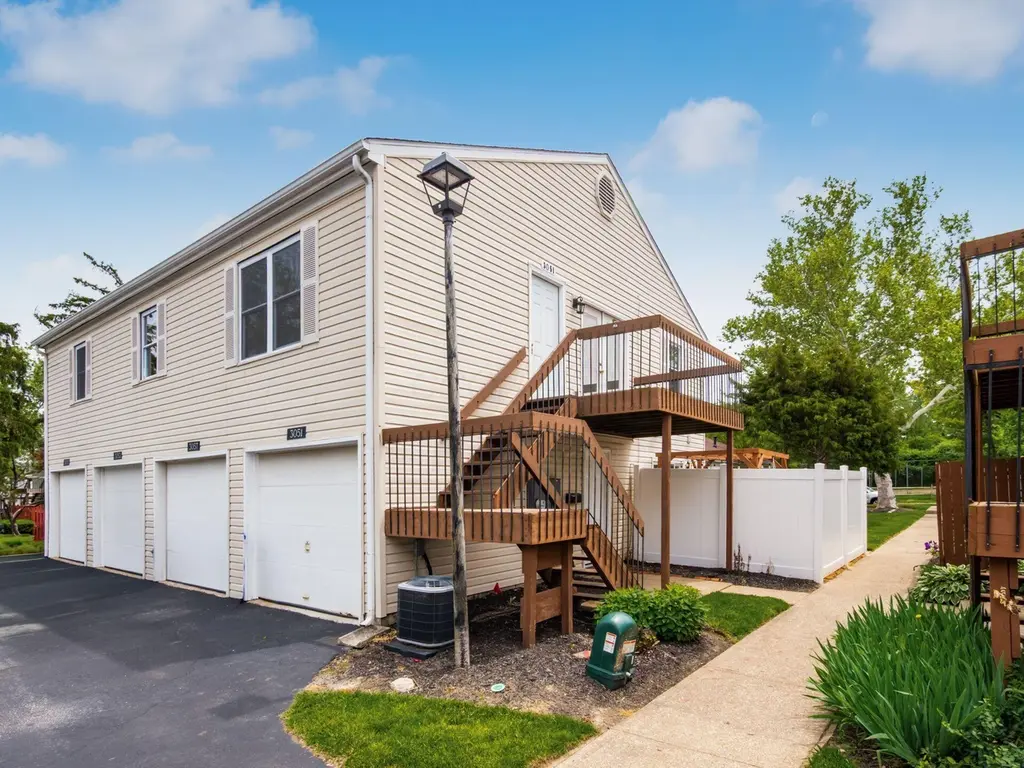
3051 Jersey Dr #61 · Columbus, OH
Flood risk No data
- FEMA flood zone
- —
- Chance of flooding over 30 yrs
- —
- Est. flood insurance / yr
- —
Fire risk No data
- Est. fire insurance / yr
- —
Heat risk No data
- Hot days now (above threshold)
- —
- Hot days in 30 yrs
- —
Wind risk No data
- Chance of severe wind over 30 yrs
- —
Air-quality risk No data
- Unhealthy air days now
- —
- Unhealthy air days in 30 yrs
- —
Risk factors via First Street. Map © Google.
Why this score? — see what drove the D grade
The composite is a weighted blend of 9 inputs, each scored 0–100. Each bar is that input's sub-score; the figure is the points it added to the 100-point composite (weight × sub-score).
- Cash flow +13.1/30.0
- ARV discount +7.5/15.0
- 1% rule +5.9/10.0
- Livability +4.0/5.0
- DSCR +3.9/10.0
- Rent growth +3.6/5.0
- Condition / age +2.5/5.0
- Schools +1.7/10.0
- Appreciation +0.0/10.0
$150,000
🖨 Deal sheet (PDF) 📄 Offer letter ✓ Due diligence
Listing remarks
Located near Downtown Columbus, local restaurants, parks, shopping, and convenient freeway access, this updated condo offers comfortable living with a functional layout. Upon entry, you're welcomed into an open living area featuring a fireplace and abundant natural light. The layout flows into the dining area and kitchen, where the kitchen offers white cabinetry, and ample storage space. This home features three bedrooms and one full bathroom, providing flexibility for guests, family, or home office needs. Neutral finishes and updated flooring throughout create a clean and inviting feel. Outside, enjoy the private deck--perfect for relaxing or entertaining guests. Conveniently located in a
Key facts
- $261 HOA
- Garage
- Built 1974
Property features AI
Finance
- HOA & community: Homeowners association with a monthly fee of $261; Association phone: 614-527-7909
Exterior
- Parking: Attached garage (1-car)
- Utilities: Public water; Public sewer
- Home design: Condominium; Two levels; One common wall; Built in 1974
- Exterior features: Slab foundation
Interior
- Bathrooms: 1 full bathroom
- Interior features: 968 living area
Neighborhood map
What this means for you Summary
Snapshot
- This is a 3-bed/1.0-bath condo listed at $150k.
Deal economics
- At list price, monthly cash flow is $-5 ($-65/yr) — negative.
- To cash-flow at today's rent, offer at most $149k (0.6% below list).
- Meets the 1% rule at list price ($2k rent vs $150k).
- Recommended offer: $146k (3.0% below list) — sets the bar for market timing.
- Cap rate 6.2% vs local median 3.8% in Columbus — top-decile yield for the area; either an underpriced asset or a hidden risk that comps aren't pricing in. Stress-test before assuming the spread holds.
Location & tenants
- Location reads 81/100 on livability (#97 in OH, #1,491 nationally) — a professional / high-income tenant draw. Strengths: commute A+, cost of living A+, housing A+; Watch: employment C-, crime F.
- Columbus City School District (urban): math 15% / reading 26% proficiency, ranked #626 of 656 in OH (top 95%) — low school quality limits family demand, transient renter base, plan for 1-2y turnover; 72% free/reduced lunch — lower-income household profile, screen leases tightly.
- Zoned schools: Indianola Informal K-8 School (math 43% / reading 58%, grade D+, #896 of 1,584 statewide, top 57%, 684 students, 0% FRL); Arts Impact Middle School (Aims) (math 17% / reading 25%, grade F, #608 of 654 statewide, top 93%, 532 students, 0% FRL); West High School (math 2% / reading 17%, grade F, #749 of 781 statewide, top 97%, 837 students, 0% FRL) — zoned schools average 0% FRL vs 72% district-wide (72 pts lower); this property's tenant base skews higher-income than the district average.
- Market conditions: Rents rising fast (+4.5%/yr); 187 active listings in the ZIP; 21 comparable units currently listed for rent nearby; rentals leasing fast (median 13d on market — plan ~1-2 weeks tenant-placement turnaround); 8,139 units permitted in Franklin County in 2024 (5,940 in 5+ unit buildings).
- This rent runs 33% of the median local income ($59k/yr) — at the standard rent-burdened threshold; future hikes will face affordability resistance.
Forward outlook
- Local home prices are declining (-3.0%/yr); year-one equity from $1k of loan paydown is wiped out by about $4k of value loss. Plan a longer hold.
- Franklin County population projected at +34% by 2050 — long-run rental-demand tailwind backs the buy-and-hold thesis.
Negotiation context
- It's been on market 31 days — a 3% lower offer ($146k) is reasonable based on typical stale-listing flexibility.
- Current owner paid $40k; list at $150k implies a 275% gain — meaningful room to come down on a strong offer.
Questions for the listing agent
- What do current leases actually rent for vs. the listed asking? Can we see a recent rent roll and the last 12 months of T-12 income?
- It's been on market 31 days. Have you received any prior offers? Is the seller open to a 3% concession, seller financing, or rate buy-down credit?
- Built in 1974 — when were the roof, HVAC, electrical panel, plumbing, and water heater last replaced?
- What does the HOA fee cover, when was the last increase, and are there any pending special assessments or reserve-fund shortfalls?
- Any open or pending special assessments — roof, HVAC, plumbing, elevator, façade? What's the per-unit balance and payoff schedule, and is the seller paying it off at close or rolling it to the buyer?
- Is there a deadline driving the sale (1031 exchange, divorce, estate, relocation)? That informs how much negotiation room exists.
- Crime grade is F in this area — have there been break-ins, vandalism, or insurance claims at this property in the last 3 years? What carrier currently insures it and at what premium?
- The area grade is low — what's the realistic commute time and amenity access for the typical tenant pool here? Any planned neighborhood developments (good or bad) we should know about?
- What's the average days-on-market for RENTAL listings here right now (not sales)? A rising rental-DOM trend means longer vacancies and softer asking-rent achievability than the comps imply.
- What's the recent tenant-quality profile in this submarket — average credit score on applications, eviction rate, late-payment / NSF rate, and stable-employment percentage? A property-management company in the area should have these aggregated.
- How much new apartment / multifamily construction is in the pipeline within 1–3 miles? Heavy new supply (>2% of stock underway) typically softens rents 12–24 months out; light construction supports rent growth.
Investment metrics
- 1% rule
- 1.09% ✓
- Cap rate
- 6.25%
- Cash-on-cash
- -0.16%
- DSCR
- 0.99
- GRM
- 7.7
CMA / ARV
No comps found within radius.
Projected returns pro-forma
-3.0% appreciation · 4.49% rent growth · sell at horizon
- IRR
- -14.4%
- Equity multiple
- 0.48×
- Total profit
- $-21,983
- Equity at exit
- $22,365
- IRR
- -2.7%
- Equity multiple
- 0.80×
- Total profit
- $-8,328
- Equity at exit
- $12,969
Cash invested: $42,000 (down + closing). Projections, not guarantees.
Landlord ↔ Tenant lean methodology
- Overall (STATE)
- 73 Landlord-Friendly
- State Ohio
- 73 Landlord-Friendly · R+6
- County
- — inherits STATE
- City
- — inherits STATE
ZIP-level market 43204
- Rents YoY
- 4.5%
- Active inventory
- 187
- Price-to-rent
- 7.7×
Monthly cashflow live
- Estimated rent
- $1,633 high interval (Pro) →
- Mortgage (P&I)
- −$787
- Tax from tax record
- −$186 /mo · $2,228/yr
- Insurance
- −$62
- HOA
- −$261
- Vacancy / Maint / Mgmt
- −$343
- Net cashflow
- $-5
Break-even live
Sensitivity live
| Price | -10% $79 | -5% $37 | +0% $-5 | +5% $-48 | +10% $-90 |
|---|---|---|---|---|---|
| Rent | -10% $-134 | -5% $-70 | +0% $-5 | +5% $59 | +10% $124 |
| Rate | -1.0pp $70 | -0.5pp $33 | base $-5 | +0.5pp $-44 | +1.0pp $-84 |
UW: 25.0% down · 7.5% · 30yr · 1.5% tax · 5.0% vac · 8.0% maint · 8.0% mgmt
Financing live
Cash to close
- Down payment
- $37,500
- Closing costs
- $4,500
- Reserves months
- —
- Total cash needed
- —
Loan-product check · same deal, 3 products live
Conventional
25% down · 7.5% · 30yr
- Down + closing
- —
- Monthly P&I
- —
- Monthly cashflow
- —
- DSCR
- —
- Eligible?
- —
Personal DTI + credit; lowest rate.
DSCR
20% down · 8.5% · 30yr
- Down + closing
- —
- Monthly P&I
- —
- Monthly cashflow
- —
- DSCR
- —
- Eligible?
- —
No personal income docs; deal must DSCR.
Hard money
10% down · 12.0% · 12mo
- Down + closing
- —
- Monthly P&I
- —
- Monthly cashflow
- —
- DSCR
- —
- Eligible?
- —
Short-term bridge; refi at stabilization.
Rent comps 21 comps
| Address | Beds | Baths | Sqft | Rent | $/sqft | DOM | Units | Dist |
|---|---|---|---|---|---|---|---|---|
| 1303 Lowland Ct Columbus, OH | 2.0 | 1.0 | 838 | $1,400 | $1.67 | 45d | 1 | 0.09mi |
| 2960 Gooden Way Columbus, OH | 1.0–3.0 | 1.0–3.0 | 1123 | $1,430 | $1.27 | 4d | 17 | 0.15mi |
| 2960 Abbots Cove Blvd Columbus, OH | 2.0 | 1.0 | 875 | $1,249 | $1.43 | 45d | 6 | 0.15mi |
| 1450 N Hague Ave Columbus, OH | 1.0–3.0 | 1.0–2.0 | 1021 | $1,980 | $1.94 | 25d | 1 | 0.42mi |
| 3400 Twin Creeks Dr Columbus, OH | 1.0–2.0 | 1.0–1.5 | 840 | $1,480 | $1.76 | 45d | 1 | 0.62mi |
| 1480 Runaway Bay Dr Columbus, OH | 1.0–2.0 | 1.0–2.0 | 873 | $2,293 | $2.63 | 3d | 48 | 0.83mi |
| 3411 Trabue Rd Columbus, OH | 1.0–3.0 | 1.0–2.0 | 1126 | $2,949 | $2.62 | 3d | 40 | 0.84mi |
| 2900 Angelo Joseph Ln Columbus, OH | 1.0–2.0 | 1.0–2.0 | 915 | $1,800 | $1.97 | 3d | 18 | 0.85mi |
| 2550 Quarry Lake Dr Columbus, OH | 1.0–3.0 | 1.0–3.0 | 1046 | $3,102 | $2.97 | 3d | 56 | 0.89mi |
| 3691 Windward Way Columbus, OH | 2.0 | 1.0 | 850 | $1,125 | $1.32 | 45d | 1 | 0.93mi |
| 3255 McKinley Ave Columbus, OH | 1.0–2.0 | 1.0–2.0 | 1136 | $2,440 | $2.15 | 3d | 8 | 0.95mi |
| 1212 Lake Shore Dr Columbus, OH | 2.0 | 2.0 | 1044 | $2,200 | $2.11 | 12d | 1 | 0.96mi |
| 1627 Gilmore Park Ave Columbus, OH | 2.0 | 1.0 | 1100 | $1,250 | $1.14 | 23d | 1 | 1.16mi |
| 1627 Gilmore Park Ave Columbus, OH | 2.0 | 1.0 | 1100 | $1,250 | $1.14 | 25d | 1 | 1.16mi |
| 3953 Deer Lake Way Columbus, OH | 3.0 | 1.0 | 992 | $1,650 | $1.66 | 22d | 1 | 1.16mi |
| 3953 Deer Lake Way Columbus, OH | 3.0 | 1.0 | 992 | $1,650 | $1.66 | 16d | 1 | 1.16mi |
| 1655 Gilmore Park Ave Columbus, OH | 2.0 | 2.0 | 1100 | $1,350 | $1.23 | 45d | 1 | 1.16mi |
| 2157 Quarry Trails Dr Hilliard, OH | 1.0–2.0 | 1.0–2.0 | 804 | $2,438 | $3.03 | 3d | 39 | 1.27mi |
| 1340 Dublin Rd Columbus, OH | 1.0–2.0 | 1.0 | 696 | $1,270 | $1.82 | 4d | 16 | 1.31mi |
| 2211 Dublin Rd Columbus, OH | 1.0–2.0 | 1.0–2.0 | 830 | $1,860 | $2.24 | 3d | 13 | 1.43mi |
| 264-276 N Powell Ave Apt C Columbus, OH | 2.0 | 1.0 | 750 | $975 | $1.30 | 9d | 1 | 1.44mi |
HOA detail condo
- Monthly dues
- $261 · $3,132/yr
- Assessments
- None detected in remarks — confirm with the listing agent.
Listing history 20 events
-
2026-06-21days on market $150,000 Active 31 DOM
-
2026-06-18days on market $150,000 Active 28 DOM
-
2026-06-17days on market $150,000 Active 27 DOM
-
2026-06-16days on market $150,000 Active 26 DOM
-
2026-06-15days on market $150,000 Active 25 DOM
-
2026-06-13days on market $150,000 Active 23 DOM
-
2026-06-13days on market $150,000 Active 22 DOM
-
2026-06-09days on market $150,000 Active 19 DOM
-
2026-06-08days on market $150,000 Active 18 DOM
-
2026-06-07days on market $150,000 Active 17 DOM
-
2026-06-05days on market $150,000 Active 14 DOM
-
2026-06-03days on market $150,000 Active 13 DOM
-
2026-06-02days on market $150,000 Active 12 DOM
-
2026-06-01days on market $150,000 Active 11 DOM
-
2026-05-31pricedays on market $150,000 Active 10 DOM
-
2026-05-21$155,000 Active
-
2026-05-18historical $155,000
-
1991-02-27soldstatus $40,000
-
1987-07-16soldstatus $41,000
-
1984-12-01soldstatus $32,000
ⓘ Source: listings_history table (triggers on properties + properties_extension) + one-shot
backfill from property_details.listing_events for pre-trigger history.
Tax reassessment forecast OH · Partial reset (capped growth)
- Current annual tax
- $2,228 · $186/mo
- Projected year-2 tax
- $2,284 · $190/mo
- Expected delta
- +$56/yr (+$5/mo · 2.5%)
ⓘ Screening estimate from a state-policy table — verify with the county assessor before closing.
Nearby sold comps map
Loading sold comps map…
Walkable amenities ~0.75 mi
Loading nearby amenities…
Taxation est. · year 1
- Rental income
- $19,601
- − Mortgage interest
- −$8,402
- − Property taxes
- −$2,228
- − Insurance
- −$750
- − Repairs & maintenance
- −$1,568
- − Management
- −$1,568
- − HOA
- −$3,132
- − Depreciation
- −$4,364
- Taxable loss
- −$2,412
- Est. tax savings @ 24.0%
- +$579
- After-tax cash flow
- $514/yr
For passive investors: Depreciation is non-cash, so a rental often shows a tax loss while cash-flowing — sheltering income. Rental losses are passive: they offset passive income freely, and up to $25,000/yr can offset ordinary (W-2) income if you actively participate and your MAGI is under $100k (phasing out to $0 by $150k); unused losses carry forward. On sale, claimed depreciation is recaptured at up to 25%, and gains may owe capital-gains tax (a 1031 exchange can defer both). Figures are a year-1 estimate at your 24.0% rate — not tax advice; consult a CPA.
Schools (NCES district)
- District
- Columbus City School District
- NCES district ID
- 3904380
- Math proficiency
- 15% ▼ -17.00%
- Reading proficiency
- 26% ▼ -12.00%
- Median HH income
- $38,483
- Composite
- 17.19/100
- National rank
- #9105
- State rank
- #626 of 656 in OH
Livability — Columbus
- Score
- 81/100
- State rank
- #97
- US rank
- #1491
Category grades
Schools grade is shown separately in the Schools card above.
Census & demographics
- Census place
- Columbus, OH
- County
- Franklin County · 1,351,780 people
- City population
- 612,189
- Metro
- Columbus, OH
- Population (ZIP)
- 42,962
- Household income
- $59,266
- Rent vs Own
- Severe rent burden
- 2290.0
Population outlook (Franklin County) Hauer SSP2
- Today (2025)
- 1,456,139 people
- By 2030
- 1,556,890 · +6.9%
- By 2040
- 1,757,349 · +20.7%
- By 2050
- 1,950,539 · +34.0%
- By 2075
- 2,376,171 · +63.2%
- By 2100
- 2,636,796 · +81.1%
Race, ethnicity, and origin ACS 2023
- Neighborhood character
- Diverse neighborhood (Simpson 0.58)
- Race & ethnicity
- White 61% Hispanic / Latino 16% Black 13% Two or more races 12% Asian 3%
- Hispanic origin (detail)
- Mexican 9%
- Common ancestry
- Lithuanian 1% Slovak 1% Romanian 1%
- Foreign-born
- 13% · Canada
- Languages at home
- 81% English-only · Spanish 13% Arabic 2% Other Asian/Pacific 1%
Political lean MEDSL · Franklin
- 2024 margin
- Strong D (+28.4) · D 63.7% · R 35.3% · Other 1.0%
- 2008→2024 swing
- +7.7pp toward D · 2008: 20.7pp · 2024: 28.4pp
- All cycles
- 2024: D+28.4 2020: D+31.4 2016: D+25.9 2012: D+21.7 2008: D+20.7
Not yet ingested
- Civics
- —
Market trends
- HPI YoY
- ▼ -220.67%
- Current HPI
- 265.7711
- Rent YoY
- ▲ 4.49%
- Metro
- Columbus, OH
- State GDP YoY
- ▲ 1.98%
- F500 in state
- 48
Industry mix (Fortune 500 HQ in OH)
| Industry | F500 HQs | Revenue |
|---|---|---|
| Insurance | 3 | $145B |
|
||
| Industrial Machinery | 3 | $49B |
|
||
| Financial Services | 3 | $24B |
|
||
| Consumer Goods | 2 | $93B |
|
||
| Aerospace / Defense | 2 | $47B |
|
||
| Utilities | 2 | $33B |
|
||
Price history
+384.4% since first listed5 events — show timeline
- 2026-05-21 Listed $155,000 CBRMLS
- 2026-05-18 Coming Soon $155,000 CBRMLS
- 1991-02-27 Sold (Public Records) $40,000 Public Records
- 1987-07-16 Sold (Public Records) $41,000 Public Records
- 1984-12-01 Sold (Public Records) $32,000 Public Records
Property tax history
+5.7%/yrLatest (2024): $2,228 · +1.3% YoY. Source: county tax records.
Cash-flow waterfall
monthlySold comps — $/sqft
last 12 mo · ≤1 miLoading sold comps…