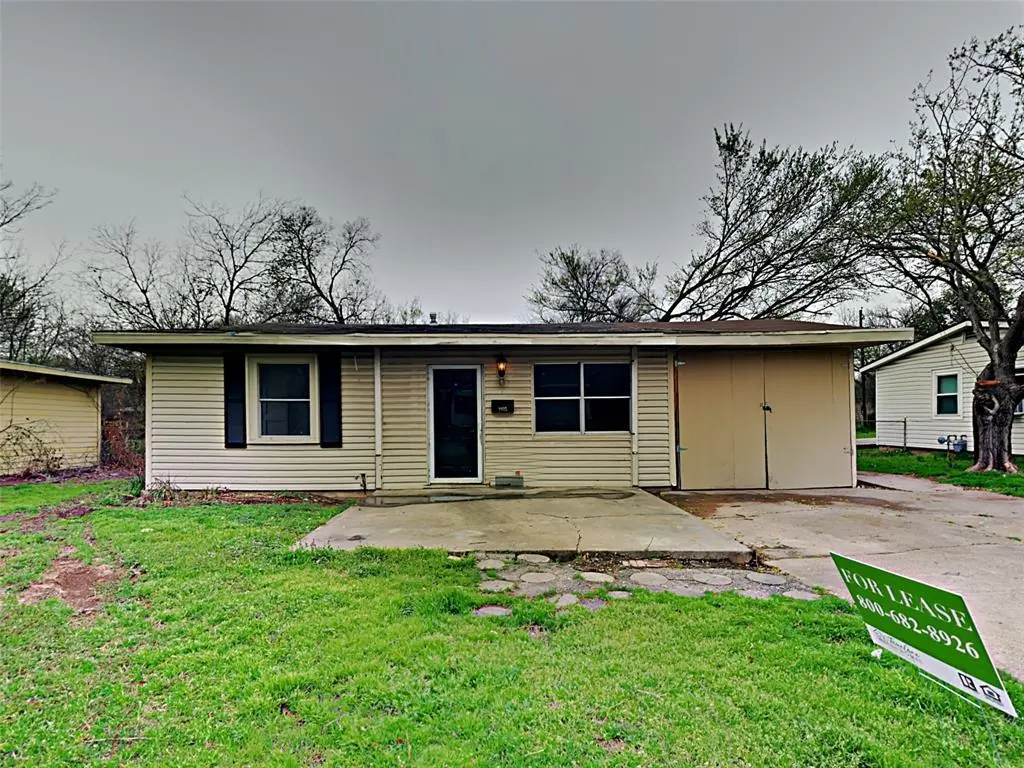
2815 Ash Park Dr · Richland Hills, TX
Flood risk 1/10 · Minimal
- FEMA flood zone
- X (unshaded)
- Chance of flooding over 30 yrs
- 0.0%
- Est. flood insurance / yr
- $507 – $1,088
Fire risk 3/10 · Minor
- Est. fire insurance / yr
- $1,222 – $2,270
Heat risk 8/10 · Major
- Hot days now (above 110°F)
- 7 days/yr
- Hot days in 30 yrs
- 23 days/yr
Wind risk 5/10 · Moderate
- Chance of severe wind over 30 yrs
- 26.0%
Air-quality risk 3/10 · Minor
- Unhealthy air days now
- 2 days/yr
- Unhealthy air days in 30 yrs
- 3 days/yr
Risk factors via First Street. Map © Google.
Why this score? — see what drove the D grade
The composite is a weighted blend of 9 inputs, each scored 0–100. Each bar is that input's sub-score; the figure is the points it added to the 100-point composite (weight × sub-score).
- ARV discount +14.3/15.0
- Cash flow +9.2/30.0
- Schools +3.7/10.0
- Livability +3.5/5.0
- 1% rule +2.9/10.0
- Rent growth +2.8/5.0
- DSCR +2.6/10.0
- Condition / age +2.5/5.0
- Appreciation +0.0/10.0
$234,900
🖨 Deal sheet 📄 Offer letter ✓ Due diligence
Listing remarks MLS
Located in the established Richland Park neighborhood of Richland Hills, this charming single-story home offers comfortable living with plenty of potential. Built in 1952, the property features approximately 1,600 square feet of living space with 4 bedrooms and 2 bathrooms. The spacious living area flows into a functional kitchen and dining space, creating an inviting layout for everyday living and entertaining. Situated on a 7,405-square-foot lot, the home offers a generous yard with room for outdoor gatherings, gardening, or future improvements. The classic design and established neighborhood provide a welcoming atmosphere while still offering convenient access to major highways, shopping, dining, and nearby Fort Worth and Dallas. With its solid structure, spacious floor plan, and convenient location in the heart of Tarrant County, this property presents an excellent opportunity for homeowners or investors looking to add value in a growing area.
Key facts
- Functional kitchen
- Generous yard
- Spacious living area
Tags
Neighborhood map
What this means for you Summary
Snapshot
- This is a 3-bed/2.0-bath single-family listed at $235k.
Deal economics
- At list price, monthly cash flow is $-175 ($-2k/yr) — negative.
- To cash-flow at today's rent, offer at most $204k (13.2% below list).
- To meet the 1% rule (rent ≥ 1% of price), the offer needs to be $186k (20.9% below list).
- Recommended offer: $186k (20.9% below list) — sets the bar for 1% rule.
- Cap rate 5.4% vs local median 3.7% in Richland Hills — top-decile yield for the area; either an underpriced asset or a hidden risk that comps aren't pricing in. Stress-test before assuming the spread holds.
Location & tenants
- Location reads 69/100 on livability (#410 in TX) — a middle-class / working-renter tenant base. Strengths: cost of living A+, housing A+, employment B; Watch: schools D-, amenities F, commute F.
- Birdville ISD (suburban): math 42% / reading 43% proficiency, ranked #299 of 826 in TX (top 36%) — families likely to look elsewhere, expect single-tenant / working-renter base with shorter leases.
- Market conditions: Rents rising (+1.3%/yr); 80 active listings in the ZIP; 17 comparable units currently listed for rent nearby; rentals at typical pace (median 25d on market — plan ~3-4 weeks tenant-placement turnaround); solid renter incomes; 18,938 units permitted in Tarrant County in 2024 (8,336 in 5+ unit buildings).
Forward outlook
- Local home prices are declining (-3.0%/yr); year-one equity from $2k of loan paydown is wiped out by about $7k of value loss. Plan a longer hold.
- Tarrant County population projected at +41% by 2050 — long-run rental-demand tailwind backs the buy-and-hold thesis.
Negotiation context
- It's been on market 100 days — a 9% lower offer ($214k) is reasonable based on typical stale-listing flexibility.
- 5 sale attempts since 21y ago; this cycle's ask has dropped $40k (15%) from the opening price — seller is motivated, your offer sets the floor, not the list.
Risks & watch-outs
- Watch-outs: built in 1952 — expect roof / HVAC / electrical / plumbing capex.
- Climate carrying-cost: moderate wind risk, 26% chance of damaging wind over 30y; extreme-heat days projected 7→23/yr by 2055 (HVAC capex compounding) — expect insurance premiums to compound above CPI over the hold.
Questions for the listing agent
- What do current leases actually rent for vs. the listed asking? Can we see a recent rent roll and the last 12 months of T-12 income?
- It's been on market 100 days. Have you received any prior offers? Is the seller open to a 21% concession, seller financing, or rate buy-down credit?
- Built in 1952 — when were the roof, HVAC, electrical panel, plumbing, and water heater last replaced?
- Why hasn't it sold? Are there any deal-killer items the seller is aware of (foundation, flood, title, zoning, code violations)?
- Is there a deadline driving the sale (1031 exchange, divorce, estate, relocation)? That informs how much negotiation room exists.
- Schools are D-rated, which usually means shorter tenancies and higher turnover. Who's the typical renter profile here, and what's been the actual vacancy rate?
- The area grade is low — what's the realistic commute time and amenity access for the typical tenant pool here? Any planned neighborhood developments (good or bad) we should know about?
- What's the average days-on-market for RENTAL listings here right now (not sales)? A rising rental-DOM trend means longer vacancies and softer asking-rent achievability than the comps imply.
- What's the recent tenant-quality profile in this submarket — average credit score on applications, eviction rate, late-payment / NSF rate, and stable-employment percentage? A property-management company in the area should have these aggregated.
- How much new for-sale + rental construction is in the pipeline within 1–3 miles? Heavy new supply typically softens prices + rents 12–24 months out; constrained supply supports both.
Investment metrics
- 1% rule
- 0.79% ✗
- Cap rate
- 5.40%
- Cash-on-cash
- -3.20%
- DSCR
- 0.86
- GRM
- 10.5
CMA / ARV
- ARV (median comp)
- $276,530
- List price
- $234,900
- Delta
- -15.05%
- Verdict
- UNDERPRICED
- Comps
- 20 within 1.0 mi
Show comp detail 12 sales within ~0.75 mi
| Address | Dist | Beds/Ba | Sqft | Sold | Price | $/sf | Match |
|---|---|---|---|---|---|---|---|
| 2900 Spruce Park Dr | 0.11mi | 3/2.0 | 1,631 (+2%) | 3mo | $320,000 | $196 | 89 |
| 7138 Maple Park Dr | 0.31mi | 3/2.0 | 1,536 (-4%) | 3mo | $365,000 | $238 | 76 |
| 2720 Cedar Park Blvd | 0.19mi | 3/2.0 | 1,456 (-9%) | 4mo | $268,900 | $185 | 73 |
| 2716 Spruce Park Dr | 0.20mi | 3/2.0 | 1,836 (+15%) | 1mo | $310,000 | $169 | 66 |
| 3215 Hampton Dr | 0.36mi | 3/2.5 | 1,433 (-10%) | 3mo | $315,000 | $220 | 62 |
| 3210 Hampton Dr | 0.35mi | 4/2.5 (+1) | 1,730 (+8%) | 3mo | $324,999 | $188 | 61 |
| 3133 Kingsbury Ave | 0.46mi | 3/2.0 | 1,762 (+10%) | 4mo | $319,900 | $182 | 58 |
| 3225 Hampton Dr | 0.39mi | 3/2.5 | 1,387 (-13%) | 6mo | $300,000 | $216 | 53 |
| 6809 Park Place Dr | 0.50mi | 3/2.0 | 1,791 (+12%) | 8mo | $325,000 | $181 | 50 |
| 3224 Mimosa Park Dr | 0.38mi | 4/2.5 (+1) | 1,830 (+14%) | 2mo | $430,000 | $235 | 50 |
| 3308 Blue Jay Way | 0.52mi | 4/2.5 (+1) | 1,784 (+12%) | 8mo | $366,990 | $206 | 43 |
| 3350 Kingsbury Ave | 0.69mi | 3/2.0 | 1,363 (-15%) | 6mo | $275,000 | $202 | 38 |
Match score weights: distance 35% · size 25% · config 20% · recency 20%. Top-matched comps best support the ARV.
Projected returns pro-forma
-3.0% appreciation · 1.28% rent growth · sell at horizon
- IRR
- -23.6%
- Equity multiple
- 0.20×
- Total profit
- $-52,351
- Equity at exit
- $35,024
- IRR
- -23.9%
- Equity multiple
- -0.10×
- Total profit
- $-72,335
- Equity at exit
- $20,310
Cash invested: $65,772 (down + closing). Projections, not guarantees.
Landlord ↔ Tenant lean methodology
- Overall (STATE)
- 87 Strongly Landlord-Friendly
- State Texas
- 87 Strongly Landlord-Friendly · R+5
- County
- — inherits STATE
- City
- — inherits STATE
ZIP-level market 76118
- Home prices YoY
- -15.9%
- Rents YoY
- 1.3%
- Active inventory
- 80
- Price-to-rent
- 10.5×
Monthly cashflow live
- Estimated rent
- $1,859 high interval (Pro) →
- Mortgage (P&I)
- −$1,232
- Tax from tax record
- −$314 /mo · $3,771/yr
- Insurance
- −$98
- HOA
- −$0
- Vacancy / Maint / Mgmt
- −$390
- Net cashflow
- $-175
Break-even live
Sensitivity live
| Price | -10% $-42 | -5% $-109 | +0% $-175 | +5% $-242 | +10% $-308 |
|---|---|---|---|---|---|
| Rent | -10% $-322 | -5% $-249 | +0% $-175 | +5% $-102 | +10% $-28 |
| Rate | -1.0pp $-57 | -0.5pp $-116 | base $-175 | +0.5pp $-236 | +1.0pp $-298 |
UW: 25.0% down · 7.5% · 30yr · 1.5% tax · 5.0% vac · 8.0% maint · 8.0% mgmt
Financing live
Cash to close
- Down payment
- $58,725
- Closing costs
- $7,047
- Reserves months
- —
- Total cash needed
- —
Loan-product check · same deal, 3 products live
Conventional
25% down · 7.5% · 30yr
- Down + closing
- —
- Monthly P&I
- —
- Monthly cashflow
- —
- DSCR
- —
- Eligible?
- —
Personal DTI + credit; lowest rate.
DSCR
20% down · 8.5% · 30yr
- Down + closing
- —
- Monthly P&I
- —
- Monthly cashflow
- —
- DSCR
- —
- Eligible?
- —
No personal income docs; deal must DSCR.
Hard money
10% down · 12.0% · 12mo
- Down + closing
- —
- Monthly P&I
- —
- Monthly cashflow
- —
- DSCR
- —
- Eligible?
- —
Short-term bridge; refi at stabilization.
Rent comps 17 comps
| Address | Beds | Baths | Sqft | Rent | $/sqft | DOM | Units | Dist |
|---|---|---|---|---|---|---|---|---|
| 2833 Kingsbury Ave Richland Hills, TX | 3.0 | 2.0 | 1576 | $2,250 | $1.43 | 44d | 1 | 0.29mi |
| 6605 Park Place Dr Unit A Richland Hills, TX | 3.0 | 2.5 | 1388 | $1,595 | $1.15 | 14d | 1 | 0.65mi |
| 6605 Park Place Dr Unit A Richland Hills, TX | 3.0 | 2.5 | 1850 | $1,700 | $0.92 | 44d | 1 | 0.65mi |
| 6605 Park Place Dr Unit D Richland Hills, TX | 2.0 | 1.5 | 1192 | $1,450 | $1.22 | 25d | 1 | 0.65mi |
| 6605 Park Place Dr Richland Hills, TX | 2.0 | 2.0 | 1192 | $1,450 | $1.22 | 44d | 1 | 0.65mi |
| 6520 Park Place Dr Richland Hills, TX | 2.0–3.0 | 1.0–2.0 | 1317 | $1,550 | $1.18 | 2d | 3 | 0.69mi |
| 6506 Park Place Dr Richland Hills, TX | 3.0 | 2.5 | 1528 | $1,995 | $1.31 | 22d | 1 | 0.76mi |
| 6506 Park Place Dr Richland Hills, TX | 3.0 | 2.5 | 1528 | $2,050 | $1.34 | 25d | 1 | 0.76mi |
| 6500 Park Place Dr Unit 6506 Richland Hills, TX | 3.0 | 2.5 | 1528 | $1,995 | $1.31 | 25d | 1 | 0.77mi |
| 3225 Crites St Unit 102 Richland Hills, TX | 3.0 | 2.0 | 1100 | $1,500 | $1.36 | 25d | 1 | 0.90mi |
| 3319 Crites St Unit 101 Richland Hills, TX | 3.0 | 2.5 | 1580 | $1,650 | $1.04 | 25d | 1 | 0.98mi |
| 3319 Crites St Richland Hills, TX | 3.0 | 2.0 | 1600 | $1,650 | $1.03 | 44d | 1 | 0.98mi |
| 3319 Crites St Unit 203 Richland Hills, TX | 3.0 | 2.0 | 1680 | $1,595 | $0.95 | 44d | 1 | 0.98mi |
| 7600 Bridges Ave Unit A Richland Hills, TX | 2.0 | 1.5 | 1488 | $1,700 | $1.14 | 44d | 1 | 1.05mi |
| 3424 Chaffin Dr Richland Hills, TX | 3.0 | 2.0 | 2024 | $2,116 | $1.05 | 2d | 1 | 1.15mi |
| 6205 N Highland Cir Haltom City, TX | 3.0 | 2.0 | 1456 | $1,795 | $1.23 | 2d | 1 | 1.33mi |
| 3625 Venice Dr North Richland Hills, TX | 4.0 | 2.0 | 1896 | $2,095 | $1.10 | 25d | 1 | 1.37mi |
Listing history 31 events
-
2026-06-18days on market $234,900 Active 100 DOM
-
2026-06-17days on market $234,900 Active 99 DOM
-
2026-06-16days on market $234,900 Active 98 DOM
-
2026-06-15days on market $234,900 Active 97 DOM
-
2026-06-13pricedays on market $234,900 Active 95 DOM
-
2026-06-09days on market $249,900 Active 91 DOM
-
2026-06-08days on market $249,900 Active 90 DOM
-
2026-06-07days on market $249,900 Active 89 DOM
-
2026-06-04days on market $249,900 Active 86 DOM
-
2026-06-03days on market $249,900 Active 85 DOM
-
2026-06-02days on market $249,900 Active 84 DOM
-
2026-06-01days on market $249,900 Active 83 DOM
-
2026-05-31days on market $249,900 Active 82 DOM
-
2026-05-06price $259,900 967-char remark
Show marketing remark (967 chars)
Located in the established Richland Park neighborhood of Richland Hills, this charming single-story home offers comfortable living with plenty of potential. Built in 1952, the property features approximately 1,600 square feet of living space with 4 bedrooms and 2 bathrooms. The spacious living area flows into a functional kitchen and dining space, creating an inviting layout for everyday living and entertaining. Situated on a 7,405-square-foot lot, the home offers a generous yard with room for outdoor gatherings, gardening, or future improvements. The classic design and established neighborhood provide a welcoming atmosphere while still offering convenient access to major highways, shopping, dining, and nearby Fort Worth and Dallas. With its solid structure, spacious floor plan, and convenient location in the heart of Tarrant County, this property presents an excellent opportunity for homeowners or investors looking to add value in a growing area.
-
2026-04-08price $270,000 967-char remark
Show marketing remark (967 chars)
Located in the established Richland Park neighborhood of Richland Hills, this charming single-story home offers comfortable living with plenty of potential. Built in 1952, the property features approximately 1,600 square feet of living space with 4 bedrooms and 2 bathrooms. The spacious living area flows into a functional kitchen and dining space, creating an inviting layout for everyday living and entertaining. Situated on a 7,405-square-foot lot, the home offers a generous yard with room for outdoor gatherings, gardening, or future improvements. The classic design and established neighborhood provide a welcoming atmosphere while still offering convenient access to major highways, shopping, dining, and nearby Fort Worth and Dallas. With its solid structure, spacious floor plan, and convenient location in the heart of Tarrant County, this property presents an excellent opportunity for homeowners or investors looking to add value in a growing area.
-
2026-03-10$275,000 Active 967-char remark
Show marketing remark (967 chars)
Located in the established Richland Park neighborhood of Richland Hills, this charming single-story home offers comfortable living with plenty of potential. Built in 1952, the property features approximately 1,600 square feet of living space with 4 bedrooms and 2 bathrooms. The spacious living area flows into a functional kitchen and dining space, creating an inviting layout for everyday living and entertaining. Situated on a 7,405-square-foot lot, the home offers a generous yard with room for outdoor gatherings, gardening, or future improvements. The classic design and established neighborhood provide a welcoming atmosphere while still offering convenient access to major highways, shopping, dining, and nearby Fort Worth and Dallas. With its solid structure, spacious floor plan, and convenient location in the heart of Tarrant County, this property presents an excellent opportunity for homeowners or investors looking to add value in a growing area.
-
2014-04-25soldstatus Closed 123-char remark
Show marketing remark (123 chars)
Updated 4 Bedroom in popular area of Richland Hills. Central Heat and Air, Hardwoods, Covered Patios. Owner offering terms.
-
2014-04-16status Pending 123-char remark
Show marketing remark (123 chars)
Updated 4 Bedroom in popular area of Richland Hills. Central Heat and Air, Hardwoods, Covered Patios. Owner offering terms.
-
2014-04-01historical Active Option Contract 123-char remark
Show marketing remark (123 chars)
Updated 4 Bedroom in popular area of Richland Hills. Central Heat and Air, Hardwoods, Covered Patios. Owner offering terms.
-
2014-03-28$84,900 Active 123-char remark
Show marketing remark (123 chars)
Updated 4 Bedroom in popular area of Richland Hills. Central Heat and Air, Hardwoods, Covered Patios. Owner offering terms.
-
2013-10-18soldstatus Closed
-
2013-10-02status Pending
-
2013-09-07status Active
-
2013-07-17status Pending
-
2013-07-03$38,000 Active
-
2005-11-22soldstatus
-
2005-11-16soldstatus
-
2005-10-04historical
-
2005-06-06$69,900
-
1994-09-30soldstatus
-
1992-03-03soldstatus
ⓘ Source: listings_history table (triggers on properties + properties_extension) + one-shot
backfill from property_details.listing_events for pre-trigger history.
Tax reassessment forecast TX · Resets to sale price
- Current annual tax
- $3,771 · $314/mo
- Projected year-2 tax
- $4,299 · $358/mo
- Expected delta
- +$528/yr (+$44/mo · 14.0%)
ⓘ Screening estimate from a state-policy table — verify with the county assessor before closing.
Climate risk First Street
- Flood 1/10 Low FEMA zone X (unshaded) · 0% chance over 30 yrs
- Wildfire 3/10 Moderate
- Heat 8/10 Severe 7 d/yr ≥110°F today · 23 d/yr by 30 yrs out
- Wind 5/10 Major 26% chance of damaging wind over 30 yrs
- Air quality 3/10 Moderate 2 unhealthy d/yr today · 3 by 30 yrs out
Nearby sold comps map
Loading sold comps map…
Walkable amenities ~0.75 mi
Loading nearby amenities…
Taxation est. · year 1
- Rental income
- $22,309
- − Mortgage interest
- −$13,158
- − Property taxes
- −$3,771
- − Insurance
- −$1,174
- − Repairs & maintenance
- −$1,785
- − Management
- −$1,785
- − Depreciation
- −$6,833
- Taxable loss
- −$6,197
- Est. tax savings @ 24.0%
- +$1,487
- After-tax cash flow
- $-616/yr
For passive investors: Depreciation is non-cash, so a rental often shows a tax loss while cash-flowing — sheltering income. Rental losses are passive: they offset passive income freely, and up to $25,000/yr can offset ordinary (W-2) income if you actively participate and your MAGI is under $100k (phasing out to $0 by $150k); unused losses carry forward. On sale, claimed depreciation is recaptured at up to 25%, and gains may owe capital-gains tax (a 1031 exchange can defer both). Figures are a year-1 estimate at your 24.0% rate — not tax advice; consult a CPA.
Schools (NCES district)
- District
- Birdville ISD
- NCES district ID
- 4810230
- Math proficiency
- 42% ▼ -12.00%
- Reading proficiency
- 43% ▼ -6.00%
- Median HH income
- $55,930
- Composite
- 37.13/100
- National rank
- #4491
- State rank
- #299 of 826 in TX
Livability — Richland Hills
- Score
- 69/100
- State rank
- #410
- US rank
- #8468
Category grades
Schools grade is shown separately in the Schools card above.
Census & demographics
- Census place
- Richland Hills, TX
- County
- Tarrant County · 2,033,669 people
- Metro
- Dallas-Fort Worth-Arlington, TX
- Population (ZIP)
- 17,991
- Household income
- $94,530
- Rent vs Own
- Severe rent burden
- 405.0
Population outlook (Tarrant County) Hauer SSP2
- Today (2025)
- 2,380,417 people
- By 2030
- 2,578,900 · +8.3%
- By 2040
- 2,974,995 · +25.0%
- By 2050
- 3,350,489 · +40.8%
- By 2075
- 4,216,909 · +77.2%
- By 2100
- 4,741,527 · +99.2%
Race, ethnicity, and origin ACS 2023
- Neighborhood character
- Diverse neighborhood (Simpson 0.62)
- Race & ethnicity
- White 58% Hispanic / Latino 18% Black 10% Asian 8% Two or more races 6% Pacific Islander 1% Native American 1%
- Hispanic origin (detail)
- Mexican 12% Puerto Rican 4%
- Common ancestry
- Slovak 2% Lithuanian 2% Italian 1%
- Foreign-born
- 13% · Canada, Vietnam
- Languages at home
- 80% English-only · Spanish 10% Other Indo-European 5% Vietnamese 2%
Political lean MEDSL · Tarrant
- 2024 margin
- Lean R (+5.1) · D 46.7% · R 51.9% · Other 1.4%
- 2008→2024 swing
- +6.6pp toward D · 2008: -11.7pp · 2024: -5.1pp
- All cycles
- 2024: R+5.1 2020: D+0.2 2016: R+8.7 2012: R+15.7 2008: R+11.7
Not yet ingested
- Civics
- —
Market trends
- HPI YoY
- ▼ -58.64%
- Current HPI
- 310.0546
- Rent YoY
- ▲ 1.28%
- Metro
- Dallas-Fort Worth-Arlington, TX
- State GDP YoY
- ▲ 3.95%
- F500 in state
- 110
Industry mix (Fortune 500 HQ in TX)
| Industry | F500 HQs | Revenue |
|---|---|---|
| Energy | 16 | $1,198B |
|
||
| Technology | 5 | $198B |
|
||
| Engineering / Construction | 4 | $72B |
|
||
| Energy Services | 3 | $60B |
|
||
| Utilities | 3 | $41B |
|
||
| Healthcare | 2 | $330B |
|
||
Price history
+271.8% since first listed18 events — show timeline
- 2026-05-06 Price Changed $259,900 NTREIS
- 2026-04-08 Price Changed $270,000 NTREIS
- 2026-03-10 Listed $275,000 NTREIS
- 2014-04-25 Sold (MLS) — NTREIS
- 2014-04-16 Pending — NTREIS
- 2014-04-01 Contingent — NTREIS
- 2014-03-28 Listed $84,900 NTREIS
- 2013-10-18 Sold (MLS) — NTREIS
- 2013-10-02 Pending — NTREIS
- 2013-09-07 Relisted — NTREIS
- 2013-07-17 Pending — NTREIS
- 2013-07-03 Listed $38,000 NTREIS
- 2005-11-22 Sold (Public Records) — Public Records
- 2005-11-16 Sold (MLS) — NTREIS
- 2005-10-04 Listing Removed — NTREIS
- 2005-06-06 Listed $69,900 NTREIS
- 1994-09-30 Sold (Public Records) — Public Records
- 1992-03-03 Sold (Public Records) — Public Records
Property tax history
+4.2%/yrLatest (2025): $3,771 · -15.5% YoY. Source: county tax records.
Cash-flow waterfall
monthlySold comps — $/sqft
last 12 mo · ≤1 miLoading sold comps…