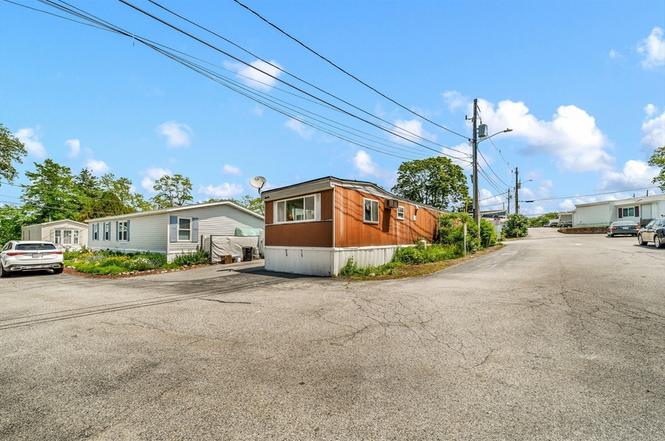
154 Newbury St #26 · Peabody, MA
Flood risk 1/10 · Minimal
- FEMA flood zone
- X (unshaded)
- Chance of flooding over 30 yrs
- 0.0%
- Est. flood insurance / yr
- $507 – $1,088
Fire risk 1/10 · Minimal
- Est. fire insurance / yr
- $915 – $1,699
Heat risk 5/10 · Moderate
- Hot days now (above 97°F)
- 7 days/yr
- Hot days in 30 yrs
- 15 days/yr
Wind risk 6/10 · Moderate
- Chance of severe wind over 30 yrs
- 64.0%
Air-quality risk 3/10 · Minor
- Unhealthy air days now
- 3 days/yr
- Unhealthy air days in 30 yrs
- 3 days/yr
Risk factors via First Street. Map © Google.
Why this score? — see what drove the B grade
The composite is a weighted blend of 9 inputs, each scored 0–100. Each bar is that input's sub-score; the figure is the points it added to the 100-point composite (weight × sub-score).
- Cash flow +30.0/30.0
- ARV discount +10.1/15.0
- 1% rule +10.0/10.0
- DSCR +10.0/10.0
- Livability +4.0/5.0
- Schools +3.1/10.0
- Rent growth +2.3/5.0
- Condition / age +2.2/5.0
- Appreciation +0.0/10.0
$199,900
🖨 Deal sheet 📄 Offer letter ✓ Due diligence
Listing remarks
Charming and affordable 3-bedroom, 1-bath mobile home in a well-maintained park in Peabody, MA! This bright and inviting home features beautiful hardwood floors, a spacious sun room perfect for relaxing or entertaining, and convenient in-unit laundry. Enjoy two dedicated parking spaces and easy access to major highways for a stress-free commute. The thoughtfully designed layout offers comfortable living with great natural light throughout. A fantastic condo alternative with low-maintenance living and a welcoming community setting-don't miss this opportunity to own in a convenient North Shore location!
Key facts
- Sun room
- In-unit laundry
- Hardwood floors
Tags
Property features AI
Finance
- Other: Total of 6 rooms; Building area (above grade) of 952
- HOA & community: Homeowners association membership required; Association fee of $275; Community offers public transportation, shopping, parks, walking/jogging trails, golf, medical facility, laundromat, bike path, conservation area, highway access, places of worship, and schools
Exterior
- Parking: Off-street parking; Two parking spaces (open)
- Utilities: Public water; Public sewer; 110-volt electric
- Home design: Mobile home (house with addition); Single-story entry (first floor living areas)
- Construction: Modular construction; Shingle roof; Slab foundation; Year built reported by owner
- Exterior features: Enclosed porch; Porch; Corner lot; Paved road frontage; Public road frontage
Interior
- Kitchen: Hardwood flooring and overhead lighting
- Bedrooms: Master bedroom on the first floor with hardwood flooring and overhead lighting; Second bedroom on the first floor with hardwood flooring and overhead lighting; Third bedroom on the first floor with hardwood flooring and overhead lighting
- Flooring: Hardwood; Tile
- Bathrooms: One full bathroom; Master bathroom present; Full bathroom with tiled shower stall and stone/ceramic tile flooring
- Heating & cooling: Oil heating; Window unit(s) for cooling; Has heating and cooling
- Interior features: Sun room; Storm door(s)
- Laundry & utility: Laundry on the first floor; Washer and dryer included
Neighborhood map
What this means for you Summary
Snapshot
- This is a 3-bed/1.0-bath manufactured listed at $200k. Condition is rated fair.
Deal economics
- At list price, monthly cash flow is $1k ($15k/yr) — positive.
- The deal already cash-flows at list — no discount required.
- Meets the 1% rule at list price ($4k rent vs $200k).
- Cap rate 13.9% vs local median 3.4% in Peabody — top-decile yield for the area; either an underpriced asset or a hidden risk that comps aren't pricing in. Stress-test before assuming the spread holds.
Location & tenants
- Location reads 79/100 on livability (#44 in MA, #2,070 nationally) — a middle-class / working-renter tenant base. Strengths: commute A+, employment A+, health & safety A+; Watch: amenities D+, cost of living F.
- Peabody (suburban): math 29% / reading 40% proficiency, ranked #233 of 302 in MA (top 77%) — families likely to look elsewhere, expect single-tenant / working-renter base with shorter leases.
- Zoned schools: John E. Mccarthy (math 37% / reading 52%, grade F, #421 of 938 statewide, top 48%, 338 students, 0% FRL); Peabody Veterans Memorial High (math 46% / reading 59%, grade C-, #173 of 343 statewide, top 51%, 1,476 students, 0% FRL) — zoned schools average 0% FRL vs 30% district-wide (30 pts lower); this property's tenant base skews higher-income than the district average.
- Zoned-school proficiency averages 48% at this address vs 34% district-wide (+14 pts) — the actual schools serving this property are materially stronger than the Peabody average implies; a family-tenant draw the district grade alone would hide.
- Market conditions: Rents soft (-0.9%/yr); 40 active listings in the ZIP; 6 comparable units currently listed for rent nearby; rentals leasing fast (median 2d on market — plan ~1-2 weeks tenant-placement turnaround); solid renter incomes; 1,032 units permitted in Essex County in 2024 (590 in 5+ unit buildings).
- At $3,711/mo this rent would consume 46% of the median local household income ($97k/yr) (locally 2570% of renters already pay >50% of income on rent) — very limited rent-growth headroom before tenants either downsize or default.
Forward outlook
- Local home prices are declining (-3.0%/yr); year-one equity from $1k of loan paydown is wiped out by about $6k of value loss. Plan a longer hold.
- Essex County population projected at +15% by 2050 — long-run rental-demand tailwind backs the buy-and-hold thesis.
- At projected returns (-3.0% appreciation + 0.0% rent growth), your $56k cash investment doubles in ~6 years — after that, you're playing with house money.
Negotiation context
- Only 7 days on market — expect competitive offers; lowballing is unlikely to land.
Risks & watch-outs
- Climate carrying-cost: major wind risk, 64% chance of damaging wind over 30y; extreme-heat days projected 7→15/yr by 2055 (HVAC capex compounding) — expect insurance premiums to compound above CPI over the hold.
Questions for the listing agent
- Have any recent inspections been done? Can we get a copy of the seller's disclosures and any deferred-maintenance estimates?
- Built in 1972 — when were the roof, HVAC, electrical panel, plumbing, and water heater last replaced?
- What does the HOA fee cover, when was the last increase, and are there any pending special assessments or reserve-fund shortfalls?
- Is there a deadline driving the sale (1031 exchange, divorce, estate, relocation)? That informs how much negotiation room exists.
- What's the average days-on-market for RENTAL listings here right now (not sales)? A rising rental-DOM trend means longer vacancies and softer asking-rent achievability than the comps imply.
- What's the recent tenant-quality profile in this submarket — average credit score on applications, eviction rate, late-payment / NSF rate, and stable-employment percentage? A property-management company in the area should have these aggregated.
- How much new for-sale + rental construction is in the pipeline within 1–3 miles? Heavy new supply typically softens prices + rents 12–24 months out; constrained supply supports both.
Investment metrics
- 1% rule
- 1.86% ✓
- Cap rate
- 13.95%
- Cash-on-cash
- 27.34%
- DSCR
- 2.22
- GRM
- 4.5
CMA / ARV
- ARV (on-the-fly)
- $212,296
- Comps found
- 4
Show comp detail 4 sales within ~0.75 mi
| Address | Dist | Beds/Ba | Sqft | Sold | Price | $/sf | Match |
|---|---|---|---|---|---|---|---|
| 165 Newbury St #2 | 0.20mi | 3/1.0 | 930 (-2%) | 5mo | $143,000 | $154 | 82 |
| 161 Newbury St #11 | 0.11mi | 2/1.0 (-1) | 1,000 (+5%) | 16mo | $220,000 | $220 | 68 |
| 165 Newbury #5 | 0.20mi | 2/2.0 (-1) | 870 (-9%) | 5mo | $269,900 | $310 | 64 |
| 41 Pine St #13 | 0.40mi | 2/1.5 (-1) | 1,056 (+11%) | 7mo | $235,000 | $223 | 50 |
Match score weights: distance 35% · size 25% · config 20% · recency 20%. Top-matched comps best support the ARV.
Projected returns pro-forma
-3.0% appreciation · 0.0% rent growth · sell at horizon
- IRR
- 17.6%
- Equity multiple
- 1.68×
- Total profit
- $38,177
- Equity at exit
- $29,806
- IRR
- 23.6%
- Equity multiple
- 2.73×
- Total profit
- $96,713
- Equity at exit
- $17,284
Cash invested: $55,972 (down + closing). Projections, not guarantees.
Landlord ↔ Tenant lean methodology
- Overall (STATE)
- 20 Strongly Tenant-Friendly
- State Massachusetts
- 20 Strongly Tenant-Friendly · D+15
- County
- — inherits STATE
- City
- — inherits STATE
ZIP-level market 01960
- Rents YoY
- -0.9%
- Active inventory
- 40
- Price-to-rent
- 4.5×
Monthly cashflow live
- Estimated rent
- $3,711 high interval (Pro) →
- Mortgage (P&I)
- −$1,048
- Tax est. 1.5%
- −$250 /mo · $2,998/yr
- Insurance
- −$83
- HOA
- −$275
- Vacancy / Maint / Mgmt
- −$779
- Net cashflow
- $1,275
Break-even live
UW: 25.0% down · 7.5% · 30yr · 1.5% tax · 5.0% vac · 8.0% maint · 8.0% mgmt
Financing live
Cash to close
- Down payment
- $49,975
- Closing costs
- $5,997
- Reserves months
- —
- Total cash needed
- —
Loan-product check · same deal, 3 products live
Conventional
25% down · 7.5% · 30yr
- Down + closing
- —
- Monthly P&I
- —
- Monthly cashflow
- —
- DSCR
- —
- Eligible?
- —
Personal DTI + credit; lowest rate.
DSCR
20% down · 8.5% · 30yr
- Down + closing
- —
- Monthly P&I
- —
- Monthly cashflow
- —
- DSCR
- —
- Eligible?
- —
No personal income docs; deal must DSCR.
Hard money
10% down · 12.0% · 12mo
- Down + closing
- —
- Monthly P&I
- —
- Monthly cashflow
- —
- DSCR
- —
- Eligible?
- —
Short-term bridge; refi at stabilization.
Rent comps 6 comps
| Address | Beds | Baths | Sqft | Rent | $/sqft | DOM | Units | Dist |
|---|---|---|---|---|---|---|---|---|
| 128 Newbury St Peabody, MA | 3.0 | 1.0–2.0 | 955 | $4,105 | $4.30 | 2d | 15 | 0.29mi |
| 7 Dearborn Rd Peabody, MA | 1.0–2.0 | 1.0–2.0 | 1105 | $3,629 | $3.28 | 2d | 12 | 0.97mi |
| 2 Hotel Ave Peabody, MA | 1.0–3.0 | 1.0–2.0 | 1050 | $3,500 | $3.33 | 2d | 3 | 0.98mi |
| 19 Magnolia Way Peabody, MA | 1.0–3.0 | 1.0–2.0 | 1034 | $3,940 | $3.81 | 2d | 28 | 1.10mi |
| 286 Newbury St Unit 114 Peabody, MA | 3.0 | 1.0 | 1100 | $2,400 | $2.18 | 44d | 1 | 1.22mi |
| 1000 Crane Brook Way Peabody, MA | 1.0–3.0 | 1.0–2.0 | 1137 | $3,991 | $3.51 | 2d | 24 | 1.27mi |
HOA detail
- Monthly dues
- $275 · $3,300/yr
Listing history 7 events
-
2026-06-18days on market $199,900 Active 7 DOM
-
2026-06-17days on market $199,900 Active 6 DOM
-
2026-06-16days on market $199,900 Active 5 DOM
-
2026-06-15statusdays on market $199,900 Active 4 DOM
-
2026-06-13days on market $199,900 New 2 DOM
-
2026-06-13remarks 608-char remark
-
2026-06-13$199,900 New 1 DOM
ⓘ Source: listings_history table (triggers on properties + properties_extension) + one-shot
backfill from property_details.listing_events for pre-trigger history.
Climate risk First Street
- Flood 1/10 Low FEMA zone X (unshaded) · 0% chance over 30 yrs
- Wildfire 1/10 Low
- Heat 5/10 Major 7 d/yr ≥97°F today · 15 d/yr by 30 yrs out
- Wind 6/10 Major 64% chance of damaging wind over 30 yrs
- Air quality 3/10 Moderate 3 unhealthy d/yr today · 3 by 30 yrs out
Nearby sold comps map
Loading sold comps map…
Walkable amenities ~0.75 mi
Loading nearby amenities…
Taxation est. · year 1
- Rental income
- $44,532
- − Mortgage interest
- −$11,198
- − Property taxes
- −$2,998
- − Insurance
- −$1,000
- − Repairs & maintenance
- −$3,563
- − Management
- −$3,563
- − HOA
- −$3,300
- − Depreciation
- −$5,815
- Taxable income
- $13,096
- Est. tax owed @ 24.0%
- −$3,143
- After-tax cash flow
- $12,160/yr
For passive investors: Depreciation is non-cash, so a rental often shows a tax loss while cash-flowing — sheltering income. Rental losses are passive: they offset passive income freely, and up to $25,000/yr can offset ordinary (W-2) income if you actively participate and your MAGI is under $100k (phasing out to $0 by $150k); unused losses carry forward. On sale, claimed depreciation is recaptured at up to 25%, and gains may owe capital-gains tax (a 1031 exchange can defer both). Figures are a year-1 estimate at your 24.0% rate — not tax advice; consult a CPA.
Condition & rehab AI · 13 photos
This mobile home requires moderate renovations to improve its condition and increase its resale and rental value. Key areas for improvement include the kitchen and bathrooms, as well as some exterior updates.
Repairs flagged
- Moderate Kitchen cabinets — Worn and outdated appearance.
- Moderate Appliances — Old and possibly inefficient models.
- Moderate Countertops — Cluttered and worn appearance.
- Moderate Bathroom fixtures — Outdated and possibly leaking fixtures.
Value-add opportunities
- Both Painting and updating the kitchen cabinets and appliances — Fresh paint and updated appliances would significantly improve the home's curb appeal and functionality.
- Both Landscaping and curb appeal improvements — A well-maintained exterior would attract more potential buyers and renters.
- Both Refrigerator and stove replacement — Upgrading to energy-efficient appliances would improve the home's functionality and appeal to potential buyers and renters.
Renovation cost estimate screening
| Repair item | Severity | Est. cost |
|---|---|---|
| Kitchen cabinets · Worn and outdated appearance. | Moderate | $3,000–15,000 |
| Appliances · Old and possibly inefficient models. | Moderate | $3,000–15,000 |
| Countertops · Cluttered and worn appearance. | Moderate | $3,000–15,000 |
| Bathroom fixtures · Outdated and possibly leaking fixtures. | Moderate | $3,000–15,000 |
| Total estimated repair cost · 4 items | $12,000–60,000 |
Value-add ROI direction
- Both Painting and updating the kitchen cabinets and appliances — Fresh paint and updated appliances would significantly improve the home's curb appeal and functionality. ↑
- Both Landscaping and curb appeal improvements — A well-maintained exterior would attract more potential buyers and renters. ↑
- Both Refrigerator and stove replacement — Upgrading to energy-efficient appliances would improve the home's functionality and appeal to potential buyers and renters. ↑
ⓘ Cost ranges are severity-bucket heuristics (US national rule-of-thumb). Get contractor quotes + a written scope before underwriting a rehab budget.
Schools (NCES district)
- District
- Peabody
- NCES district ID
- 2509360
- Math proficiency
- 29% ▼ -13.00%
- Reading proficiency
- 40% ▼ -5.00%
- Median HH income
- $64,022
- Composite
- 31.23/100
- National rank
- #6033
- State rank
- #233 of 302 in MA
Livability — Peabody
- Score
- 79/100
- State rank
- #44
- US rank
- #2070
Category grades
Schools grade is shown separately in the Schools card above.
Census & demographics
- Census place
- Peabody, MA
- County
- Essex County · 632,995 people
- City population
- 54,474
- Metro
- Boston-Cambridge-Newton, MA-NH
- Population (ZIP)
- 54,474
- Household income
- $96,501
- Rent vs Own
- Severe rent burden
- 2570.0
Population outlook (Essex County) Hauer SSP2
- Today (2025)
- 840,920 people
- By 2030
- 872,201 · +3.7%
- By 2040
- 927,918 · +10.3%
- By 2050
- 970,206 · +15.4%
- By 2075
- 1,077,993 · +28.2%
- By 2100
- 1,103,053 · +31.2%
Race, ethnicity, and origin ACS 2023
- Neighborhood character
- Predominantly White (77%)
- Race & ethnicity
- White 77% Hispanic / Latino 12% Two or more races 10% Black 4% Asian 2%
- Hispanic origin (detail)
- Puerto Rican 2% Dominican 6%
- Common ancestry
- Russian 6% Lithuanian 4% Romanian 3%
- Foreign-born
- 17% · Canada, China
- Languages at home
- 76% English-only · Other Indo-European 11% Spanish 8% French/Haitian/Cajun 2%
Political lean MEDSL · Essex
- 2024 margin
- Strong D (+20.3) · D 59.2% · R 38.9% · Other 1.9%
- 2008→2024 swing
- 0.0pp no change · 2008: 20.3pp · 2024: 20.3pp
- All cycles
- 2024: D+20.3 2020: D+29.1 2016: D+22.5 2012: D+16.2 2008: D+20.3
Not yet ingested
- Civics
- —
Market trends
- HPI YoY
- ▼ -565.60%
- Current HPI
- 285.9699
- Rent YoY
- ▼ -0.91%
- Metro
- Boston-Cambridge-Newton, MA-NH
- State GDP YoY
- ▲ 2.28%
- F500 in state
- 38
Industry mix (Fortune 500 HQ in MA)
| Industry | F500 HQs | Revenue |
|---|---|---|
| Technology | 3 | $17B |
|
||
| Insurance | 2 | $84B |
|
||
| Retail | 2 | $76B |
|
||
| Life Sciences | 1 | $43B |
|
||
| Energy Technology | 1 | $31B |
|
||
| Aerospace / Defense | 1 | $18B |
|
||
Price history
1 event — show timeline
- 2026-06-11 Listed $199,900 MLS PIN
Cash-flow waterfall
monthlySold comps — $/sqft
last 12 mo · ≤1 miLoading sold comps…