 Fourplex
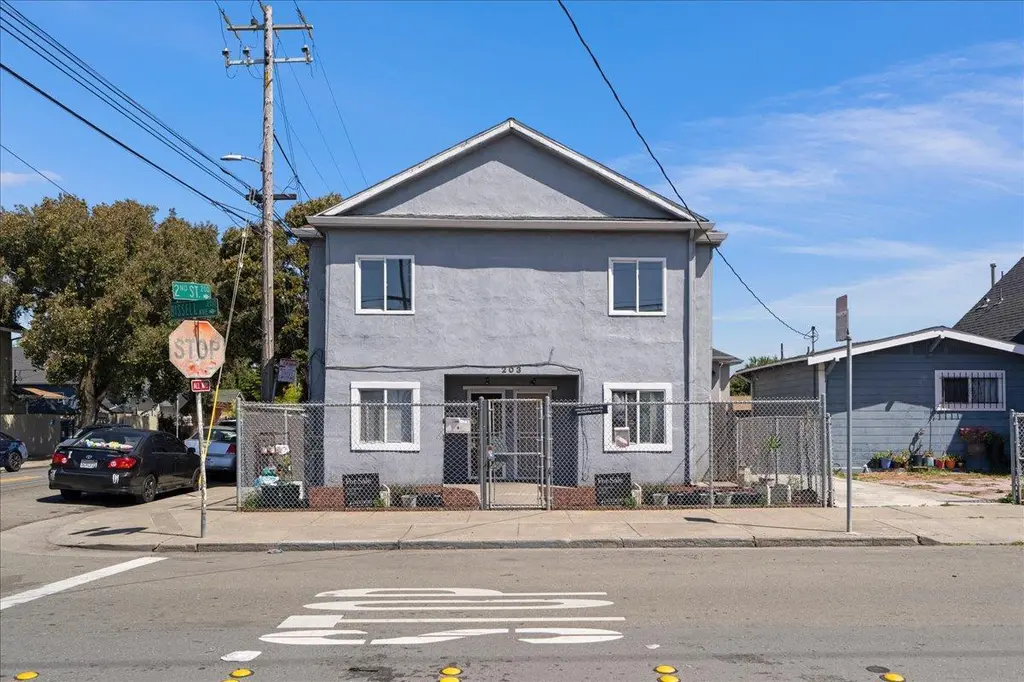
203 Bissell Ave · Richmond, CA
Flood risk 1/10 · Minimal
- FEMA flood zone
- X (unshaded)
- Chance of flooding over 30 yrs
- 0.0%
- Est. flood insurance / yr
- $507 – $1,088
Fire risk 1/10 · Minimal
- Est. fire insurance / yr
- $659 – $1,223
Heat risk 4/10 · Minor
- Hot days now (above 84°F)
- 7 days/yr
- Hot days in 30 yrs
- 16 days/yr
Wind risk 1/10 · Minimal
- Chance of severe wind over 30 yrs
- —
Air-quality risk 8/10 · Major
- Unhealthy air days now
- 14 days/yr
- Unhealthy air days in 30 yrs
- 14 days/yr
Risk factors via First Street. Map © Google.
Why this score? — see what drove the D+ grade
The composite is a weighted blend of 9 inputs, each scored 0–100. Each bar is that input's sub-score; the figure is the points it added to the 100-point composite (weight × sub-score).
- Cash flow +20.6/30.0
- DSCR +6.5/10.0
- 1% rule +5.8/10.0
- Rent growth +3.5/5.0
- Livability +3.1/5.0
- Schools +3.0/10.0
- Condition / age +2.5/5.0
- ARV discount +0.0/15.0
- Appreciation +0.0/10.0
$999,000
🖨 Deal sheet (PDF) 📄 Offer letter ✓ Due diligence
Multi-family units
County records classify this as Multi-Family (2-4 Unit). Listing-text estimate: 4 units. confirmed
Listing remarks MLS
Marcus & Millichap is pleased to present 203 Bissell Ave, offered at $1,150,000, 203 Bissell Ave is a 4 unit multifamily property located in Richmonds Iron Triangle neighborhood. Built in 1908, the property totals approximately 3,932 SF on a 0.08acre lot and is currently 50% occupied, presenting a clear value add and leaseup opportunity. The unit mix consists of one 4BD/2BA unit, two 4BD/1BA units, and one co-living layout, with inplace rents estimated ~13% below market. Utilities are efficiently structured with separately metered gas and electric and master metered water. Street parking only. Financial highlights include an 8.90% current cap rate and a 10.64% pro forma cap rate, supported by strong rent growth potential and operational upside. The property is within close proximity to Richmond BART & Amtrak ( 1.3 miles), major freeways (I80, I580, SR4), Kaiser Permanente Richmond Medical Center, and regional employment hubs. An ideal opportunity for investors seeking high yield, upside through rent increases, and a well-located small multifamily asset in the East Bay.
Key facts
- 9,800 sq ft lot
- Built 1908
- Listed 52 days
Property features AI
Finance
- Financial info: Annual rental income approximately $144,637; Annual gross income approximately $141,462; Gross scheduled income approximately $145,837; Other income $1,200; Total expenses $39,183; Other expenses $3,228; Trash expense $2,700; Utility expenses $4,020; Landscape expense $1,000; Vacancy factor 3%; Gross rent multiplier 7.89
Exterior
- Parking: On-street parking
- Utilities: Public water; Public sewer; Public utilities; Primary water meter
- Home design: Single-story building; Multi-family building (4 units)
- Construction: Concrete perimeter foundation; One building
- Exterior features: Rolled composition roof; Tenants pay electric and gas utilities
Interior
- Bedrooms: Three 4-bedroom units
- Bathrooms: Two 2-bath units and one 1-bath unit
- Heating & cooling: Gas heating
- Interior features: Coin-operated laundry
- Laundry & utility: Coin-operated laundry
Neighborhood map
What this means for you Summary
Snapshot
- This is a 4 × 3-bed/?-bath units multifamily listed at $999k.
Deal economics
- At list price, monthly cash flow is $1k ($16k/yr) — positive. Per door: $333/mo.
- The deal already cash-flows at list — no discount required.
- Meets the 1% rule at list price ($11k rent vs $999k).
- Recommended offer: $969k (3.0% below list) — sets the bar for market timing.
- Cap rate 7.9% vs local median 2.7% in Richmond — top-decile yield for the area; either an underpriced asset or a hidden risk that comps aren't pricing in. Stress-test before assuming the spread holds.
Location & tenants
- Location reads 62/100 on livability (#497 in CA) — a middle-class / working-renter tenant base. Strengths: commute A+, employment A, health & safety B+; Watch: crime F, amenities F, cost of living F.
- West Contra Costa Unified (suburban): math 24% / reading 35% proficiency, ranked #993 of 1,400 in CA (top 71%) — low school quality limits family demand, transient renter base, plan for 1-2y turnover.
- Zoned schools: Lincoln Elementary (316 students, 56% FRL); Lovonya Dejean Middle (404 students, 69% FRL); John F. Kennedy High (823 students, 66% FRL) — zoned schools at 63% FRL track the district average.
- Market conditions: Rents rising (+4.0%/yr); 101 active listings in the ZIP; solid renter incomes; 2,169 units permitted in Contra Costa County in 2024 (896 in 5+ unit buildings).
- At $10,832/mo this rent would consume 159% of the median local household income ($82k/yr) (locally 1277% of renters already pay >50% of income on rent) — very limited rent-growth headroom before tenants either downsize or default.
Forward outlook
- Local home prices are declining (-3.0%/yr); year-one equity from $7k of loan paydown is wiped out by about $30k of value loss. Plan a longer hold.
- Contra Costa County population projected at +26% by 2050 — long-run rental-demand tailwind backs the buy-and-hold thesis.
Negotiation context
- It's been on market 52 days — a 3% lower offer ($969k) is reasonable based on typical stale-listing flexibility.
- 13 sale attempts since 22y ago; this cycle's ask has dropped $151k (13%) from the opening price — seller is motivated, your offer sets the floor, not the list.
Risks & watch-outs
- Watch-outs: built in 1908 — expect roof / HVAC / electrical / plumbing capex.
Questions for the listing agent
- It's been on market 52 days. Have you received any prior offers? Is the seller open to a 3% concession, seller financing, or rate buy-down credit?
- Can we see the unit-by-unit rent roll, current vacancy, and any below-market leases? What's the average tenancy length?
- What capital expenditures (roof, boiler, parking lot, exteriors) have been made in the last 5 years, and what's planned in the next 2?
- Built in 1908 — when were the roof, HVAC, electrical panel, plumbing, and water heater last replaced?
- Is there a deadline driving the sale (1031 exchange, divorce, estate, relocation)? That informs how much negotiation room exists.
- Schools are F-rated, which usually means shorter tenancies and higher turnover. Who's the typical renter profile here, and what's been the actual vacancy rate?
- Crime grade is F in this area — have there been break-ins, vandalism, or insurance claims at this property in the last 3 years? What carrier currently insures it and at what premium?
- The area grade is low — what's the realistic commute time and amenity access for the typical tenant pool here? Any planned neighborhood developments (good or bad) we should know about?
- What's the average days-on-market for RENTAL listings here right now (not sales)? A rising rental-DOM trend means longer vacancies and softer asking-rent achievability than the comps imply.
- What's the recent tenant-quality profile in this submarket — average credit score on applications, eviction rate, late-payment / NSF rate, and stable-employment percentage? A property-management company in the area should have these aggregated.
- How much new apartment / multifamily construction is in the pipeline within 1–3 miles? Heavy new supply (>2% of stock underway) typically softens rents 12–24 months out; light construction supports rent growth.
Investment metrics
- 1% rule
- 1.08% ✓
- Cap rate
- 7.89%
- Cash-on-cash
- 5.72%
- DSCR
- 1.25
- GRM
- 7.7
CMA / ARV
- ARV (median comp)
- $809,622
- List price
- $999,000
- Delta
- 23.39%
- Verdict
- OVERPRICED
- Comps
- 9 within 1.0 mi
Show comp detail 1 sale within ~0.75 mi
| Address | Dist | Beds/Ba | Sqft | Sold | Price | $/sf | Match |
|---|---|---|---|---|---|---|---|
| 428 9th St | 0.68mi | 11/4.0 (-1) | 3,562 (-9%) | 2mo | $710,000 | $199 | 42 |
Match score weights: distance 35% · size 25% · config 20% · recency 20%. Top-matched comps best support the ARV.
Projected returns pro-forma
-3.0% appreciation · 3.98% rent growth · sell at horizon
- IRR
- -6.3%
- Equity multiple
- 0.76×
- Total profit
- $-65,877
- Equity at exit
- $148,954
- IRR
- 4.6%
- Equity multiple
- 1.35×
- Total profit
- $98,517
- Equity at exit
- $86,375
Cash invested: $279,720 (down + closing). Projections, not guarantees.
Landlord ↔ Tenant lean methodology
- Overall (STATE)
- 18 Strongly Tenant-Friendly
- State California
- 18 Strongly Tenant-Friendly · D+13
- County
- — inherits STATE
- City
- — inherits STATE
ZIP-level market 94801
- Rents YoY
- 4.0%
- Active inventory
- 101
- Price-to-rent
- 30.7×
Monthly cashflow live
- Estimated rent
- $10,832 high interval (Pro) →
- Mortgage (P&I)
- −$5,239
- Tax from tax record
- −$1,570 /mo · $18,838/yr
- Insurance
- −$416
- HOA
- −$0
- Vacancy / Maint / Mgmt
- −$2,275
- Net cashflow
- $1,332
Break-even live
Sensitivity live
| Price | -10% $1,898 | -5% $1,615 | +0% $1,332 | +5% $1,050 | +10% $767 |
|---|---|---|---|---|---|
| Rent | -10% $477 | -5% $905 | +0% $1,332 | +5% $1,760 | +10% $2,188 |
| Rate | -1.0pp $1,835 | -0.5pp $1,586 | base $1,332 | +0.5pp $1,074 | +1.0pp $810 |
4-unit breakdown (identical units grouped — click to expand)
| Units | Beds | Baths | Est. rent |
|---|---|---|---|
| 4× units | 3 | — | $10,832 |
| #1 | 3 | — | $2,708 |
| #2 | 3 | — | $2,708 |
| #3 | 3 | — | $2,708 |
| #4 | 3 | — | $2,708 |
| Total (4 units) | $10,832 | ||
UW: 25.0% down · 7.5% · 30yr · 1.5% tax · 5.0% vac · 8.0% maint · 8.0% mgmt
Financing live
Cash to close
- Down payment
- $249,750
- Closing costs
- $29,970
- Reserves months
- —
- Total cash needed
- —
Loan-product check · same deal, 3 products live
Conventional
25% down · 7.5% · 30yr
- Down + closing
- —
- Monthly P&I
- —
- Monthly cashflow
- —
- DSCR
- —
- Eligible?
- —
Personal DTI + credit; lowest rate.
DSCR
20% down · 8.5% · 30yr
- Down + closing
- —
- Monthly P&I
- —
- Monthly cashflow
- —
- DSCR
- —
- Eligible?
- —
No personal income docs; deal must DSCR.
Hard money
10% down · 12.0% · 12mo
- Down + closing
- —
- Monthly P&I
- —
- Monthly cashflow
- —
- DSCR
- —
- Eligible?
- —
Short-term bridge; refi at stabilization.
Listing history 50 events
-
2026-06-21days on market $999,000 Active 52 DOM
-
2026-06-18days on market $999,000 Active 49 DOM
-
2026-06-17days on market $999,000 Active 48 DOM
-
2026-06-16days on market $999,000 Active 47 DOM
-
2026-06-15days on market $999,000 Active 46 DOM
-
2026-06-13days on market $999,000 Active 44 DOM
-
2026-06-13days on market $999,000 Active 43 DOM
-
2026-06-09days on market $999,000 Active 40 DOM
-
2026-06-08days on market $999,000 Active 39 DOM
-
2026-06-07days on market $999,000 Active 38 DOM
-
2026-06-04days on market $999,000 Active 35 DOM
-
2026-06-03days on market $999,000 Active 34 DOM
-
2026-06-02days on market $999,000 Active 33 DOM
-
2026-06-01days on market $999,000 Active 32 DOM
-
2026-05-31days on market $999,000 Active 31 DOM
-
2026-04-30$1,150,000 Active 1093-char remark
Show marketing remark (1093 chars)
Marcus & Millichap is pleased to present 203 Bissell Ave, offered at $1,150,000, 203 Bissell Ave is a 4 unit multifamily property located in Richmonds Iron Triangle neighborhood. Built in 1908, the property totals approximately 3,932 SF on a 0.08acre lot and is currently 50% occupied, presenting a clear value add and leaseup opportunity. The unit mix consists of one 4BD/2BA unit, two 4BD/1BA units, and one co-living layout, with inplace rents estimated ~13% below market. Utilities are efficiently structured with separately metered gas and electric and master metered water. Street parking only. Financial highlights include an 8.90% current cap rate and a 10.64% pro forma cap rate, supported by strong rent growth potential and operational upside. The property is within close proximity to Richmond BART & Amtrak ( 1.3 miles), major freeways (I80, I580, SR4), Kaiser Permanente Richmond Medical Center, and regional employment hubs. An ideal opportunity for investors seeking high yield, upside through rent increases, and a well-located small multifamily asset in the East Bay.
-
2026-03-24historical
-
2026-01-23price
-
2025-11-04Active
-
2025-05-19historical
-
2025-04-07price
-
2025-03-10price
-
2025-01-02status Active
-
2025-01-02price
-
2024-12-21historical
-
2024-10-31price
-
2024-10-18price
-
2024-07-25Active
-
2023-10-13historical
-
2023-08-09price
-
2023-06-08price
-
2023-05-17status Back On Market
-
2023-05-05historical
-
2023-04-18price
-
2023-03-21price
-
2023-02-22New
-
2018-07-20soldstatus $875,000 Sold
-
2018-07-16soldstatus $875,000
-
2018-06-27status Pending
-
2018-05-19price $1,049,000
-
2018-04-26$1,099,000 New
-
2016-02-13soldstatus $495,000 Sold
-
2016-02-11soldstatus $495,000 Closed
-
2016-02-11soldstatus $495,000
-
2016-01-31status Pending
-
2015-10-29status Contingent - Show
-
2015-10-29historical Contingent
-
2015-10-02price $499,000
-
2015-10-02price $499,000
ⓘ Source: listings_history table (triggers on properties + properties_extension) + one-shot
backfill from property_details.listing_events for pre-trigger history.
Tax reassessment forecast CA · Resets to sale price
- Current annual tax
- $18,838 · $1,570/mo
- Projected year-2 tax
- $18,838 · $1,570/mo
- Expected delta
- $0/yr ($0/mo · 0.0%)
ⓘ Screening estimate from a state-policy table — verify with the county assessor before closing.
Climate risk First Street
- Flood 1/10 Low FEMA zone X (unshaded) · 0% chance over 30 yrs
- Wildfire 1/10 Low
- Heat 4/10 Moderate 7 d/yr ≥84°F today · 16 d/yr by 30 yrs out
- Wind 1/10 Low
- Air quality 8/10 Severe 14 unhealthy d/yr today · 14 by 30 yrs out
Nearby sold comps map
Loading sold comps map…
Walkable amenities ~0.75 mi
Loading nearby amenities…
Taxation est. · year 1
- Rental income
- $129,984
- − Mortgage interest
- −$55,960
- − Property taxes
- −$18,838
- − Insurance
- −$4,995
- − Repairs & maintenance
- −$10,399
- − Management
- −$10,399
- − Depreciation
- −$29,062
- Taxable income
- $333
- Est. tax owed @ 24.0%
- −$80
- After-tax cash flow
- $15,909/yr
For passive investors: Depreciation is non-cash, so a rental often shows a tax loss while cash-flowing — sheltering income. Rental losses are passive: they offset passive income freely, and up to $25,000/yr can offset ordinary (W-2) income if you actively participate and your MAGI is under $100k (phasing out to $0 by $150k); unused losses carry forward. On sale, claimed depreciation is recaptured at up to 25%, and gains may owe capital-gains tax (a 1031 exchange can defer both). Figures are a year-1 estimate at your 24.0% rate — not tax advice; consult a CPA.
Schools (NCES district)
- District
- West Contra Costa Unified
- NCES district ID
- 0632550
- Math proficiency
- 24% ▲ 1.00%
- Reading proficiency
- 35% ▲ 1.00%
- Median HH income
- $64,837
- Composite
- 30.04/100
- National rank
- #11623
- State rank
- #993 of 1400 in CA
Livability — Richmond
- Score
- 62/100
- State rank
- #497
- US rank
- #16759
Category grades
Schools grade is shown separately in the Schools card above.
Census & demographics
- Census place
- Richmond, CA
- County
- Contra Costa County · 1,059,880 people
- City population
- 183,357
- Metro
- San Francisco-Oakland-Berkeley, CA
- Population (ZIP)
- 33,591
- Household income
- $81,728
- Rent vs Own
- Severe rent burden
- 1277.0
Population outlook (Contra Costa County) Hauer SSP2
- Today (2025)
- 1,287,720 people
- By 2030
- 1,364,937 · +6.0%
- By 2040
- 1,506,209 · +17.0%
- By 2050
- 1,624,373 · +26.1%
- By 2075
- 1,853,193 · +43.9%
- By 2100
- 1,901,231 · +47.6%
Race, ethnicity, and origin ACS 2023
- Neighborhood character
- Predominantly Hispanic (66%)
- Race & ethnicity
- Hispanic / Latino 66% Two or more races 19% White 12% Black 11% Asian 6% Native American 3%
- Hispanic origin (detail)
- Mexican 42%
- Common ancestry
- Italian 3% Lithuanian 1% Swedish 1%
- Foreign-born
- 40% · Canada, China, Vietnam
- Languages at home
- 32% English-only · Spanish 61% Other Asian/Pacific 3% Chinese 2%
Political lean MEDSL · Contra Costa
- 2024 margin
- Solid D (+38.0) · D 67.3% · R 29.4% · Other 3.3%
- 2008→2024 swing
- +0.2pp no change · 2008: 37.8pp · 2024: 38.0pp
- All cycles
- 2024: D+38.0 2020: D+45.3 2016: D+43.5 2012: D+33.7 2008: D+37.8
Not yet ingested
- Civics
- —
Market trends
- HPI YoY
- ▼ -334.07%
- Current HPI
- 390.1045
- Rent YoY
- ▲ 3.98%
- Metro
- San Francisco-Oakland-Berkeley, CA
- State GDP YoY
- ▲ 3.21%
- F500 in state
- 116
Industry mix (Fortune 500 HQ in CA)
| Industry | F500 HQs | Revenue |
|---|---|---|
| Technology | 27 | $1,492B |
|
||
| Financial Services | 3 | $174B |
|
||
| Retail | 3 | $44B |
|
||
| Insurance | 3 | $26B |
|
||
| Media / Entertainment | 2 | $115B |
|
||
| Pharmaceuticals / Biotech | 2 | $62B |
|
||
Price history
+2336.6% since first listed56 events — show timeline
- 2026-05-21 Price Changed $999,000 bridgeMLS, Bay East AOR, or Contra Costa AOR
- 2026-05-21 Price Changed $999,000 MLSListings
- 2026-04-30 Listed $1,150,000 MLSListings
- 2026-04-30 Listed $1,150,000 bridgeMLS, Bay East AOR, or Contra Costa AOR
- 2026-03-24 Listing Removed — bridgeMLS, Bay East AOR, or Contra Costa AOR
- 2026-01-23 Price Changed — bridgeMLS, Bay East AOR, or Contra Costa AOR
- 2025-11-04 Listed — bridgeMLS, Bay East AOR, or Contra Costa AOR
- 2025-05-19 Listing Removed — bridgeMLS, Bay East AOR, or Contra Costa AOR
- 2025-04-07 Price Changed — bridgeMLS, Bay East AOR, or Contra Costa AOR
- 2025-03-10 Price Changed — bridgeMLS, Bay East AOR, or Contra Costa AOR
- 2025-01-02 Relisted — bridgeMLS, Bay East AOR, or Contra Costa AOR
- 2025-01-02 Price Changed — bridgeMLS, Bay East AOR, or Contra Costa AOR
- 2024-12-21 Listing Removed — bridgeMLS, Bay East AOR, or Contra Costa AOR
- 2024-10-31 Price Changed — bridgeMLS, Bay East AOR, or Contra Costa AOR
- 2024-10-18 Price Changed — bridgeMLS, Bay East AOR, or Contra Costa AOR
- 2024-07-25 Listed — bridgeMLS, Bay East AOR, or Contra Costa AOR
- 2023-10-13 Listing Removed — bridgeMLS, Bay East AOR, or Contra Costa AOR
- 2023-08-09 Price Changed — bridgeMLS, Bay East AOR, or Contra Costa AOR
- 2023-06-08 Price Changed — bridgeMLS, Bay East AOR, or Contra Costa AOR
- 2023-05-17 Relisted — bridgeMLS, Bay East AOR, or Contra Costa AOR
- 2023-05-05 Listing Removed — bridgeMLS, Bay East AOR, or Contra Costa AOR
- 2023-04-18 Price Changed — bridgeMLS, Bay East AOR, or Contra Costa AOR
- 2023-03-21 Price Changed — bridgeMLS, Bay East AOR, or Contra Costa AOR
- 2023-02-22 Listed — bridgeMLS, Bay East AOR, or Contra Costa AOR
- 2018-07-20 Sold (MLS) $875,000 bridgeMLS, Bay East AOR, or Contra Costa AOR
- 2018-07-16 Sold (Public Records) $875,000 Public Records
- 2018-06-27 Pending — bridgeMLS, Bay East AOR, or Contra Costa AOR
- 2018-05-19 Price Changed $1,049,000 bridgeMLS, Bay East AOR, or Contra Costa AOR
- 2018-04-26 Listed $1,099,000 bridgeMLS, Bay East AOR, or Contra Costa AOR
- 2016-02-13 Sold (MLS) $495,000 bridgeMLS, Bay East AOR, or Contra Costa AOR
- 2016-02-11 Sold (Public Records) $495,000 Public Records
- 2016-01-31 Pending — bridgeMLS, Bay East AOR, or Contra Costa AOR
- 2015-10-29 Contingent — bridgeMLS, Bay East AOR, or Contra Costa AOR
- 2015-10-02 Price Changed $499,000 bridgeMLS, Bay East AOR, or Contra Costa AOR
- 2015-07-17 Price Changed $510,000 bridgeMLS, Bay East AOR, or Contra Costa AOR
- 2015-06-16 Price Changed $530,000 bridgeMLS, Bay East AOR, or Contra Costa AOR
- 2015-05-27 Relisted — bridgeMLS, Bay East AOR, or Contra Costa AOR
- 2015-05-15 Contingent — bridgeMLS, Bay East AOR, or Contra Costa AOR
- 2015-05-04 Price Changed $550,000 bridgeMLS, Bay East AOR, or Contra Costa AOR
- 2015-04-12 Listed $575,000 bridgeMLS, Bay East AOR, or Contra Costa AOR
- 2014-02-21 Sold (MLS) $511,500 bridgeMLS, Bay East AOR, or Contra Costa AOR
- 2014-02-19 Sold (Public Records) $511,500 Public Records
- 2014-01-12 Contingent — bridgeMLS, Bay East AOR, or Contra Costa AOR
- 2013-10-03 Listed $525,000 bridgeMLS, Bay East AOR, or Contra Costa AOR
- 2008-12-19 Sold (MLS) $95,000 bridgeMLS, Bay East AOR, or Contra Costa AOR
- 2008-11-06 Listing Removed — bridgeMLS, Bay East AOR, or Contra Costa AOR
- 2008-09-05 Listed $104,500 bridgeMLS, Bay East AOR, or Contra Costa AOR
- 2005-08-08 Sold (Public Records) $765,000 Public Records
- 2004-04-12 Sold (Public Records) $560,000 Public Records
- 2004-04-12 Sold (MLS) $560,000 bridgeMLS, Bay East AOR, or Contra Costa AOR
- 2004-02-25 Listing Removed — bridgeMLS, Bay East AOR, or Contra Costa AOR
- 2004-02-18 Listed $559,000 bridgeMLS, Bay East AOR, or Contra Costa AOR
- 2001-08-01 Sold (Public Records) $314,000 Public Records
- 2000-04-04 Sold (Public Records) $165,000 Public Records
- 1998-05-22 Sold (Public Records) $89,000 Public Records
- 1993-12-23 Sold (Public Records) $41,000 Public Records
Property tax history
+2.8%/yrLatest (2025): $18,838 · +1.7% YoY. Source: county tax records.
Cash-flow waterfall
monthlySold comps — $/sqft
last 12 mo · ≤1 miLoading sold comps…