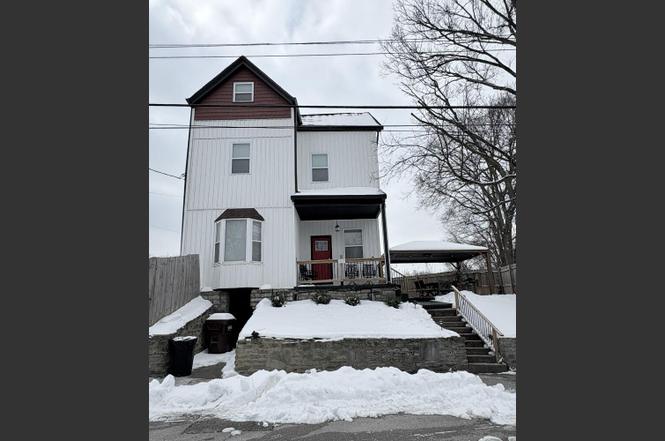
361 Bond St · Covington, KY
Flood risk 1/10 · Minimal
- FEMA flood zone
- X (unshaded)
- Chance of flooding over 30 yrs
- 0.0%
- Est. flood insurance / yr
- $507 – $1,088
Fire risk 1/10 · Minimal
- Est. fire insurance / yr
- $839 – $1,559
Heat risk 4/10 · Minor
- Hot days now (above 103°F)
- 7 days/yr
- Hot days in 30 yrs
- 19 days/yr
Wind risk 2/10 · Minimal
- Chance of severe wind over 30 yrs
- 1.0%
Air-quality risk 3/10 · Minor
- Unhealthy air days now
- 2 days/yr
- Unhealthy air days in 30 yrs
- 3 days/yr
Risk factors via First Street. Map © Google.
Why this score? — see what drove the D- grade
The composite is a weighted blend of 9 inputs, each scored 0–100. Each bar is that input's sub-score; the figure is the points it added to the 100-point composite (weight × sub-score).
- Cash flow +16.7/30.0
- DSCR +5.2/10.0
- Livability +4.3/5.0
- 1% rule +3.3/10.0
- Rent growth +2.5/5.0
- Condition / age +2.5/5.0
- Schools +1.5/10.0
- ARV discount +0.0/15.0
- Appreciation +0.0/10.0
$299,900
🖨 Deal sheet (PDF) 📄 Offer letter ✓ Due diligence
Listing remarks MLS
Investment opportunity, 4 BR 1 Ba, three floors. Home needs renovation. It likely will not qualify for a mortgage. Being sold as is, and the sales price is firm. There is no power, water or gas on in the house.
Key facts
- New siding
- New carpet
- New appliances
Tags
Property features AI
Exterior
- Parking: Garage; 2-car garage
- Utilities: Public water; Public sewer
- Home design: Single family residence; Three or more levels; Built in 1910
- Construction: Vinyl siding; Stone foundation
- Exterior features: Privacy fencing; Vinyl clad windows; Shingle roof
Interior
- Kitchen: Electric cooktop; Microwave; Refrigerator
- Bedrooms: Primary bedroom (12 x 12); Bedroom 2 (13 x 12); Bedroom 3 (8 x 11); Bedroom 4 (30 x 24)
- Bathrooms: 2 full bathrooms; Primary bath (4 x 10); Bathroom 2 (11 x 6)
- Heating & cooling: Central air; Has heating
- Interior features: Granite counters; Electric fireplace; Accessible full bathroom; Accessible kitchen
- Laundry & utility: Washer; Dryer (laundry on main level)
Neighborhood map
What this means for you Summary
Snapshot
- This is a 4-bed/1.0-bath single-family listed at $300k.
Deal economics
- At list price, monthly cash flow is $189 ($2k/yr) — positive.
- The deal already cash-flows at list — no discount required.
- To meet the 1% rule (rent ≥ 1% of price), the offer needs to be $249k (16.9% below list).
- Recommended offer: $249k (16.9% below list) — sets the bar for 1% rule.
- Cap rate 7.0% vs local median 5.3% in Covington — top-decile yield for the area; either an underpriced asset or a hidden risk that comps aren't pricing in. Stress-test before assuming the spread holds.
Location & tenants
- Location reads 86/100 on livability (#40 in KY, #376 nationally) — a professional / high-income tenant draw. Strengths: amenities A+, commute A+, cost of living A+; Watch: employment D+.
- Covington Independent (suburban): math 10% / reading 27% proficiency, ranked #162 of 165 in KY (top 98%) — low school quality limits family demand, transient renter base, plan for 1-2y turnover; 78% free/reduced lunch — lower-income household profile, screen leases tightly.
- Zoned schools: John G Carlisle Elementary (math 2% / reading 27%, grade F, #620 of 676 statewide, top 93%, 304 students, 81% FRL); Holmes Middle School (math 8% / reading 26%, grade F, #211 of 217 statewide, top 97%, 656 students, 84% FRL); Holmes High School (math 12% / reading 17%, grade F, #227 of 254 statewide, top 89%, 878 students, 80% FRL) — zoned schools at 82% FRL track the district average.
- Market conditions: 92 active listings in the ZIP; 6 comparable units currently listed for rent nearby; rentals at typical pace (median 17d on market — plan ~3-4 weeks tenant-placement turnaround); 699 units permitted in Kenton County in 2024 (287 in 5+ unit buildings).
- This rent runs 42% of the median local income ($71k/yr) — at the standard rent-burdened threshold; future hikes will face affordability resistance.
Forward outlook
- Local home prices are declining (-3.0%/yr); year-one equity from $2k of loan paydown is wiped out by about $9k of value loss. Plan a longer hold.
- Kenton County population projected at +5% by 2050 — modest demand growth; plan on rents tracking national, not racing it.
Negotiation context
- It's been on market 136 days — a 12% lower offer ($264k) is reasonable based on typical stale-listing flexibility.
- 7 sale attempts since 24y ago; this cycle's ask has dropped $25k (8%) from the opening price — seller is motivated, your offer sets the floor, not the list.
- Current owner paid $55k; list at $300k implies a 445% gain — meaningful room to come down on a strong offer.
Risks & watch-outs
- Watch-outs: built in 1910 — expect roof / HVAC / electrical / plumbing capex.
Questions for the listing agent
- It's been on market 136 days. Have you received any prior offers? Is the seller open to a 17% concession, seller financing, or rate buy-down credit?
- Built in 1910 — when were the roof, HVAC, electrical panel, plumbing, and water heater last replaced?
- Why hasn't it sold? Are there any deal-killer items the seller is aware of (foundation, flood, title, zoning, code violations)?
- Is there a deadline driving the sale (1031 exchange, divorce, estate, relocation)? That informs how much negotiation room exists.
- The area grade is low — what's the realistic commute time and amenity access for the typical tenant pool here? Any planned neighborhood developments (good or bad) we should know about?
- What's the average days-on-market for RENTAL listings here right now (not sales)? A rising rental-DOM trend means longer vacancies and softer asking-rent achievability than the comps imply.
- What's the recent tenant-quality profile in this submarket — average credit score on applications, eviction rate, late-payment / NSF rate, and stable-employment percentage? A property-management company in the area should have these aggregated.
- How much new for-sale + rental construction is in the pipeline within 1–3 miles? Heavy new supply typically softens prices + rents 12–24 months out; constrained supply supports both.
Investment metrics
- 1% rule
- 0.83% ✗
- Cap rate
- 7.05%
- Cash-on-cash
- 2.70%
- DSCR
- 1.12
- GRM
- 10.0
CMA / ARV
- ARV (on-the-fly)
- $222,080
- Comps found
- 12
Show comp detail 12 sales within ~0.75 mi
| Address | Dist | Beds/Ba | Sqft | Sold | Price | $/sf | Match |
|---|---|---|---|---|---|---|---|
| 217 Montclair Ave | 0.20mi | 3/2.0 (-1) | 1,418 (+2%) | 3mo | $227,500 | $160 | 76 |
| 401 Montclair Ave | 0.14mi | 3/2.0 (-1) | 1,402 (+1%) | 9mo | $230,000 | $164 | 75 |
| 1216 High St | 0.22mi | 3/1.0 (-1) | 1,418 (+2%) | 14mo | $74,900 | $53 | 70 |
| 134 Highway Ave | 0.26mi | 3/1.5 (-1) | 1,255 (-10%) | 6mo | $250,000 | $199 | 60 |
| 1307 Highway Ave | 0.19mi | 3/2.0 (-1) | 1,524 (+10%) | 8mo | $229,800 | $151 | 59 |
| 435 Hazen St | 0.26mi | 4/2.0 | 1,578 (+14%) | 3mo | $259,900 | $165 | 59 |
| 612 Altamont Rd | 0.28mi | 3/3.0 (-1) | 1,440 (+4%) | 11mo | $249,900 | $174 | 58 |
| 1320 Hwy Ave | 0.16mi | 3/2.0 (-1) | 1,532 (+10%) | 12mo | $210,000 | $137 | 56 |
| 50 Elm St | 0.50mi | 3/2.0 (-1) | 1,411 (+2%) | 13mo | $174,900 | $124 | 54 |
| 427 Highway Ave | 0.20mi | 3/1.0 (-1) | 1,596 (+15%) | 11mo | $183,000 | $115 | 51 |
| 923 Highway Ave | 0.47mi | 3/1.5 (-1) | 1,560 (+12%) | 1mo | $325,000 | $208 | 50 |
| 233 Oak St | 0.59mi | 3/2.0 (-1) | 1,525 (+10%) | 14mo | $240,000 | $157 | 35 |
Match score weights: distance 35% · size 25% · config 20% · recency 20%. Top-matched comps best support the ARV.
Projected returns pro-forma
-3.0% appreciation · 3.0% rent growth · sell at horizon
- IRR
- -12.1%
- Equity multiple
- 0.56×
- Total profit
- $-36,696
- Equity at exit
- $44,716
- IRR
- -3.0%
- Equity multiple
- 0.80×
- Total profit
- $-17,026
- Equity at exit
- $25,930
Cash invested: $83,972 (down + closing). Projections, not guarantees.
Landlord ↔ Tenant lean methodology
- Overall (STATE)
- 83 Strongly Landlord-Friendly
- State Kentucky
- 83 Strongly Landlord-Friendly · R+16
- County
- — inherits STATE
- City
- — inherits STATE
ZIP-level market 41016
- Active inventory
- 92
- Price-to-rent
- 10.0×
Monthly cashflow live
- Estimated rent
- $2,492 medium interval (Pro) →
- Mortgage (P&I)
- −$1,573
- Tax from tax record
- −$82 /mo · $979/yr
- Insurance
- −$125
- HOA
- −$0
- Vacancy / Maint / Mgmt
- −$523
- Net cashflow
- $189
Break-even live
Sensitivity live
| Price | -10% $359 | -5% $274 | +0% $189 | +5% $104 | +10% $19 |
|---|---|---|---|---|---|
| Rent | -10% $-8 | -5% $91 | +0% $189 | +5% $288 | +10% $386 |
| Rate | -1.0pp $340 | -0.5pp $265 | base $189 | +0.5pp $111 | +1.0pp $32 |
UW: 25.0% down · 7.5% · 30yr · 1.5% tax · 5.0% vac · 8.0% maint · 8.0% mgmt
Financing live
Cash to close
- Down payment
- $74,975
- Closing costs
- $8,997
- Reserves months
- —
- Total cash needed
- —
Loan-product check · same deal, 3 products live
Conventional
25% down · 7.5% · 30yr
- Down + closing
- —
- Monthly P&I
- —
- Monthly cashflow
- —
- DSCR
- —
- Eligible?
- —
Personal DTI + credit; lowest rate.
DSCR
20% down · 8.5% · 30yr
- Down + closing
- —
- Monthly P&I
- —
- Monthly cashflow
- —
- DSCR
- —
- Eligible?
- —
No personal income docs; deal must DSCR.
Hard money
10% down · 12.0% · 12mo
- Down + closing
- —
- Monthly P&I
- —
- Monthly cashflow
- —
- DSCR
- —
- Eligible?
- —
Short-term bridge; refi at stabilization.
Rent comps 6 comps
| Address | Beds | Baths | Sqft | Rent | $/sqft | DOM | Units | Dist |
|---|---|---|---|---|---|---|---|---|
| 22 Swain Ct Covington, KY | 1.0–3.0 | 1.0–2.0 | 951 | $2,295 | $2.41 | 3d | 3 | 0.27mi |
| 239 Forest Ave Ludlow, KY | 3.0 | 1.0 | 1146 | $1,395 | $1.22 | 19d | 1 | 0.68mi |
| 2454 River Rd Unit 2 Cincinnati, OH | 4.0 | 1.0 | 1400 | $1,595 | $1.14 | 25d | 1 | 1.15mi |
| 309 Vine St Cincinnati, OH | 1.0–3.0 | 1.0–2.0 | 955 | $3,334 | $3.49 | 3d | 15 | 1.40mi |
| 1 W 4th St Cincinnati, OH | 3.0 | 1.0–3.5 | 1675 | $9,200 | $5.49 | 4d | 96 | 1.42mi |
| 417 Vine St Cincinnati, OH | 3.0 | 2.0 | 1602 | $2,950 | $1.84 | 16d | 1 | 1.44mi |
Listing history 37 events
-
2026-06-21days on market $299,900 Active 136 DOM
-
2026-06-18days on market $299,900 Active 133 DOM
-
2026-06-17days on market $299,900 Active 132 DOM
-
2026-06-16days on market $299,900 Active 131 DOM
-
2026-06-15days on market $299,900 Active 130 DOM
-
2026-06-09days on market $299,900 Active 124 DOM
-
2026-06-08days on market $299,900 Active 123 DOM
-
2026-06-07days on market $299,900 Active 122 DOM
-
2026-06-03days on market $299,900 Active 118 DOM
-
2026-06-02days on market $299,900 Active 117 DOM
-
2026-06-01days on market $299,900 Active 116 DOM
-
2026-05-31days on market $299,900 Active 115 DOM
-
2026-05-05price $299,900
-
2026-04-07price $314,900
-
2026-03-09price $319,900
-
2026-02-04$324,900 Active
-
2024-11-26status Active
-
2024-11-26status Pending
-
2024-11-26historical
-
2024-09-17price $229,000
-
2024-08-14price $239,000
-
2024-07-24price $249,000
-
2024-07-11price $253,900
-
2024-06-28price $254,900
-
2024-06-09$259,900 Active
-
2021-11-12soldstatus $55,000 Closed 211-char remark
Show marketing remark (211 chars)
Investment opportunity, 4 BR 1 Ba, three floors. Home needs renovation. It likely will not qualify for a mortgage. Being sold as is, and the sales price is firm. There is no power, water or gas on in the house.
-
2021-10-21status Pending 211-char remark
Show marketing remark (211 chars)
Investment opportunity, 4 BR 1 Ba, three floors. Home needs renovation. It likely will not qualify for a mortgage. Being sold as is, and the sales price is firm. There is no power, water or gas on in the house.
-
2021-10-14$59,000 Active 211-char remark
Show marketing remark (211 chars)
Investment opportunity, 4 BR 1 Ba, three floors. Home needs renovation. It likely will not qualify for a mortgage. Being sold as is, and the sales price is firm. There is no power, water or gas on in the house.
-
2012-03-22soldstatus $15,000
-
2011-07-01$18,000
-
2005-03-22soldstatus $21,500
-
2005-02-02$23,000
-
2003-08-23historical
-
2002-08-23$65,000
-
1998-07-01soldstatus $15,000
-
1989-08-14soldstatus $25,000
-
1987-07-24soldstatus $13,000
ⓘ Source: listings_history table (triggers on properties + properties_extension) + one-shot
backfill from property_details.listing_events for pre-trigger history.
Tax reassessment forecast KY · Resets to sale price
- Current annual tax
- $979 · $82/mo
- Projected year-2 tax
- $2,579 · $215/mo
- Expected delta
- +$1,600/yr (+$133/mo · 163.5%)
ⓘ Screening estimate from a state-policy table — verify with the county assessor before closing.
Climate risk First Street
- Flood 1/10 Low FEMA zone X (unshaded) · 0% chance over 30 yrs
- Wildfire 1/10 Low
- Heat 4/10 Moderate 7 d/yr ≥103°F today · 19 d/yr by 30 yrs out
- Wind 2/10 Low 100% chance of damaging wind over 30 yrs
- Air quality 3/10 Moderate 2 unhealthy d/yr today · 3 by 30 yrs out
Nearby sold comps map
Loading sold comps map…
Walkable amenities ~0.75 mi
Loading nearby amenities…
Taxation est. · year 1
- Rental income
- $29,899
- − Mortgage interest
- −$16,799
- − Property taxes
- −$979
- − Insurance
- −$1,500
- − Repairs & maintenance
- −$2,392
- − Management
- −$2,392
- − Depreciation
- −$8,724
- Taxable loss
- −$2,887
- Est. tax savings @ 24.0%
- +$693
- After-tax cash flow
- $2,962/yr
For passive investors: Depreciation is non-cash, so a rental often shows a tax loss while cash-flowing — sheltering income. Rental losses are passive: they offset passive income freely, and up to $25,000/yr can offset ordinary (W-2) income if you actively participate and your MAGI is under $100k (phasing out to $0 by $150k); unused losses carry forward. On sale, claimed depreciation is recaptured at up to 25%, and gains may owe capital-gains tax (a 1031 exchange can defer both). Figures are a year-1 estimate at your 24.0% rate — not tax advice; consult a CPA.
Schools (NCES district)
- District
- Covington Independent
- NCES district ID
- 2101350
- Math proficiency
- 10% ▼ -20.00%
- Reading proficiency
- 27% ▼ -14.00%
- Median HH income
- $33,681
- Composite
- 15.04/100
- National rank
- #9353
- State rank
- #162 of 165 in KY
Livability — Covington
- Score
- 86/100
- State rank
- #40
- US rank
- #376
Category grades
Schools grade is shown separately in the Schools card above.
Census & demographics
- Census place
- Covington, KY
- County
- Kenton County · 142,881 people
- City population
- 34,373
- Metro
- Cincinnati, OH-KY-IN
- Population (ZIP)
- 5,795
- Household income
- $71,172
- Rent vs Own
- Severe rent burden
- 95.0
Population outlook (Kenton County) Hauer SSP2
- Today (2025)
- 174,205 people
- By 2030
- 177,897 · +2.1%
- By 2040
- 182,671 · +4.9%
- By 2050
- 183,543 · +5.4%
- By 2075
- 178,977 · +2.7%
- By 2100
- 159,920 · -8.2%
Race, ethnicity, and origin ACS 2023
- Neighborhood character
- Predominantly White (79%)
- Race & ethnicity
- White 79% Two or more races 10% Hispanic / Latino 8% Black 2%
- Hispanic origin (detail)
- Mexican 5%
- Common ancestry
- Slovak 2% Romanian 1% Serbian 1%
- Foreign-born
- 1% · Canada
- Languages at home
- 95% English-only · Spanish 3% German/W. Germanic 1%
Political lean MEDSL · Kenton
- 2024 margin
- Strong R (+21.7) · D 38.2% · R 59.9% · Other 1.9%
- 2008→2024 swing
- -0.9pp no change · 2008: -20.9pp · 2024: -21.7pp
- All cycles
- 2024: R+21.7 2020: R+19.3 2016: R+26.1 2012: R+24.3 2008: R+20.9
Not yet ingested
- Civics
- —
Market trends
- HPI YoY
- ▼ -141.84%
- Current HPI
- 215.1436
- Rent YoY
- —
- Metro
- Cincinnati, OH-KY-IN
- State GDP YoY
- ▲ 1.81%
- F500 in state
- 4
Industry mix (Fortune 500 HQ in KY)
| Industry | F500 HQs | Revenue |
|---|---|---|
| Healthcare | 1 | $118B |
|
||
| Food / Beverage | 1 | $7B |
|
||
Price history
+2206.9% since first listed25 events — show timeline
- 2026-05-05 Price Changed $299,900 NKMLS
- 2026-04-07 Price Changed $314,900 NKMLS
- 2026-03-09 Price Changed $319,900 NKMLS
- 2026-02-04 Listed $324,900 NKMLS
- 2024-11-26 Relisted — NKMLS
- 2024-11-26 Pending — NKMLS
- 2024-11-26 Listing Removed — NKMLS
- 2024-09-17 Price Changed $229,000 NKMLS
- 2024-08-14 Price Changed $239,000 NKMLS
- 2024-07-24 Price Changed $249,000 NKMLS
- 2024-07-11 Price Changed $253,900 NKMLS
- 2024-06-28 Price Changed $254,900 NKMLS
- 2024-06-09 Listed $259,900 NKMLS
- 2021-11-12 Sold (MLS) $55,000 NKMLS
- 2021-10-21 Pending — NKMLS
- 2021-10-14 Listed $59,000 NKMLS
- 2012-03-22 Sold (MLS) $15,000 NKMLS
- 2011-07-01 Listed $18,000 NKMLS
- 2005-03-22 Sold (MLS) $21,500 NKMLS
- 2005-02-02 Listed $23,000 NKMLS
- 2003-08-23 Listing Removed — NKMLS
- 2002-08-23 Listed $65,000 NKMLS
- 1998-07-01 Sold (Public Records) $15,000 Public Records
- 1989-08-14 Sold (Public Records) $25,000 Public Records
- 1987-07-24 Sold (Public Records) $13,000 Public Records
Property tax history
+3.2%/yrLatest (2025): $979 · +0.7% YoY. Source: county tax records.
Cash-flow waterfall
monthlySold comps — $/sqft
last 12 mo · ≤1 miLoading sold comps…