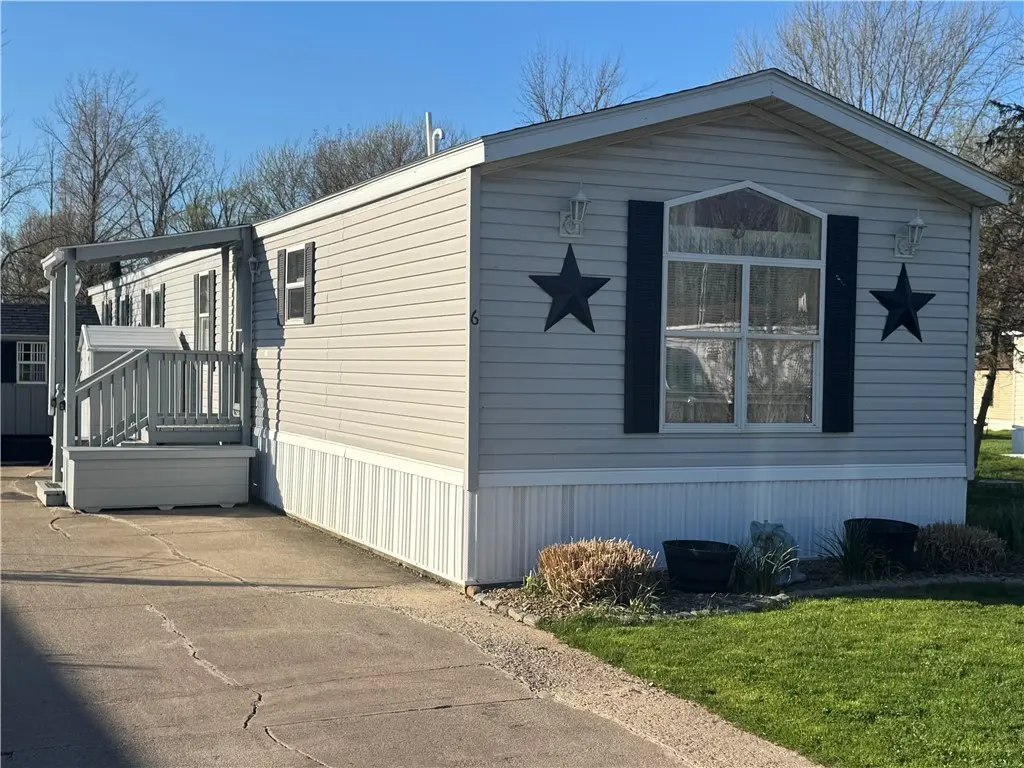
6 Redwood · Albion, NY
Flood risk 1/10 · Minimal
- FEMA flood zone
- X
- Chance of flooding over 30 yrs
- 0.0%
- Est. flood insurance / yr
- $507 – $1,088
Fire risk 2/10 · Minimal
- Est. fire insurance / yr
- $691 – $1,283
Heat risk 2/10 · Minimal
- Hot days now (above 96°F)
- 7 days/yr
- Hot days in 30 yrs
- 15 days/yr
Wind risk 1/10 · Minimal
- Chance of severe wind over 30 yrs
- —
Air-quality risk 2/10 · Minimal
- Unhealthy air days now
- 1 days/yr
- Unhealthy air days in 30 yrs
- 2 days/yr
Risk factors via First Street. Map © Google.
Why this score? — see what drove the B grade
The composite is a weighted blend of 9 inputs, each scored 0–100. Each bar is that input's sub-score; the figure is the points it added to the 100-point composite (weight × sub-score).
- Cash flow +30.0/30.0
- DSCR +10.0/10.0
- 1% rule +9.7/10.0
- ARV discount +7.5/15.0
- Condition / age +4.0/5.0
- Schools +3.7/10.0
- Livability +3.0/5.0
- Rent growth +2.5/5.0
- Appreciation +0.0/10.0
$72,500
🖨 Deal sheet 📄 Offer letter ✓ Due diligence
Listing remarks
Adorable 2–3 bedroom single-wide mobile home with 2 full bathrooms, beautifully updated and move-in ready! Freshly painted throughout, this home feels like new from the moment you step inside. You’ll be impressed by the stylish laminate flooring that adds warmth and charm to of the rooms. The spacious primary bathroom features a relaxing garden tub, barn door accent, and double (his-and-her) sinks. Built-in bookcases and bedroom storage provide both character and convenience. Outside, enjoy a lovely gazebo and storage shed, all surrounded by well-maintained flower beds filled with unique and exotic flowers—perfect for relaxing or entertaining. Major updates include a newer
Key facts
- Double sinks
- Relaxing garden tub
- Built-in bookcases
Tags
Property features AI
Finance
- HOA & community: Land lease of $615
Exterior
- Parking: No garage
- Utilities: Public water (connected); Sewer connected; Cable available; Electric with circuit breakers
- Home design: Single-story home; Single wide mobile home (Kirkwood)
- Construction: Vinyl siding; Slab foundation; Existing construction
- Exterior features: Concrete driveway; Gazebo; Shed(s); Exterior storage
Interior
- Kitchen: Gas oven; Gas range; Dishwasher; Refrigerator; Eat-in kitchen layout; Breakfast bar
- Bedrooms: 3 bedrooms on the main level; Bedroom on main level
- Flooring: Laminate flooring; Tile flooring; Varied flooring
- Bathrooms: 2 full bathrooms (2 on the main level)
- Heating & cooling: Gas forced-air heating
- Interior features: Breakfast bar; Ceiling fan(s); Cathedral ceilings; Eat-in kitchen; Skylights; Window treatments; Accessible doors
- Laundry & utility: Washer; Dryer; Main level laundry
Neighborhood map
What this means for you Summary
Snapshot
- This is a 3-bed/2.0-bath manufactured listed at $72k. Condition is rated good.
Deal economics
- At list price, monthly cash flow is $341 ($4k/yr) — positive.
- The deal already cash-flows at list — no discount required.
- Meets the 1% rule at list price ($1k rent vs $72k).
- Recommended offer: $70k (3.0% below list) — sets the bar for market timing.
- Cap rate 11.9% vs local median 4.2% in Albion — top-decile yield for the area; either an underpriced asset or a hidden risk that comps aren't pricing in. Stress-test before assuming the spread holds.
Location & tenants
- Location reads 59/100 on livability (#1,009 in NY) — a working-class tenant base; expect higher turnover. Strengths: cost of living A+, housing A-; Watch: schools C-, crime D-, amenities F.
- Albion Central School District (town): math 37% / reading 50% proficiency, ranked #479 of 590 in NY (top 81%) — families likely to look elsewhere, expect single-tenant / working-renter base with shorter leases.
- Market conditions: 43 active listings in the ZIP; 2 comparable units currently listed for rent nearby; 28 units permitted in Orleans County in 2024 (0 in 5+ unit buildings).
Forward outlook
- Local home prices are declining (-3.0%/yr); year-one equity from $501 of loan paydown is wiped out by about $2k of value loss. Plan a longer hold.
- Orleans County population projected at -20% by 2050 — secular population decline; favor cash flow + early exit over multi-decade hold.
- At projected returns (-3.0% appreciation + 3.0% rent growth), your $20k cash investment doubles in ~7 years — after that, you're playing with house money.
Negotiation context
- It's been on market 49 days — a 3% lower offer ($70k) is reasonable based on typical stale-listing flexibility.
Questions for the listing agent
- It's been on market 49 days. Have you received any prior offers? Is the seller open to a 3% concession, seller financing, or rate buy-down credit?
- Is there a deadline driving the sale (1031 exchange, divorce, estate, relocation)? That informs how much negotiation room exists.
- Crime grade is D in this area — have there been break-ins, vandalism, or insurance claims at this property in the last 3 years? What carrier currently insures it and at what premium?
- What's the average days-on-market for RENTAL listings here right now (not sales)? A rising rental-DOM trend means longer vacancies and softer asking-rent achievability than the comps imply.
- What's the recent tenant-quality profile in this submarket — average credit score on applications, eviction rate, late-payment / NSF rate, and stable-employment percentage? A property-management company in the area should have these aggregated.
- How much new for-sale + rental construction is in the pipeline within 1–3 miles? Heavy new supply typically softens prices + rents 12–24 months out; constrained supply supports both.
Investment metrics
- 1% rule
- 1.47% ✓
- Cap rate
- 11.93%
- Cash-on-cash
- 20.14%
- DSCR
- 1.90
- GRM
- 5.7
CMA / ARV
- ARV (median comp)
- $34,900
- List price
- $72,500
- Delta
- 107.74%
- Verdict
- OVERPRICED
- Comps
- 3 within 1.0 mi
Show comp detail 3 sales within ~0.75 mi
| Address | Dist | Beds/Ba | Sqft | Sold | Price | $/sf | Match |
|---|---|---|---|---|---|---|---|
| 72 Beechwood Blvd | 0.03mi | 2/2.0 (-1) | 1,240 (+2%) | 2mo | $34,900 | $28 | 89 |
| 5 Redwood Ave | 0.01mi | 3/2.0 | 1,152 (-5%) | 7mo | $65,000 | $56 | 85 |
| 7 Willow Rd | 0.15mi | 2/1.5 (-1) | 1,148 (-6%) | 21mo | $50,000 | $44 | 59 |
Match score weights: distance 35% · size 25% · config 20% · recency 20%. Top-matched comps best support the ARV.
Projected returns pro-forma
-3.0% appreciation · 3.0% rent growth · sell at horizon
- IRR
- 12.3%
- Equity multiple
- 1.49×
- Total profit
- $9,969
- Equity at exit
- $10,810
- IRR
- 21.3%
- Equity multiple
- 2.81×
- Total profit
- $36,689
- Equity at exit
- $6,268
Cash invested: $20,300 (down + closing). Projections, not guarantees.
Landlord ↔ Tenant lean methodology
- Overall (STATE)
- 15 Strongly Tenant-Friendly
- State New York
- 15 Strongly Tenant-Friendly · D+10
- County
- — inherits STATE
- City
- — inherits STATE
ZIP-level market 14411
- Home prices YoY
- -11.6%
- Active inventory
- 43
- Price-to-rent
- 5.7×
Monthly cashflow live
- Estimated rent
- $1,066 medium interval (Pro) →
- Mortgage (P&I)
- −$380
- Tax est. 1.5%
- −$91 /mo · $1,088/yr
- Insurance
- −$30
- HOA
- −$0
- Vacancy / Maint / Mgmt
- −$224
- Net cashflow
- $341
Break-even live
UW: 25.0% down · 7.5% · 30yr · 1.5% tax · 5.0% vac · 8.0% maint · 8.0% mgmt
Financing live
Cash to close
- Down payment
- $18,125
- Closing costs
- $2,175
- Reserves months
- —
- Total cash needed
- —
Loan-product check · same deal, 3 products live
Conventional
25% down · 7.5% · 30yr
- Down + closing
- —
- Monthly P&I
- —
- Monthly cashflow
- —
- DSCR
- —
- Eligible?
- —
Personal DTI + credit; lowest rate.
DSCR
20% down · 8.5% · 30yr
- Down + closing
- —
- Monthly P&I
- —
- Monthly cashflow
- —
- DSCR
- —
- Eligible?
- —
No personal income docs; deal must DSCR.
Hard money
10% down · 12.0% · 12mo
- Down + closing
- —
- Monthly P&I
- —
- Monthly cashflow
- —
- DSCR
- —
- Eligible?
- —
Short-term bridge; refi at stabilization.
Rent comps 2 comps
| Address | Beds | Baths | Sqft | Rent | $/sqft | DOM | Units | Dist |
|---|---|---|---|---|---|---|---|---|
| 109 W Bank St Albion, NY | 2.0 | 1.0 | 1000 | $1,000 | $1.00 | 3d | 1 | 0.61mi |
| 345 Crimson Dr Albion, NY | 2.0 | 1.0 | 825 | $1,232 | $1.49 | 1d | 1 | 1.28mi |
Listing history 14 events
-
2026-06-17status $72,500 Pending 49 DOM
-
2026-06-16days on market $72,500 Active 49 DOM
-
2026-06-15days on market $72,500 Active 48 DOM
-
2026-06-13days on market $72,500 Active 46 DOM
-
2026-06-12days on market $72,500 Active 45 DOM
-
2026-06-09days on market $72,500 Active 42 DOM
-
2026-06-08days on market $72,500 Active 41 DOM
-
2026-06-07days on market $72,500 Active 40 DOM
-
2026-06-07days on market $72,500 Active 39 DOM
-
2026-06-04days on market $72,500 Active 36 DOM
-
2026-06-02days on market $72,500 Active 35 DOM
-
2026-06-01days on market $72,500 Active 34 DOM
-
2026-05-31days on market $72,500 Active 33 DOM
-
2026-04-28$79,900 Active 901-char remark
ⓘ Source: listings_history table (triggers on properties + properties_extension) + one-shot
backfill from property_details.listing_events for pre-trigger history.
Climate risk First Street
- Flood 1/10 Low FEMA zone X · 0% chance over 30 yrs
- Wildfire 2/10 Low
- Heat 2/10 Low 7 d/yr ≥96°F today · 15 d/yr by 30 yrs out
- Wind 1/10 Low
- Air quality 2/10 Low 1 unhealthy d/yr today · 2 by 30 yrs out
Nearby sold comps map
Loading sold comps map…
Walkable amenities ~0.75 mi
Loading nearby amenities…
Taxation est. · year 1
- Rental income
- $12,786
- − Mortgage interest
- −$4,061
- − Property taxes
- −$1,088
- − Insurance
- −$362
- − Repairs & maintenance
- −$1,023
- − Management
- −$1,023
- − Depreciation
- −$2,109
- Taxable income
- $3,120
- Est. tax owed @ 24.0%
- −$749
- After-tax cash flow
- $3,340/yr
For passive investors: Depreciation is non-cash, so a rental often shows a tax loss while cash-flowing — sheltering income. Rental losses are passive: they offset passive income freely, and up to $25,000/yr can offset ordinary (W-2) income if you actively participate and your MAGI is under $100k (phasing out to $0 by $150k); unused losses carry forward. On sale, claimed depreciation is recaptured at up to 25%, and gains may owe capital-gains tax (a 1031 exchange can defer both). Figures are a year-1 estimate at your 24.0% rate — not tax advice; consult a CPA.
Condition & rehab AI · 2 photos
This single-wide mobile home is move-in ready with good condition and recent updates, making it an attractive option for both resale and rental.
Value-add opportunities
- Both Painting the exterior siding — Fresh paint can enhance curb appeal and value
- Both Landscaping improvements — Enhances curb appeal and can attract more renters
Renovation cost estimate screening
Value-add ROI direction
- Both Painting the exterior siding — Fresh paint can enhance curb appeal and value ↑
- Both Landscaping improvements — Enhances curb appeal and can attract more renters ↑
ⓘ Cost ranges are severity-bucket heuristics (US national rule-of-thumb). Get contractor quotes + a written scope before underwriting a rehab budget.
Schools (NCES district)
- District
- Albion Central School District
- NCES district ID
- 3602520
- Math proficiency
- 37% ▼ -15.00%
- Reading proficiency
- 50% ▲ 7.00%
- Median HH income
- $45,408
- Composite
- 36.91/100
- National rank
- #4541
- State rank
- #479 of 590 in NY
Livability — Albion
- Score
- 59/100
- State rank
- #1009
- US rank
- #19661
Category grades
Schools grade is shown separately in the Schools card above.
Census & demographics
- Census place
- Albion, NY
- Population (ZIP)
- 12,479
Population outlook (Orleans County) Hauer SSP2
- Today (2025)
- 39,123 people
- By 2030
- 37,648 · -3.8%
- By 2040
- 34,432 · -12.0%
- By 2050
- 31,487 · -19.5%
- By 2075
- 26,544 · -32.2%
- By 2100
- 22,251 · -43.1%
Race, ethnicity, and origin ACS 2023
- Neighborhood character
- Predominantly White (83%)
- Race & ethnicity
- White 83% Black 9% Hispanic / Latino 5% Two or more races 4%
- Common ancestry
- Romanian 5% Iranian 2% Lithuanian 2%
- Foreign-born
- 2% · Canada, China
- Languages at home
- 95% English-only · Spanish 4% Other Indo-European 1%
Political lean MEDSL · Orleans
- 2024 margin
- Solid R (+40.5) · D 29.8% · R 70.2%
- 2008→2024 swing
- -21.8pp toward R · 2008: -18.7pp · 2024: -40.5pp
- All cycles
- 2024: R+40.5 2020: R+36.0 2016: R+43.4 2012: R+19.4 2008: R+18.7
Not yet ingested
- Civics
- —
Market trends
- HPI YoY
- ▼ -39.68%
- Current HPI
- 302.9236
- Rent YoY
- —
- Metro
- —
- State GDP YoY
- ▲ 2.60%
- F500 in state
- 92
Industry mix (Fortune 500 HQ in NY)
| Industry | F500 HQs | Revenue |
|---|---|---|
| Financial Services | 10 | $950B |
|
||
| Consumer Goods | 9 | $162B |
|
||
| Insurance | 4 | $225B |
|
||
| Telecommunications | 2 | $144B |
|
||
| Pharmaceuticals | 2 | $112B |
|
||
| Media / Entertainment | 2 | $69B |
|
||
Price history
-9.3% since first listed3 events — show timeline
- 2026-06-16 Pending — UNYREIS
- 2026-05-19 Price Changed $72,500 UNYREIS
- 2026-04-28 Listed $79,900 UNYREIS
Cash-flow waterfall
monthlySold comps — $/sqft
last 12 mo · ≤1 miLoading sold comps…