 Duplex
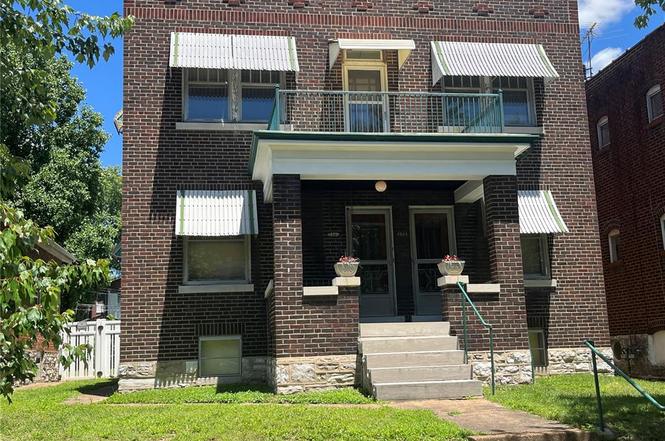
4629 Quincy St · St. Louis, MO
Flood risk 1/10 · Minimal
- FEMA flood zone
- X (unshaded)
- Chance of flooding over 30 yrs
- 0.0%
- Est. flood insurance / yr
- $473 – $860
Fire risk 1/10 · Minimal
- Est. fire insurance / yr
- $1,054 – $1,958
Heat risk 5/10 · Moderate
- Hot days now (above 108°F)
- 7 days/yr
- Hot days in 30 yrs
- 21 days/yr
Wind risk 2/10 · Minimal
- Chance of severe wind over 30 yrs
- 1.0%
Air-quality risk 3/10 · Minor
- Unhealthy air days now
- 3 days/yr
- Unhealthy air days in 30 yrs
- 4 days/yr
Risk factors via First Street. Map © Google.
Why this score? — see what drove the C+ grade
The composite is a weighted blend of 9 inputs, each scored 0–100. Each bar is that input's sub-score; the figure is the points it added to the 100-point composite (weight × sub-score).
- Cash flow +26.3/30.0
- ARV discount +12.2/15.0
- DSCR +8.9/10.0
- 1% rule +6.4/10.0
- Rent growth +3.2/5.0
- Livability +2.5/5.0
- Condition / age +2.5/5.0
- Schools +1.2/10.0
- Appreciation +0.0/10.0
$209,900
🖨 Deal sheet 📄 Offer letter ✓ Due diligence
Multi-family units
County records classify this as Multi-Family (2-4 Unit). Listing-text estimate: 2 units. confirmed
Listing remarks
Wonderful opportunity to own this brick 2-Family in the Boulevard Heights neighborhood. Each one bedroom unit has over 1,000 square feet, with beautiful hardwood floors in the large living, dining and bedroom. There is also a decorative fireplace, stain glass windows, and an eat-in kitchen. The unfinished lower level is dry, clean and has washer/dryer hookups. It has a spacious backyard, patio, two car garage and parking pad. Great investment property, or a great opportunity to live in one unit and have someone rent the second unit. Property to be sold "as is".
Key facts
- 6,098 sq ft lot
- 2 garage spots
- Built 1924
Property features AI
Finance
- Financial info: No second mortgage indicated
Exterior
- Parking: Total parking for 3 vehicles; Detached garage with 2 garage spaces and garage door opener; 1 carport space; Off-street parking pad
- Security: Smoke detector(s)
- Utilities: Public water; Single-phase electric
- Home design: Residential income property (2-4 units); Two units (multi-family); Above-grade living area 2,040
- Construction: Brick and stone construction; Flat roof
- Exterior features: Front porch; Patio; Privacy vinyl fencing; Lot approximately 0.14 acres
Interior
- Kitchen: Eat-in kitchen
- Bedrooms: Property contains 2 one-bedroom units
- Flooring: Hardwood floors
- Bathrooms: Each unit includes 1 bathroom
- Heating & cooling: Natural gas heating; Central air conditioning
- Interior features: Eat-in kitchen; Smoke detectors; Full unfinished basement with 8+ ft poured walls and walk-out access; Decorative fireplace in living room (2 fireplaces total)
- Laundry & utility: Laundry in basement with washer hookup and gas dryer hookup
Neighborhood map
What this means for you Summary
Snapshot
- This is a 2 × 1-bed/1.0-bath units multifamily listed at $210k.
Deal economics
- At list price, monthly cash flow is $543 ($7k/yr) — positive. Per door: $271/mo.
- The deal already cash-flows at list — no discount required.
- Meets the 1% rule at list price ($2k rent vs $210k).
- Cap rate 9.4% vs local median 5.0% in St. Louis — top-decile yield for the area; either an underpriced asset or a hidden risk that comps aren't pricing in. Stress-test before assuming the spread holds.
Location & tenants
- Location reads: area grade C — affects rentability + tenant quality, not the cash-flow math above.
- St. Louis City (urban): math 10% / reading 18% proficiency, ranked #312 of 324 in MO (top 96%) — low school quality limits family demand, transient renter base, plan for 1-2y turnover; 80% free/reduced lunch — lower-income household profile, screen leases tightly.
- Zoned schools: Buder Elem. (math 12% / reading 22%, grade F, #967 of 1,115 statewide, top 88%, 403 students, 99% FRL); Roosevelt High (math 2% / reading 8%, grade F, #517 of 521 statewide, top 100%, 460 students, 99% FRL) — zoned schools average 99% FRL vs 80% district-wide (19 pts higher); higher-poverty schools than district average — tighter screening recommended.
- Market conditions: Rents rising (+2.6%/yr); 255 active listings in the ZIP; 3 comparable units currently listed for rent nearby; rentals leasing fast (median 2d on market — plan ~1-2 weeks tenant-placement turnaround); 294 units permitted in St. Louis city in 2024 (227 in 5+ unit buildings).
- At $2,385/mo this rent would consume 47% of the median local household income ($61k/yr) (locally 1923% of renters already pay >50% of income on rent) — very limited rent-growth headroom before tenants either downsize or default.
Forward outlook
- Local home prices are declining (-3.0%/yr); year-one equity from $1k of loan paydown is wiped out by about $6k of value loss. Plan a longer hold.
- St. Louis County population projected to shrink 6% by 2050 — rents likely to lag national; underwrite the cash flow, not the appreciation.
Negotiation context
- Only 1 days on market — expect competitive offers; lowballing is unlikely to land.
Risks & watch-outs
- Watch-outs: built in 1924 — expect roof / HVAC / electrical / plumbing capex.
- Climate carrying-cost: extreme-heat days projected 7→21/yr by 2055 (HVAC capex compounding) — expect insurance premiums to compound above CPI over the hold.
Questions for the listing agent
- Can we see the unit-by-unit rent roll, current vacancy, and any below-market leases? What's the average tenancy length?
- What capital expenditures (roof, boiler, parking lot, exteriors) have been made in the last 5 years, and what's planned in the next 2?
- Built in 1924 — when were the roof, HVAC, electrical panel, plumbing, and water heater last replaced?
- Is there a deadline driving the sale (1031 exchange, divorce, estate, relocation)? That informs how much negotiation room exists.
- What's the average days-on-market for RENTAL listings here right now (not sales)? A rising rental-DOM trend means longer vacancies and softer asking-rent achievability than the comps imply.
- What's the recent tenant-quality profile in this submarket — average credit score on applications, eviction rate, late-payment / NSF rate, and stable-employment percentage? A property-management company in the area should have these aggregated.
- How much new apartment / multifamily construction is in the pipeline within 1–3 miles? Heavy new supply (>2% of stock underway) typically softens rents 12–24 months out; light construction supports rent growth.
Investment metrics
- 1% rule
- 1.14% ✓
- Cap rate
- 9.39%
- Cash-on-cash
- 11.08%
- DSCR
- 1.49
- GRM
- 7.3
CMA / ARV
- ARV (on-the-fly)
- $234,600
- Comps found
- 9
Show comp detail 9 sales within ~0.75 mi
| Address | Dist | Beds/Ba | Sqft | Sold | Price | $/sf | Match |
|---|---|---|---|---|---|---|---|
| 4615 Quincy St | 0.03mi | 4/4.0 | 2,024 (-1%) | 6mo | $194,900 | $96 | 84 |
| 6442 S Kingshighway Blvd | 0.31mi | 4/2.0 | 2,304 (+13%) | 10mo | $209,000 | $91 | 55 |
| 5503 Rhodes Ave | 0.72mi | 4/2.0 | 1,926 (-6%) | 4mo | $315,000 | $164 | 54 |
| 5404 Nagel Ave | 0.50mi | 4/2.0 | 1,784 (-12%) | 6mo | $398,000 | $223 | 50 |
| 5459 Holly Hills Ave | 0.65mi | 4/2.0 | 2,288 (+12%) | 8mo | $299,000 | $131 | 43 |
| 5600 S Kingshighway Blvd | 0.75mi | 4/2.0 | 2,268 (+11%) | 5mo | $250,000 | $110 | 43 |
| 4719 Primm St | 0.38mi | 3/2.0 (-1) | 1,810 (-11%) | 20mo | $199,900 | $110 | 42 |
| 5923 S Kingshighway Blvd | 0.53mi | 4/2.0 | 2,300 (+13%) | 20mo | $265,000 | $115 | 38 |
| 4921 Finkman St | 0.53mi | 4/2.0 | 2,336 (+14%) | 21mo | $325,000 | $139 | 33 |
Match score weights: distance 35% · size 25% · config 20% · recency 20%. Top-matched comps best support the ARV.
Projected returns pro-forma
-3.0% appreciation · 2.62% rent growth · sell at horizon
- IRR
- -0.2%
- Equity multiple
- 0.99×
- Total profit
- $-394
- Equity at exit
- $31,297
- IRR
- 9.1%
- Equity multiple
- 1.69×
- Total profit
- $40,331
- Equity at exit
- $18,148
Cash invested: $58,772 (down + closing). Projections, not guarantees.
Landlord ↔ Tenant lean methodology
- Overall (STATE)
- 81 Strongly Landlord-Friendly
- State Missouri
- 81 Strongly Landlord-Friendly · R+10
- County
- — inherits STATE
- City
- — inherits STATE
ZIP-level market 63116
- Rents YoY
- 2.6%
- Active inventory
- 255
- Price-to-rent
- 14.7×
Monthly cashflow live
- Estimated rent
- $2,385 high interval (Pro) →
- Mortgage (P&I)
- −$1,101
- Tax from tax record
- −$153 /mo · $1,840/yr
- Insurance
- −$87
- HOA
- −$0
- Vacancy / Maint / Mgmt
- −$501
- Net cashflow
- $543
Break-even live
2-unit breakdown (identical units grouped — click to expand)
| Units | Beds | Baths | Est. rent |
|---|---|---|---|
| 2× units | 1 | 1 | $2,384 |
| #1 | 1 | 1 | $1,192 |
| #2 | 1 | 1 | $1,192 |
| Total (2 units) | $2,385 | ||
UW: 25.0% down · 7.5% · 30yr · 1.5% tax · 5.0% vac · 8.0% maint · 8.0% mgmt
Financing live
Cash to close
- Down payment
- $52,475
- Closing costs
- $6,297
- Reserves months
- —
- Total cash needed
- —
Loan-product check · same deal, 3 products live
Conventional
25% down · 7.5% · 30yr
- Down + closing
- —
- Monthly P&I
- —
- Monthly cashflow
- —
- DSCR
- —
- Eligible?
- —
Personal DTI + credit; lowest rate.
DSCR
20% down · 8.5% · 30yr
- Down + closing
- —
- Monthly P&I
- —
- Monthly cashflow
- —
- DSCR
- —
- Eligible?
- —
No personal income docs; deal must DSCR.
Hard money
10% down · 12.0% · 12mo
- Down + closing
- —
- Monthly P&I
- —
- Monthly cashflow
- —
- DSCR
- —
- Eligible?
- —
Short-term bridge; refi at stabilization.
Rent comps 3 comps
| Address | Beds | Baths | Sqft | Rent | $/sqft | DOM | Units | Dist |
|---|---|---|---|---|---|---|---|---|
| 5616 S Kingshighway Blvd Saint Louis, MO | 3.0 | 2.0 | 1400 | $1,830 | $1.31 | 1d | 1 | 0.70mi |
| 5185 Goethe Ave Fl 1 St. Louis, MO | 3.0 | 2.0 | 1858 | $2,240 | $1.21 | 43d | 1 | 0.76mi |
| 3857 Boulevard Heights Ct Saint Louis, MO | 3.0 | 2.5 | 1697 | $2,250 | $1.33 | 1d | 1 | 0.99mi |
Listing history 3 events
-
2026-06-17remarks 567-char remark
-
2026-06-17status $209,900 Active 1 DOM
-
2026-06-17$209,900 Coming Soon 1 DOM
ⓘ Source: listings_history table (triggers on properties + properties_extension) + one-shot
backfill from property_details.listing_events for pre-trigger history.
Tax reassessment forecast MO · Resets to sale price
- Current annual tax
- $1,840 · $153/mo
- Projected year-2 tax
- $2,036 · $170/mo
- Expected delta
- +$196/yr (+$16/mo · 10.6%)
ⓘ Screening estimate from a state-policy table — verify with the county assessor before closing.
Climate risk First Street
- Flood 1/10 Low FEMA zone X (unshaded) · 0% chance over 30 yrs
- Wildfire 1/10 Low
- Heat 5/10 Major 7 d/yr ≥108°F today · 21 d/yr by 30 yrs out
- Wind 2/10 Low 100% chance of damaging wind over 30 yrs
- Air quality 3/10 Moderate 3 unhealthy d/yr today · 4 by 30 yrs out
Nearby sold comps map
Loading sold comps map…
Walkable amenities ~0.75 mi
Loading nearby amenities…
Taxation est. · year 1
- Rental income
- $28,620
- − Mortgage interest
- −$11,758
- − Property taxes
- −$1,840
- − Insurance
- −$1,050
- − Repairs & maintenance
- −$2,290
- − Management
- −$2,290
- − Depreciation
- −$6,106
- Taxable income
- $3,287
- Est. tax owed @ 24.0%
- −$789
- After-tax cash flow
- $5,722/yr
For passive investors: Depreciation is non-cash, so a rental often shows a tax loss while cash-flowing — sheltering income. Rental losses are passive: they offset passive income freely, and up to $25,000/yr can offset ordinary (W-2) income if you actively participate and your MAGI is under $100k (phasing out to $0 by $150k); unused losses carry forward. On sale, claimed depreciation is recaptured at up to 25%, and gains may owe capital-gains tax (a 1031 exchange can defer both). Figures are a year-1 estimate at your 24.0% rate — not tax advice; consult a CPA.
Schools (NCES district)
- District
- St. Louis City
- NCES district ID
- 2929280
- Math proficiency
- 10% ▼ -6.00%
- Reading proficiency
- 18% ▼ -3.00%
- Median HH income
- $35,685
- Composite
- 11.54/100
- National rank
- #9699
- State rank
- #312 of 324 in MO
Livability — St. Louis
No livability data for this city. (Only ~50 U.S. cities are tracked.)
Census & demographics
- Census place
- St. Louis, MO
- County
- Saint Louis City · 254,015 people
- City population
- 283,259
- Metro
- St. Louis, MO-IL
- Population (ZIP)
- 42,170
- Household income
- $61,433
- Rent vs Own
- Severe rent burden
- 1923.0
Population outlook (St. Louis County) Hauer SSP2
- Today (2025)
- 315,737 people
- By 2030
- 313,865 · -0.6%
- By 2040
- 305,439 · -3.3%
- By 2050
- 296,529 · -6.1%
- By 2075
- 271,028 · -14.2%
- By 2100
- 255,359 · -19.1%
Race, ethnicity, and origin ACS 2023
- Neighborhood character
- Diverse neighborhood (Simpson 0.63)
- Race & ethnicity
- White 54% Black 27% Hispanic / Latino 10% Two or more races 8% Asian 5%
- Hispanic origin (detail)
- Mexican 7%
- Common ancestry
- Lithuanian 4% Romanian 2% Italian 2%
- Foreign-born
- 11% · Canada, Vietnam, Philippines
- Languages at home
- 85% English-only · Spanish 6% Vietnamese 2% Arabic 2%
Political lean MEDSL · St. Louis
- 2024 margin
- Solid D (+64.7) · D 81.4% · R 16.7% · Other 2.0%
- 2008→2024 swing
- -3.5pp toward R · 2008: 68.2pp · 2024: 64.7pp
- All cycles
- 2024: D+64.7 2020: D+66.2 2016: D+63.7 2012: D+66.6 2008: D+68.2
Not yet ingested
- Civics
- —
Market trends
- HPI YoY
- ▼ -271.19%
- Current HPI
- 215.7108
- Rent YoY
- ▲ 2.62%
- Metro
- St. Louis, MO-IL
- State GDP YoY
- ▲ 1.84%
- F500 in state
- 20
Industry mix (Fortune 500 HQ in MO)
| Industry | F500 HQs | Revenue |
|---|---|---|
| Healthcare | 1 | $163B |
|
||
| Insurance | 1 | $21B |
|
||
| Industrial Technology | 1 | $17B |
|
||
| Retail | 1 | $16B |
|
||
| Industrial Distribution | 1 | $10B |
|
||
| Utilities | 1 | $9B |
|
||
Price history
1 event — show timeline
- 2026-06-17 Coming Soon $209,900 MARIS as Distributed by MLS Grid
Property tax history
+4.7%/yrLatest (2023): $1,840 · +6.8% YoY. Source: county tax records.
Cash-flow waterfall
monthlySold comps — $/sqft
last 12 mo · ≤1 miLoading sold comps…