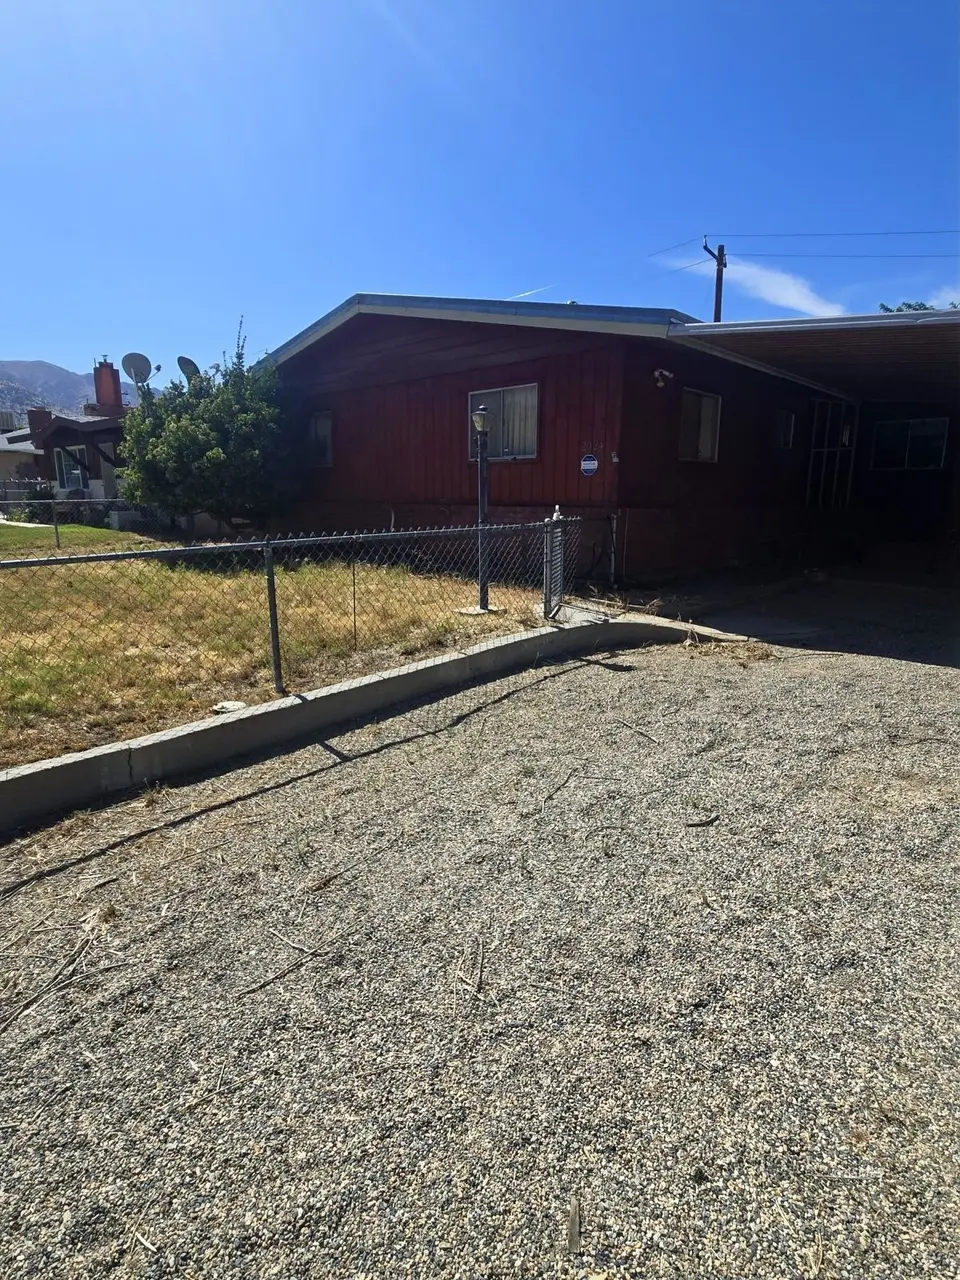
2024 Pecos · Lake Isabella, CA
Flood risk 1/10 · Minimal
- FEMA flood zone
- X (unshaded)
- Chance of flooding over 30 yrs
- 0.0%
- Est. flood insurance / yr
- $507 – $1,088
Fire risk 9/10 · Severe
- Est. fire insurance / yr
- $659 – $1,223
Heat risk 7/10 · Major
- Hot days now (above 100°F)
- 11 days/yr
- Hot days in 30 yrs
- 28 days/yr
Wind risk 1/10 · Minimal
- Chance of severe wind over 30 yrs
- —
Air-quality risk 10/10 · Severe
- Unhealthy air days now
- 24 days/yr
- Unhealthy air days in 30 yrs
- 30 days/yr
Risk factors via First Street. Map © Google.
Why this score? — see what drove the C+ grade
The composite is a weighted blend of 9 inputs, each scored 0–100. Each bar is that input's sub-score; the figure is the points it added to the 100-point composite (weight × sub-score).
- Cash flow +18.1/30.0
- ARV discount +15.0/15.0
- Appreciation +7.8/10.0
- DSCR +5.7/10.0
- 1% rule +4.0/10.0
- Schools +2.6/10.0
- Livability +2.6/5.0
- Rent growth +2.5/5.0
- Condition / age +2.5/5.0
$193,000
🖨 Deal sheet 📄 Offer letter ✓ Due diligence
Listing remarks MLS
Welcome to this charming 3-bedroom, 2-bath starter home, ready for its next owners. The spacious living and dining area features an open-concept layout, creating a comfortable space for everyday living and entertaining. The kitchen offers convenient breakfast seating and a pass-through window that connects seamlessly to the dining area. Vintage charm shines through in the beautifully preserved retro-style bathrooms, adding character and personality to the home. Outside, the large backyard provides plenty of space for recreation, gardening, or future improvements. With alley access, there's easy room for RV or boat parking, while established trees and two storage sheds offer added functionality and appeal. The attached one-car garage includes a dedicated workshop area, perfect for storing tools, tackling projects, or organizing gardening equipment. Conveniently located close to downtown amenities, parks, a skate park, and a dog park, this property offers the opportunity to enjoy affordable lake-area living with plenty of potential to make it your own.
Key facts
- Alley access
- Pass-through window
- Large backyard
Tags
Property features AI
Exterior
- Parking: 1-car garage; Carport
- Utilities: Septic tank
- Home design: Single-family property; Faces unspecified direction
- Construction: Composition roof
- Exterior features: RV space (20 x 60); Carport
Interior
- Kitchen: Range/oven
- Bathrooms: Two full bathrooms
- Heating & cooling: Central heat; Evaporative cooling
- Interior features: Range/oven; One fireplace; Central heat; Evaporative cooling
Neighborhood map
What this means for you Summary
Snapshot
- This is a 3-bed/2.0-bath single-family listed at $193k.
Deal economics
- At list price, monthly cash flow is $171 ($2k/yr) — positive.
- The deal already cash-flows at list — no discount required.
- To meet the 1% rule (rent ≥ 1% of price), the offer needs to be $173k (10.3% below list).
- Recommended offer: $173k (10.3% below list) — sets the bar for 1% rule.
Location & tenants
- Location reads 52/100 on livability (#999 in CA) — a working-class tenant base; expect higher turnover. Strengths: housing A, cost of living B+; Watch: crime C-, schools F, amenities F.
- Kernville Union Elementary (rural): math 20% / reading 37% proficiency, ranked #1,128 of 1,400 in CA (top 81%) — low school quality limits family demand, transient renter base, plan for 1-2y turnover; 65% free/reduced lunch — lower-income household profile, screen leases tightly.
- Market conditions: 135 active listings in the ZIP; 3,244 units permitted in Kern County in 2024 (73 in 5+ unit buildings).
Forward outlook
- In year one you build about $12k of equity ($1k loan paydown + $11k appreciation (5.5% local appreciation)).
- Kern County population projected at +17% by 2050 — long-run rental-demand tailwind backs the buy-and-hold thesis.
- At projected returns (5.5% appreciation + 3.0% rent growth), your $54k cash investment doubles in ~4 years — after that, you're playing with house money.
- By year 4, paydown + projected appreciation supports a ~$41k cash-out refi (75% LTV) — recoverable capital for the next deal without selling this one.
Negotiation context
- Only 12 days on market — expect competitive offers; lowballing is unlikely to land.
- 2 sale attempts with the ask held roughly flat each time — persistent listings suggest the price (not the market) is what's stuck; bring a comps-based counter.
Risks & watch-outs
- Watch-outs: built in 1958 — expect roof / HVAC / electrical / plumbing capex.
- Climate carrying-cost: severe wildfire risk; extreme-heat days projected 11→28/yr by 2055 (HVAC capex compounding) — expect insurance premiums to compound above CPI over the hold.
Questions for the listing agent
- Built in 1958 — when were the roof, HVAC, electrical panel, plumbing, and water heater last replaced?
- Is there a deadline driving the sale (1031 exchange, divorce, estate, relocation)? That informs how much negotiation room exists.
- Schools are F-rated, which usually means shorter tenancies and higher turnover. Who's the typical renter profile here, and what's been the actual vacancy rate?
- What's the average days-on-market for RENTAL listings here right now (not sales)? A rising rental-DOM trend means longer vacancies and softer asking-rent achievability than the comps imply.
- What's the recent tenant-quality profile in this submarket — average credit score on applications, eviction rate, late-payment / NSF rate, and stable-employment percentage? A property-management company in the area should have these aggregated.
- How much new for-sale + rental construction is in the pipeline within 1–3 miles? Heavy new supply typically softens prices + rents 12–24 months out; constrained supply supports both.
Investment metrics
- 1% rule
- 0.90% ✗
- Cap rate
- 7.36%
- Cash-on-cash
- 3.80%
- DSCR
- 1.17
- GRM
- 9.3
CMA / ARV
- ARV (on-the-fly)
- $232,593
- Comps found
- 8
Show comp detail 8 sales within ~0.75 mi
| Address | Dist | Beds/Ba | Sqft | Sold | Price | $/sf | Match |
|---|---|---|---|---|---|---|---|
| 2101 Kem Ave | 0.09mi | 3/2.0 | 1,260 (-1%) | 5mo | $230,000 | $183 | 90 |
| 2905 Scovern St | 0.53mi | 3/2.0 | 1,342 (+6%) | 13mo | $210,000 | $156 | 55 |
| 2908 Fulop St | 0.49mi | 4/2.5 (+1) | 1,360 (+7%) | 10mo | $140,000 | $103 | 50 |
| 2701 Lupine St | 0.65mi | 2/1.0 (-1) | 1,280 (+1%) | 14mo | $198,000 | $155 | 48 |
| 2556 Pearl Harbor Dr Dr | 0.48mi | 2/2.0 (-1) | 1,394 (+10%) | 11mo | $330,000 | $237 | 47 |
| 2032 Rainbow Dr | 0.53mi | 2/1.0 (-1) | 1,128 (-11%) | 1mo | $178,500 | $158 | 47 |
| 2000 Old Canal Rd | 0.72mi | 2/1.0 (-1) | 1,339 (+5%) | 10mo | $305,000 | $228 | 41 |
| 2720 Webb Ave | 0.71mi | 2/1.0 (-1) | 1,136 (-11%) | 21mo | $210,000 | $185 | 23 |
Match score weights: distance 35% · size 25% · config 20% · recency 20%. Top-matched comps best support the ARV.
Projected returns pro-forma
5.55% appreciation · 3.0% rent growth · sell at horizon
- IRR
- 17.4%
- Equity multiple
- 2.14×
- Total profit
- $61,455
- Equity at exit
- $115,884
- IRR
- 17.3%
- Equity multiple
- 4.21×
- Total profit
- $173,605
- Equity at exit
- $205,605
Cash invested: $54,040 (down + closing). Projections, not guarantees.
Landlord ↔ Tenant lean methodology
- Overall (STATE)
- 18 Strongly Tenant-Friendly
- State California
- 18 Strongly Tenant-Friendly · D+13
- County
- — inherits STATE
- City
- — inherits STATE
ZIP-level market 93240
- Home prices YoY
- 1.6%
- Active inventory
- 135
- Price-to-rent
- 9.3×
Monthly cashflow live
- Estimated rent
- $1,731 medium interval (Pro) →
- Mortgage (P&I)
- −$1,012
- Tax from tax record
- −$104 /mo · $1,247/yr
- Insurance
- −$80
- HOA
- −$0
- Vacancy / Maint / Mgmt
- −$364
- Net cashflow
- $171
Break-even live
UW: 25.0% down · 7.5% · 30yr · 1.5% tax · 5.0% vac · 8.0% maint · 8.0% mgmt
Financing live
Cash to close
- Down payment
- $48,250
- Closing costs
- $5,790
- Reserves months
- —
- Total cash needed
- —
Loan-product check · same deal, 3 products live
Conventional
25% down · 7.5% · 30yr
- Down + closing
- —
- Monthly P&I
- —
- Monthly cashflow
- —
- DSCR
- —
- Eligible?
- —
Personal DTI + credit; lowest rate.
DSCR
20% down · 8.5% · 30yr
- Down + closing
- —
- Monthly P&I
- —
- Monthly cashflow
- —
- DSCR
- —
- Eligible?
- —
No personal income docs; deal must DSCR.
Hard money
10% down · 12.0% · 12mo
- Down + closing
- —
- Monthly P&I
- —
- Monthly cashflow
- —
- DSCR
- —
- Eligible?
- —
Short-term bridge; refi at stabilization.
Listing history 11 events
-
2026-06-18days on market $193,000 Active 12 DOM
-
2026-06-17days on market $193,000 Active 11 DOM
-
2026-06-16days on market $193,000 Active 10 DOM
-
2026-06-15days on market $193,000 Active 9 DOM
-
2026-06-14days on market $193,000 Active 7 DOM
-
2026-06-13days on market $193,000 Active 6 DOM
-
2026-06-10days on market $193,000 Active 4 DOM
-
2026-06-09days on market $193,000 Active 3 DOM
-
2026-06-08days on market $193,000 Active 2 DOM
-
2026-06-07remarks 699-char remark
-
2026-06-07$193,000 Active 1 DOM
ⓘ Source: listings_history table (triggers on properties + properties_extension) + one-shot
backfill from property_details.listing_events for pre-trigger history.
Tax reassessment forecast CA · Resets to sale price
- Current annual tax
- $1,247 · $104/mo
- Projected year-2 tax
- $1,467 · $122/mo
- Expected delta
- +$220/yr (+$18/mo · 17.6%)
ⓘ Screening estimate from a state-policy table — verify with the county assessor before closing.
Climate risk First Street
- Flood 1/10 Low FEMA zone X (unshaded) · 0% chance over 30 yrs
- Wildfire 9/10 Extreme
- Heat 7/10 Severe 11 d/yr ≥100°F today · 28 d/yr by 30 yrs out
- Wind 1/10 Low
- Air quality 10/10 Extreme 24 unhealthy d/yr today · 30 by 30 yrs out
Nearby sold comps map
Loading sold comps map…
Walkable amenities ~0.75 mi
Loading nearby amenities…
Taxation est. · year 1
- Rental income
- $20,775
- − Mortgage interest
- −$10,811
- − Property taxes
- −$1,247
- − Insurance
- −$965
- − Repairs & maintenance
- −$1,662
- − Management
- −$1,662
- − Depreciation
- −$5,615
- Taxable loss
- −$1,186
- Est. tax savings @ 24.0%
- +$285
- After-tax cash flow
- $2,340/yr
For passive investors: Depreciation is non-cash, so a rental often shows a tax loss while cash-flowing — sheltering income. Rental losses are passive: they offset passive income freely, and up to $25,000/yr can offset ordinary (W-2) income if you actively participate and your MAGI is under $100k (phasing out to $0 by $150k); unused losses carry forward. On sale, claimed depreciation is recaptured at up to 25%, and gains may owe capital-gains tax (a 1031 exchange can defer both). Figures are a year-1 estimate at your 24.0% rate — not tax advice; consult a CPA.
Schools (NCES district)
- District
- Kernville Union Elementary
- NCES district ID
- 0619590
- Math proficiency
- 20% ▲ 4.00%
- Reading proficiency
- 37% ▲ 11.00%
- Median HH income
- $29,896
- Composite
- 25.91/100
- National rank
- #12766
- State rank
- #1128 of 1400 in CA
Livability — Lake Isabella
- Score
- 52/100
- State rank
- #999
- US rank
- #24814
Category grades
Schools grade is shown separately in the Schools card above.
Census & demographics
- Census place
- Lake Isabella, CA
- City population
- 5,622
- Population (ZIP)
- 5,622
Population outlook (Kern County) Hauer SSP2
- Today (2025)
- 947,286 people
- By 2030
- 978,984 · +3.3%
- By 2040
- 1,045,018 · +10.3%
- By 2050
- 1,105,232 · +16.7%
- By 2075
- 1,229,538 · +29.8%
- By 2100
- 1,238,059 · +30.7%
Race, ethnicity, and origin ACS 2023
- Neighborhood character
- Predominantly White (78%)
- Race & ethnicity
- White 78% Hispanic / Latino 13% Two or more races 5% Asian 2% Native American 1%
- Hispanic origin (detail)
- Mexican 11%
- Common ancestry
- Italian 3% Portuguese 2% Iranian 2%
- Foreign-born
- 5% · Canada, South Korea
- Languages at home
- 93% English-only · Spanish 4% Korean 1% Other Asian/Pacific 1%
Political lean MEDSL · Kern
- 2024 margin
- Strong R (+21.1) · D 38.2% · R 59.3% · Other 2.5%
- 2008→2024 swing
- -3.3pp toward R · 2008: -17.8pp · 2024: -21.1pp
- All cycles
- 2024: R+21.1 2020: R+10.2 2016: R+15.0 2012: R+20.9 2008: R+17.8
Not yet ingested
- Civics
- —
Market trends
- HPI YoY
- ▲ 5.55%
- Current HPI
- 341.2481
- Rent YoY
- —
- Metro
- —
- State GDP YoY
- ▲ 3.21%
- F500 in state
- 116
Industry mix (Fortune 500 HQ in CA)
| Industry | F500 HQs | Revenue |
|---|---|---|
| Technology | 27 | $1,492B |
|
||
| Financial Services | 3 | $174B |
|
||
| Retail | 3 | $44B |
|
||
| Insurance | 3 | $26B |
|
||
| Media / Entertainment | 2 | $115B |
|
||
| Pharmaceuticals / Biotech | 2 | $62B |
|
||
Price history
+0.0% since first listed2 events — show timeline
- 2026-06-05 Listed $193,000 GEMLS
- 2026-06-05 Listed $193,000 SSMLS
Property tax history
+5.1%/yrLatest (2025): $1,247 · +2.7% YoY. Source: county tax records.
Cash-flow waterfall
monthlySold comps — $/sqft
last 12 mo · ≤1 miLoading sold comps…