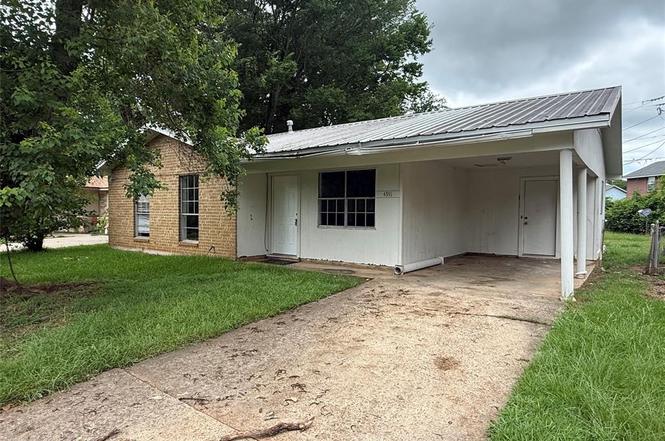
4911 Dahlia Dr · Bossier City, LA
Flood risk 2/10 · Minimal
- FEMA flood zone
- X (unshaded)
- Chance of flooding over 30 yrs
- 0.03%
- Est. flood insurance / yr
- $507 – $1,088
Fire risk 3/10 · Minor
- Est. fire insurance / yr
- $1,269 – $2,357
Heat risk 7/10 · Major
- Hot days now (above 110°F)
- 7 days/yr
- Hot days in 30 yrs
- 22 days/yr
Wind risk 6/10 · Moderate
- Chance of severe wind over 30 yrs
- 65.0%
Air-quality risk 2/10 · Minimal
- Unhealthy air days now
- 1 days/yr
- Unhealthy air days in 30 yrs
- 2 days/yr
Risk factors via First Street. Map © Google.
Why this score? — see what drove the B+ grade
The composite is a weighted blend of 9 inputs, each scored 0–100. Each bar is that input's sub-score; the figure is the points it added to the 100-point composite (weight × sub-score).
- Cash flow +30.0/30.0
- ARV discount +15.0/15.0
- DSCR +10.0/10.0
- 1% rule +9.3/10.0
- Rent growth +4.1/5.0
- Schools +3.8/10.0
- Livability +3.6/5.0
- Condition / age +2.5/5.0
- Appreciation +0.0/10.0
$99,900
🖨 Deal sheet 📄 Offer letter ✓ Due diligence
Listing remarks
Great opportunity with this investment property. A little TLC from paint to flooring and this baby is ready to go! 3 beds, 1.5 baths with all major systems being less than 10 years old. Metal roof with lifetime warranty. Great area of town that rents quickly. Add this great addition to your portfolio and watch the rent come in.
Key facts
- 7,231 sq ft lot
- Parking
- Built 1969
Property features AI
Finance
- Other: County: Bossier; Country: United States; Directions: GPS
- Financial info: Treat as clear loan type; No second mortgage
- HOA & community: No association
Exterior
- Parking: Carport (covered, 1 covered space, 1 carport space); No garage spaces
- Utilities: City water; City sewer; Property in a municipal utility district
- Home design: Single-family residence; One story; Property attached: Yes
- Construction: Brick construction; Metal roof; Built in 1969
- Exterior features: Lot under 0.5 acre (approximately 0.166 acres); Subdivision: Swan Lake Sub
Interior
- Kitchen: Electric oven
- Bedrooms: 3 bedrooms (all on the main level); Primary bedroom with ensuite bath
- Bathrooms: 1 full bathroom; 1 half bathroom
- Heating & cooling: Central heating; Central air conditioning
- Interior features: Eat-in kitchen; One living area; One dining area; 8 total rooms
- Laundry & utility: Utility room (main level)
Neighborhood map
What this means for you Summary
Snapshot
- This is a 3-bed/1.5-bath single-family listed at $100k.
Deal economics
- At list price, monthly cash flow is $497 ($6k/yr) — positive.
- The deal already cash-flows at list — no discount required.
- Meets the 1% rule at list price ($1k rent vs $100k).
- Cap rate 12.3% vs local median 4.7% in Bossier City — top-decile yield for the area; either an underpriced asset or a hidden risk that comps aren't pricing in. Stress-test before assuming the spread holds.
Location & tenants
- Location reads 71/100 on livability (#47 in LA) — a middle-class / working-renter tenant base. Strengths: commute A+, cost of living A+, housing A+; Watch: employment D+, crime F, amenities F.
- Bossier Parish (urban): math 40% / reading 47% proficiency, ranked #17 of 98 in LA (top 17%) — families likely to look elsewhere, expect single-tenant / working-renter base with shorter leases.
- Market conditions: Rents rising fast (+6.6%/yr); 421 active listings in the ZIP; 10 comparable units currently listed for rent nearby; rentals at typical pace (median 21d on market — plan ~3-4 weeks tenant-placement turnaround); 716 units permitted in Bossier Parish in 2024 (0 in 5+ unit buildings).
Forward outlook
- Local home prices are declining (-3.0%/yr); year-one equity from $691 of loan paydown is wiped out by about $3k of value loss. Plan a longer hold.
- Bossier County population projected at +28% by 2050 — long-run rental-demand tailwind backs the buy-and-hold thesis.
- At projected returns (-3.0% appreciation + 6.6% rent growth), your $28k cash investment doubles in ~5 years — after that, you're playing with house money.
Negotiation context
- Only 2 days on market — expect competitive offers; lowballing is unlikely to land.
Risks & watch-outs
- Climate carrying-cost: major wind risk, 65% chance of damaging wind over 30y; extreme-heat days projected 7→22/yr by 2055 (HVAC capex compounding) — expect insurance premiums to compound above CPI over the hold.
Questions for the listing agent
- Built in 1969 — when were the roof, HVAC, electrical panel, plumbing, and water heater last replaced?
- Is there a deadline driving the sale (1031 exchange, divorce, estate, relocation)? That informs how much negotiation room exists.
- Schools are B-rated — typically a magnet for longer-tenancy family renters. What's the average tenant stay here, and is there a school-zone premium baked into asking?
- Crime grade is F in this area — have there been break-ins, vandalism, or insurance claims at this property in the last 3 years? What carrier currently insures it and at what premium?
- What's the average days-on-market for RENTAL listings here right now (not sales)? A rising rental-DOM trend means longer vacancies and softer asking-rent achievability than the comps imply.
- What's the recent tenant-quality profile in this submarket — average credit score on applications, eviction rate, late-payment / NSF rate, and stable-employment percentage? A property-management company in the area should have these aggregated.
- How much new for-sale + rental construction is in the pipeline within 1–3 miles? Heavy new supply typically softens prices + rents 12–24 months out; constrained supply supports both.
Investment metrics
- 1% rule
- 1.43% ✓
- Cap rate
- 12.26%
- Cash-on-cash
- 21.32%
- DSCR
- 1.95
- GRM
- 5.8
CMA / ARV
- ARV (on-the-fly)
- $120,119
- Comps found
- 12
Show comp detail 12 sales within ~0.75 mi
| Address | Dist | Beds/Ba | Sqft | Sold | Price | $/sf | Match |
|---|---|---|---|---|---|---|---|
| 4844 Camellia Ln | 0.15mi | 3/1.5 | 1,091 (+3%) | 3mo | $149,900 | $137 | 86 |
| 4913 Dahlia Dr | 0.01mi | 3/1.5 | 1,021 (-4%) | 10mo | $105,000 | $103 | 85 |
| 4853 Lilac Cir | 0.18mi | 3/1.5 | 1,013 (-5%) | 8mo | $122,000 | $120 | 77 |
| 4908 Okeefe St | 0.25mi | 3/1.5 | 1,023 (-4%) | 11mo | $95,900 | $94 | 73 |
| 4817 Orchid Cir | 0.31mi | 3/1.5 | 1,006 (-5%) | 8mo | $119,900 | $119 | 69 |
| 4517 Donnie Ave | 0.65mi | 3/1.0 | 1,022 (-4%) | 3mo | $128,000 | $125 | 59 |
| 4809 Sullivan St | 0.37mi | 3/1.5 | 1,186 (+12%) | 9mo | $115,000 | $97 | 56 |
| 4521 Donnie Ave | 0.62mi | 3/1.0 | 1,074 (+1%) | 17mo | $109,900 | $102 | 53 |
| 4825 Sullivan St | 0.30mi | 3/1.0 | 1,204 (+13%) | 12mo | $134,000 | $111 | 52 |
| 4717 Okeefe St | 0.49mi | 3/2.5 | 1,144 (+8%) | 11mo | $129,900 | $114 | 51 |
| 4610 Voss Dr | 0.72mi | 3/2.0 | 1,126 (+6%) | 9mo | $127,500 | $113 | 47 |
| 4603 Sullivan St | 0.62mi | 3/1.0 | 1,152 (+8%) | 11mo | $89,900 | $78 | 46 |
Match score weights: distance 35% · size 25% · config 20% · recency 20%. Top-matched comps best support the ARV.
Projected returns pro-forma
-3.0% appreciation · 6.56% rent growth · sell at horizon
- IRR
- 17.6%
- Equity multiple
- 1.74×
- Total profit
- $20,731
- Equity at exit
- $14,895
- IRR
- 28.4%
- Equity multiple
- 3.93×
- Total profit
- $82,067
- Equity at exit
- $8,638
Cash invested: $27,972 (down + closing). Projections, not guarantees.
Landlord ↔ Tenant lean methodology
- Overall (STATE)
- 90 Strongly Landlord-Friendly
- State Louisiana
- 90 Strongly Landlord-Friendly · R+12
- County
- — inherits STATE
- City
- — inherits STATE
ZIP-level market 71111
- Home prices YoY
- -34.8%
- Rents YoY
- 6.6%
- Active inventory
- 421
- Price-to-rent
- 5.8×
Monthly cashflow live
- Estimated rent
- $1,424 high interval (Pro) →
- Mortgage (P&I)
- −$524
- Tax from tax record
- −$62 /mo · $748/yr
- Insurance
- −$42
- HOA
- −$0
- Vacancy / Maint / Mgmt
- −$299
- Net cashflow
- $497
Break-even live
UW: 25.0% down · 7.5% · 30yr · 1.5% tax · 5.0% vac · 8.0% maint · 8.0% mgmt
Financing live
Cash to close
- Down payment
- $24,975
- Closing costs
- $2,997
- Reserves months
- —
- Total cash needed
- —
Loan-product check · same deal, 3 products live
Conventional
25% down · 7.5% · 30yr
- Down + closing
- —
- Monthly P&I
- —
- Monthly cashflow
- —
- DSCR
- —
- Eligible?
- —
Personal DTI + credit; lowest rate.
DSCR
20% down · 8.5% · 30yr
- Down + closing
- —
- Monthly P&I
- —
- Monthly cashflow
- —
- DSCR
- —
- Eligible?
- —
No personal income docs; deal must DSCR.
Hard money
10% down · 12.0% · 12mo
- Down + closing
- —
- Monthly P&I
- —
- Monthly cashflow
- —
- DSCR
- —
- Eligible?
- —
Short-term bridge; refi at stabilization.
Rent comps 10 comps
| Address | Beds | Baths | Sqft | Rent | $/sqft | DOM | Units | Dist |
|---|---|---|---|---|---|---|---|---|
| 4720 Okeefe St Bossier City, LA | 3.0 | 1.0 | 1212 | $1,300 | $1.07 | 21d | 1 | 0.47mi |
| 5705 E Texas St #175 Bossier City, LA | 2.0 | 1.5 | 1044 | $1,050 | $1.01 | 43d | 1 | 0.48mi |
| 4612 Sullivan St Bossier City, LA | 3.0 | 1.0 | 864 | $1,200 | $1.39 | 21d | 1 | 0.55mi |
| 5200 E Texas St Bossier City, LA | 1.0–3.0 | 1.0–2.0 | 1068 | $1,731 | $1.62 | 13d | 28 | 0.65mi |
| 800 Venecia Dr Bossier City, LA | 3.0 | 2.0 | 1363 | $2,000 | $1.47 | 43d | 1 | 0.79mi |
| 1206 Olwen Dr Bossier City, LA | 3.0 | 1.0 | 1056 | $975 | $0.92 | 13d | 1 | 0.82mi |
| 1314 Lampkin St Bossier City, LA | 2.0 | 1.0 | 1000 | $1,000 | $1.00 | 21d | 1 | 0.91mi |
| 1523 Lampkin Cir Bossier City, LA | 3.0 | 1.0 | 1114 | $1,150 | $1.03 | 21d | 1 | 0.99mi |
| 1315 Norris Dr Bossier City, LA | 3.0 | 1.0 | 1095 | $1,150 | $1.05 | 21d | 1 | 1.08mi |
| 1419 Teekell St Bossier City, LA | 3.0 | 1.0 | 1146 | $1,400 | $1.22 | 43d | 1 | 1.09mi |
Listing history 3 events
-
2026-06-18days on market $99,900 Active 2 DOM
-
2026-06-16remarks 329-char remark
-
2026-06-16$99,900 Active 1 DOM
ⓘ Source: listings_history table (triggers on properties + properties_extension) + one-shot
backfill from property_details.listing_events for pre-trigger history.
Tax reassessment forecast LA · Resets to sale price
- Current annual tax
- $748 · $62/mo
- Projected year-2 tax
- $748 · $62/mo
- Expected delta
- $0/yr ($0/mo · 0.0%)
ⓘ Screening estimate from a state-policy table — verify with the county assessor before closing.
Climate risk First Street
- Flood 2/10 Low FEMA zone X (unshaded) · 3% chance over 30 yrs
- Wildfire 3/10 Moderate
- Heat 7/10 Severe 7 d/yr ≥110°F today · 22 d/yr by 30 yrs out
- Wind 6/10 Major 65% chance of damaging wind over 30 yrs
- Air quality 2/10 Low 1 unhealthy d/yr today · 2 by 30 yrs out
Nearby sold comps map
Loading sold comps map…
Walkable amenities ~0.75 mi
Loading nearby amenities…
Taxation est. · year 1
- Rental income
- $17,086
- − Mortgage interest
- −$5,596
- − Property taxes
- −$748
- − Insurance
- −$500
- − Repairs & maintenance
- −$1,367
- − Management
- −$1,367
- − Depreciation
- −$2,906
- Taxable income
- $4,603
- Est. tax owed @ 24.0%
- −$1,105
- After-tax cash flow
- $4,859/yr
For passive investors: Depreciation is non-cash, so a rental often shows a tax loss while cash-flowing — sheltering income. Rental losses are passive: they offset passive income freely, and up to $25,000/yr can offset ordinary (W-2) income if you actively participate and your MAGI is under $100k (phasing out to $0 by $150k); unused losses carry forward. On sale, claimed depreciation is recaptured at up to 25%, and gains may owe capital-gains tax (a 1031 exchange can defer both). Figures are a year-1 estimate at your 24.0% rate — not tax advice; consult a CPA.
Schools (NCES district)
- District
- Bossier Parish
- NCES district ID
- 2200270
- Math proficiency
- 40% ▼ -32.00%
- Reading proficiency
- 47% ▼ -28.00%
- Median HH income
- $51,326
- Composite
- 37.5/100
- National rank
- #4402
- State rank
- #17 of 98 in LA
Livability — Bossier City
- Score
- 71/100
- State rank
- #47
- US rank
- #7044
Category grades
Schools grade is shown separately in the Schools card above.
Census & demographics
- Census place
- Bossier City, LA
- County
- Bossier Parish · 98,704 people
- City population
- 91,925
- Metro
- Shreveport-Bossier City, LA
- Population (ZIP)
- 43,925
- Household income
- $65,292
- Rent vs Own
- Severe rent burden
- 1942.0
Population outlook (Bossier County) Hauer SSP2
- Today (2025)
- 143,247 people
- By 2030
- 151,802 · +6.0%
- By 2040
- 168,194 · +17.4%
- By 2050
- 183,533 · +28.1%
- By 2075
- 217,009 · +51.5%
- By 2100
- 230,091 · +60.6%
Race, ethnicity, and origin ACS 2023
- Neighborhood character
- Diverse neighborhood (Simpson 0.60)
- Race & ethnicity
- White 56% Black 29% Hispanic / Latino 9% Two or more races 8% Asian 3%
- Hispanic origin (detail)
- Mexican 5%
- Common ancestry
- Lithuanian 2% Iranian 1% Slovak 1%
- Foreign-born
- 5% · Canada, Vietnam
- Languages at home
- 90% English-only · Spanish 7% Vietnamese 1% French/Haitian/Cajun 1%
Political lean MEDSL · Bossier
- 2024 margin
- Solid R (+43.3) · D 27.7% · R 71.0% · Other 1.3%
- 2008→2024 swing
- +0.3pp no change · 2008: -43.7pp · 2024: -43.3pp
- All cycles
- 2024: R+43.3 2020: R+41.0 2016: R+45.8 2012: R+45.4 2008: R+43.7
Not yet ingested
- Civics
- —
Market trends
- HPI YoY
- ▼ -79.78%
- Current HPI
- 149.4336
- Rent YoY
- ▲ 6.56%
- Metro
- Shreveport-Bossier City, LA
- State GDP YoY
- ▲ 3.29%
- F500 in state
- 10
Industry mix (Fortune 500 HQ in LA)
| Industry | F500 HQs | Revenue |
|---|---|---|
| Telecommunications | 2 | $23B |
|
||
| Utilities | 1 | $12B |
|
||
| Wholesale / Distribution | 1 | $5B |
|
||
| Advertising | 1 | $2B |
|
||
Price history
1 event — show timeline
- 2026-06-16 Listed $99,900 NTREIS
Property tax history
-2.1%/yrLatest (2025): $748 · -1.3% YoY. Source: county tax records.
Cash-flow waterfall
monthlySold comps — $/sqft
last 12 mo · ≤1 miLoading sold comps…