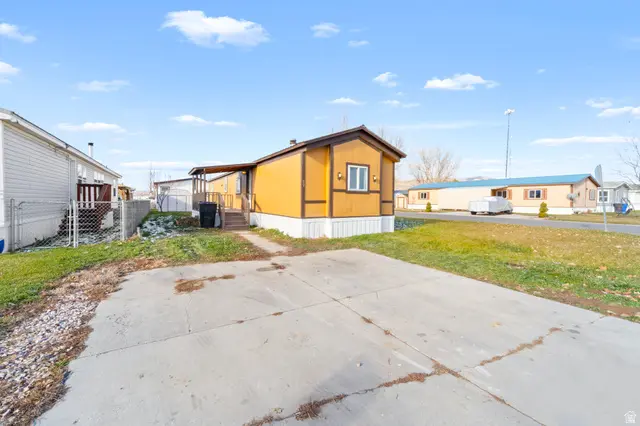
900 W Main St #60 · Tremonton, UT
Flood risk 1/10 · Minimal
- FEMA flood zone
- X (unshaded)
- Chance of flooding over 30 yrs
- 0.0%
- Est. flood insurance / yr
- $507 – $1,088
Fire risk 2/10 · Minimal
- Est. fire insurance / yr
- $453 – $841
Heat risk 4/10 · Minor
- Hot days now (above 94°F)
- 7 days/yr
- Hot days in 30 yrs
- 19 days/yr
Wind risk 1/10 · Minimal
- Chance of severe wind over 30 yrs
- —
Air-quality risk 2/10 · Minimal
- Unhealthy air days now
- 2 days/yr
- Unhealthy air days in 30 yrs
- 2 days/yr
Risk factors via First Street. Map © Google.
Why this score? — see what drove the D grade
The composite is a weighted blend of 9 inputs, each scored 0–100. Each bar is that input's sub-score; the figure is the points it added to the 100-point composite (weight × sub-score).
- 1% rule +10.0/10.0
- Cash flow +8.7/30.0
- ARV discount +7.5/15.0
- Condition / age +4.0/5.0
- Schools +3.6/10.0
- Livability +3.4/5.0
- Rent growth +2.5/5.0
- DSCR +2.4/10.0
- Appreciation +0.0/10.0
$79,000
🖨 Deal sheet 📄 Offer letter ✓ Due diligence
Listing remarks
Fully remodeled 3-bed, 2-bath home in Town & Country Estates. Brand-new kitchen, two new bathrooms, new flooring, fresh interior and exterior paint, new fixtures, and exterior updates. Move-in ready with approx. 1,100 sq ft. HOA $685. Casa totalmente remodelada de 3 recmaras y 2 baos en Town & Country Estates. Cocina nueva, 2 baos renovados, pisos nuevos, pintura interior y exterior, accesorios nuevos y mejoras exteriores. Lista para habitar. HOA $685.
Key facts
- New kitchen
- New flooring
- New bathrooms
Tags
Property features AI
Finance
- HOA & community: Homeowners association with monthly fee ($685/month); HOA amenities include RV parking, management, pets permitted, playground
Exterior
- Parking: Open/uncovered parking; Common RV parking
- Utilities: Natural gas connected; Electricity connected; Public sewer; Water connected
- Home design: Manufactured home; Built and standing; Residential use; Single-family zoning
- Construction: Cement siding; Asphalt roof
- Exterior features: Covered deck; Exterior lighting; Automatic full sprinkler system
Interior
- Kitchen: Free-standing range/oven
- Bedrooms: 3 bedrooms on the main level
- Bathrooms: 2 full bathrooms
- Heating & cooling: Forced air heating; Central air conditioning
- Interior features: Primary bathroom; Separate tub and shower; Free-standing range/oven
- Laundry & utility: Electric dryer hookup
Neighborhood map
What this means for you Summary
Snapshot
- This is a 3-bed/2.0-bath manufactured listed at $79k. Condition is rated good.
Deal economics
- At list price, monthly cash flow is $-67 ($-799/yr) — negative.
- To cash-flow at today's rent, offer at most $69k (12.2% below list).
- Meets the 1% rule at list price ($1k rent vs $79k).
- Recommended offer: $69k (12.2% below list) — sets the bar for cash-flow.
Location & tenants
- Location reads 67/100 on livability (#135 in UT) — a middle-class / working-renter tenant base. Strengths: cost of living A+, housing A+, crime B; Watch: amenities F, commute F.
- Box Elder District (town): math 41% / reading 42% proficiency, ranked #38 of 80 in UT (top 48%) — families likely to look elsewhere, expect single-tenant / working-renter base with shorter leases.
- Zoned schools: Mckinley School (math 24% / reading 29%, grade F, #463 of 585 statewide, top 80%, 607 students, 40% FRL); Bear River High (math 28% / reading 45%, grade F, #86 of 171 statewide, top 52%, 1,172 students, 22% FRL) — zoned schools at 31% FRL track the district average.
- Market conditions: 269 active listings in the ZIP; 9 comparable units currently listed for rent nearby; rentals at typical pace (median 21d on market — plan ~3-4 weeks tenant-placement turnaround); solid renter incomes; 461 units permitted in Box Elder County in 2024 (62 in 5+ unit buildings).
Forward outlook
- Local home prices are declining (-3.0%/yr); year-one equity from $546 of loan paydown is wiped out by about $2k of value loss. Plan a longer hold.
- Box Elder County population projected at +6% by 2050 — modest demand growth; plan on rents tracking national, not racing it.
Negotiation context
- It's been on market 35 days — a 3% lower offer ($77k) is reasonable based on typical stale-listing flexibility.
- 2 sale attempts with the ask held roughly flat each time — persistent listings suggest the price (not the market) is what's stuck; bring a comps-based counter.
Risks & watch-outs
- Watch-outs: HOA is 46% of rent.
Questions for the listing agent
- What do current leases actually rent for vs. the listed asking? Can we see a recent rent roll and the last 12 months of T-12 income?
- It's been on market 35 days. Have you received any prior offers? Is the seller open to a 12% concession, seller financing, or rate buy-down credit?
- What does the HOA fee cover, when was the last increase, and are there any pending special assessments or reserve-fund shortfalls?
- Is there a deadline driving the sale (1031 exchange, divorce, estate, relocation)? That informs how much negotiation room exists.
- Schools are D-rated, which usually means shorter tenancies and higher turnover. Who's the typical renter profile here, and what's been the actual vacancy rate?
- The area grade is low — what's the realistic commute time and amenity access for the typical tenant pool here? Any planned neighborhood developments (good or bad) we should know about?
- What's the average days-on-market for RENTAL listings here right now (not sales)? A rising rental-DOM trend means longer vacancies and softer asking-rent achievability than the comps imply.
- What's the recent tenant-quality profile in this submarket — average credit score on applications, eviction rate, late-payment / NSF rate, and stable-employment percentage? A property-management company in the area should have these aggregated.
- How much new for-sale + rental construction is in the pipeline within 1–3 miles? Heavy new supply typically softens prices + rents 12–24 months out; constrained supply supports both.
Investment metrics
- 1% rule
- 1.87% ✓
- Cap rate
- 5.28%
- Cash-on-cash
- -3.61%
- DSCR
- 0.84
- GRM
- 4.5
CMA / ARV
No comps found within radius.
Projected returns pro-forma
-3.0% appreciation · 3.0% rent growth · sell at horizon
- IRR
- -21.6%
- Equity multiple
- 0.25×
- Total profit
- $-16,599
- Equity at exit
- $11,779
- IRR
- -13.7%
- Equity multiple
- 0.18×
- Total profit
- $-18,113
- Equity at exit
- $6,830
Cash invested: $22,120 (down + closing). Projections, not guarantees.
Landlord ↔ Tenant lean methodology
- Overall (STATE)
- 86 Strongly Landlord-Friendly
- State Utah
- 86 Strongly Landlord-Friendly · R+15
- County
- — inherits STATE
- City
- — inherits STATE
ZIP-level market 84337
- Home prices YoY
- -33.6%
- Active inventory
- 269
- Price-to-rent
- 4.5×
Monthly cashflow live
- Estimated rent
- $1,474 high interval (Pro) →
- Mortgage (P&I)
- −$414
- Tax est. 1.5%
- −$99 /mo · $1,185/yr
- Insurance
- −$33
- HOA
- −$685
- Vacancy / Maint / Mgmt
- −$310
- Net cashflow
- $-67
Break-even live
UW: 25.0% down · 7.5% · 30yr · 1.5% tax · 5.0% vac · 8.0% maint · 8.0% mgmt
Financing live
Cash to close
- Down payment
- $19,750
- Closing costs
- $2,370
- Reserves months
- —
- Total cash needed
- —
Loan-product check · same deal, 3 products live
Conventional
25% down · 7.5% · 30yr
- Down + closing
- —
- Monthly P&I
- —
- Monthly cashflow
- —
- DSCR
- —
- Eligible?
- —
Personal DTI + credit; lowest rate.
DSCR
20% down · 8.5% · 30yr
- Down + closing
- —
- Monthly P&I
- —
- Monthly cashflow
- —
- DSCR
- —
- Eligible?
- —
No personal income docs; deal must DSCR.
Hard money
10% down · 12.0% · 12mo
- Down + closing
- —
- Monthly P&I
- —
- Monthly cashflow
- —
- DSCR
- —
- Eligible?
- —
Short-term bridge; refi at stabilization.
Rent comps 9 comps
| Address | Beds | Baths | Sqft | Rent | $/sqft | DOM | Units | Dist |
|---|---|---|---|---|---|---|---|---|
| 751 W 350 N Tremonton, UT | 3.0 | 1.5 | 1295 | $1,295 | $1.00 | 14d | 1 | 0.20mi |
| 505 W 350 N Unit 3 Tremonton, UT | 2.0 | 1.5 | 1100 | $1,100 | $1.00 | 14d | 1 | 0.32mi |
| 315 N 270 W Tremonton, UT | 3.0 | 1.0 | 1202 | $1,450 | $1.21 | 23d | 1 | 0.42mi |
| 144 S 100 W #1 Tremonton, UT | 2.0 | 1.0 | 1480 | $1,400 | $0.95 | 14d | 1 | 0.57mi |
| 1670 W 100 N Apt C Tremonton, UT | 2.0 | 1.5 | 1036 | $1,150 | $1.11 | 14d | 1 | 0.68mi |
| 320 W 600 S Tremonton, UT | 2.0–3.0 | 1.5 | 1170 | $1,295 | $1.11 | 23d | 1 | 0.70mi |
| 961 W 1000 N Unit D01 Tremonton, UT | 3.0 | 2.5 | 1476 | $1,800 | $1.22 | 21d | 1 | 0.89mi |
| 146 N 2300 W Tremonton, UT | 3.0 | 1.0 | 1300 | $2,100 | $1.62 | 23d | 1 | 1.18mi |
| 465 N 2650 W Unit C Tremonton, UT | 2.0 | 1.5 | 1150 | $1,200 | $1.04 | 23d | 1 | 1.46mi |
HOA detail
- Monthly dues
- $685 · $8,220/yr
Listing history 7 events
-
2026-05-20status Under Contract
-
2026-04-15$79,000 Active
-
2026-04-14historical
-
2026-02-02price $79,000
-
2026-01-05price $89,000
-
2025-12-24price $91,999
-
2025-12-12$92,000 Active
ⓘ Source: listings_history table (triggers on properties + properties_extension) + one-shot
backfill from property_details.listing_events for pre-trigger history.
Climate risk First Street
- Flood 1/10 Low FEMA zone X (unshaded) · 0% chance over 30 yrs
- Wildfire 2/10 Low
- Heat 4/10 Moderate 7 d/yr ≥94°F today · 19 d/yr by 30 yrs out
- Wind 1/10 Low
- Air quality 2/10 Low 2 unhealthy d/yr today · 2 by 30 yrs out
Nearby sold comps map
Loading sold comps map…
Walkable amenities ~0.75 mi
Loading nearby amenities…
Taxation est. · year 1
- Rental income
- $17,687
- − Mortgage interest
- −$4,425
- − Property taxes
- −$1,185
- − Insurance
- −$395
- − Repairs & maintenance
- −$1,415
- − Management
- −$1,415
- − HOA
- −$8,220
- − Depreciation
- −$2,298
- Taxable loss
- −$1,667
- Est. tax savings @ 24.0%
- +$400
- After-tax cash flow
- $-399/yr
For passive investors: Depreciation is non-cash, so a rental often shows a tax loss while cash-flowing — sheltering income. Rental losses are passive: they offset passive income freely, and up to $25,000/yr can offset ordinary (W-2) income if you actively participate and your MAGI is under $100k (phasing out to $0 by $150k); unused losses carry forward. On sale, claimed depreciation is recaptured at up to 25%, and gains may owe capital-gains tax (a 1031 exchange can defer both). Figures are a year-1 estimate at your 24.0% rate — not tax advice; consult a CPA.
Condition & rehab AI · 12 photos
This fully remodeled 3-bedroom, 2-bath home in Town & Country Estates is move-in ready with new kitchen, bathrooms, flooring, and exterior updates. It offers a good condition score and is ready for immediate occupancy.
Value-add opportunities
- Both Landscaping and curb appeal improvements — Enhances both resale and rental value.
- Both Add a small patio or deck area — Improves outdoor living space and adds value.
- Both Install smart home features — Attracts tech-savvy buyers and renters, increasing value.
Renovation cost estimate screening
Value-add ROI direction
- Both Landscaping and curb appeal improvements — Enhances both resale and rental value. ↑
- Both Add a small patio or deck area — Improves outdoor living space and adds value. ↑
- Both Install smart home features — Attracts tech-savvy buyers and renters, increasing value. ↑
ⓘ Cost ranges are severity-bucket heuristics (US national rule-of-thumb). Get contractor quotes + a written scope before underwriting a rehab budget.
Schools (NCES district)
- District
- Box Elder District
- NCES district ID
- 4900090
- Math proficiency
- 41% ▼ -4.00%
- Reading proficiency
- 42% ▼ -6.00%
- Median HH income
- $55,796
- Composite
- 36.3/100
- National rank
- #4698
- State rank
- #38 of 80 in UT
Livability — Tremonton
- Score
- 67/100
- State rank
- #135
- US rank
- #11139
Category grades
Schools grade is shown separately in the Schools card above.
Census & demographics
- Census place
- Tremonton, UT
- County
- Box Elder County · 16,199 people
- City population
- 16,199
- Metro
- Ogden-Clearfield, UT
- Population (ZIP)
- 16,199
- Household income
- $81,683
- Rent vs Own
- Severe rent burden
- 53.0
Population outlook (Box Elder County) Hauer SSP2
- Today (2025)
- 55,528 people
- By 2030
- 56,848 · +2.4%
- By 2040
- 58,697 · +5.7%
- By 2050
- 59,164 · +6.5%
- By 2075
- 55,699 · +0.3%
- By 2100
- 45,932 · -17.3%
Race, ethnicity, and origin ACS 2023
- Neighborhood character
- Predominantly White (86%)
- Race & ethnicity
- White 86% Hispanic / Latino 12% Two or more races 6%
- Hispanic origin (detail)
- Mexican 11%
- Common ancestry
- Italian 4% Slovak 2% Scottish 1%
- Foreign-born
- 5% · Canada
- Languages at home
- 91% English-only · Spanish 9%
Political lean MEDSL · Box Elder
- 2024 margin
- Solid R (+60.8) · D 18.2% · R 79.0% · Other 2.7%
- 2008→2024 swing
- +1.7pp toward D · 2008: -62.5pp · 2024: -60.8pp
- All cycles
- 2024: R+60.8 2020: R+63.2 2016: R+51.4 2012: R+78.2 2008: R+62.5
Not yet ingested
- Civics
- —
Market trends
- HPI YoY
- ▼ -143.34%
- Current HPI
- 283.5232
- Rent YoY
- —
- Metro
- Ogden-Clearfield, UT
- State GDP YoY
- ▲ 3.54%
- F500 in state
- 2
Industry mix (Fortune 500 HQ in UT)
| Industry | F500 HQs | Revenue |
|---|---|---|
| Financial Services | 1 | $3B |
|
||
Price history
-14.1% since first listed7 events — show timeline
- 2026-05-20 Pending — WFRMLS
- 2026-04-15 Listed $79,000 WFRMLS
- 2026-04-14 Listing Removed — WFRMLS
- 2026-02-02 Price Changed $79,000 WFRMLS
- 2026-01-05 Price Changed $89,000 WFRMLS
- 2025-12-24 Price Changed $91,999 WFRMLS
- 2025-12-12 Listed $92,000 WFRMLS
Cash-flow waterfall
monthlySold comps — $/sqft
last 12 mo · ≤1 miLoading sold comps…