 Triplex
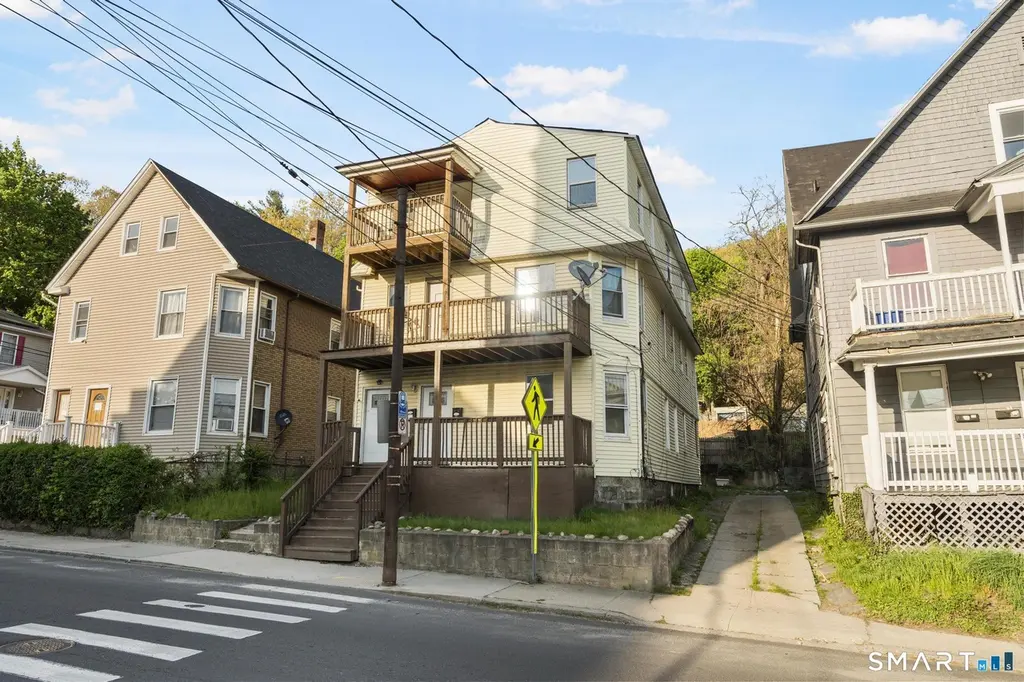
278 Willow St · Waterbury, CT
Flood risk 1/10 · Minimal
- FEMA flood zone
- X (unshaded)
- Chance of flooding over 30 yrs
- 0.0%
- Est. flood insurance / yr
- $473 – $860
Fire risk 1/10 · Minimal
- Est. fire insurance / yr
- $829 – $1,539
Heat risk 5/10 · Moderate
- Hot days now (above 96°F)
- 7 days/yr
- Hot days in 30 yrs
- 15 days/yr
Wind risk 6/10 · Moderate
- Chance of severe wind over 30 yrs
- 27.0%
Air-quality risk 3/10 · Minor
- Unhealthy air days now
- 2 days/yr
- Unhealthy air days in 30 yrs
- 3 days/yr
Risk factors via First Street. Map © Google.
Why this score? — see what drove the C- grade
The composite is a weighted blend of 9 inputs, each scored 0–100. Each bar is that input's sub-score; the figure is the points it added to the 100-point composite (weight × sub-score).
- Cash flow +27.1/30.0
- DSCR +9.4/10.0
- 1% rule +6.6/10.0
- Livability +4.0/5.0
- Condition / age +2.5/5.0
- Rent growth +2.4/5.0
- Schools +1.5/10.0
- ARV discount +0.0/15.0
- Appreciation +0.0/10.0
$475,000
🖨 Deal sheet 📄 Offer letter ✓ Due diligence
Multi-family units
County records classify this as Multi-Family (2-4 Unit). Listing-text estimate: 3 units. confirmed
Listing remarks MLS
Three family in need of Rehab, excellent investor opportunity, potential cash cow for its new owners. Exterior decks have been replaced, newer pex plumbing. Sold AS-IS.
Key facts
- On-street parking
- Updated and turnkey
- Highway access
Tags
Property features AI
Exterior
- Utilities: Public water connected; Public sewer connected; Electric service
- Home design: 3-family multi-family property; Frame construction; Yellow exterior
- Construction: Asphalt shingle roof; Vinyl siding; Masonry and stone foundation
- Exterior features: Porch; Gutters; Exterior lighting; Sloping lot
Interior
- Bedrooms: 9 bedrooms total
- Bathrooms: 5 full bathrooms
- Heating & cooling: Hot water heat; Electric hot water; Window AC units
- Interior features: Full, unfinished basement; Has attic with crawl space and hatch access; Total of 15 rooms
- Laundry & utility: In-unit laundry hook-ups in each of the three units
Neighborhood map
What this means for you Summary
Snapshot
- This is a 2×3bd/1.7ba + 1×4bd/2ba units multifamily listed at $475k.
Deal economics
- At list price, monthly cash flow is $1k ($16k/yr) — positive. Per door: $448/mo.
- The deal already cash-flows at list — no discount required.
- Meets the 1% rule at list price ($5k rent vs $475k).
- Recommended offer: $468k (1.5% below list) — sets the bar for market timing.
- Cap rate 9.7% vs local median 3.6% in Waterbury — top-decile yield for the area; either an underpriced asset or a hidden risk that comps aren't pricing in. Stress-test before assuming the spread holds.
Location & tenants
- Location reads 79/100 on livability (#32 in CT, #2,205 nationally) — a middle-class / working-renter tenant base. Strengths: commute A+, cost of living A+, housing A+; Watch: schools D+, crime D, employment D.
- Waterbury School District (suburban): math 12% / reading 23% proficiency, ranked #148 of 153 in CT (top 97%) — low school quality limits family demand, transient renter base, plan for 1-2y turnover; 73% free/reduced lunch — lower-income household profile, screen leases tightly.
- Market conditions: Rents soft (-0.4%/yr); 32 active listings in the ZIP; 1 comparable units currently listed for rent nearby; lower-income renter base — watch delinquency; 502 units permitted in Naugatuck Valley Planning Region in 2024 (171 in 5+ unit buildings).
- At $5,491/mo this rent would consume 177% of the median local household income ($37k/yr) (locally 856% of renters already pay >50% of income on rent) — very limited rent-growth headroom before tenants either downsize or default.
Forward outlook
- Local home prices are declining (-3.0%/yr); year-one equity from $3k of loan paydown is wiped out by about $14k of value loss. Plan a longer hold.
Negotiation context
- It's been on market 21 days — a 2% lower offer ($468k) is reasonable based on typical stale-listing flexibility.
- 4 sale attempts since 8y ago with the ask held roughly flat each time — persistent listings suggest the price (not the market) is what's stuck; bring a comps-based counter.
- Current owner paid $44k; list at $475k implies a 980% gain — meaningful room to come down on a strong offer.
Risks & watch-outs
- Watch-outs: built in 1898 — expect roof / HVAC / electrical / plumbing capex.
- Climate carrying-cost: major wind risk, 27% chance of damaging wind over 30y; extreme-heat days projected 7→15/yr by 2055 (HVAC capex compounding) — expect insurance premiums to compound above CPI over the hold.
Questions for the listing agent
- Can we see the unit-by-unit rent roll, current vacancy, and any below-market leases? What's the average tenancy length?
- What capital expenditures (roof, boiler, parking lot, exteriors) have been made in the last 5 years, and what's planned in the next 2?
- Built in 1898 — when were the roof, HVAC, electrical panel, plumbing, and water heater last replaced?
- Is there a deadline driving the sale (1031 exchange, divorce, estate, relocation)? That informs how much negotiation room exists.
- Schools are D-rated, which usually means shorter tenancies and higher turnover. Who's the typical renter profile here, and what's been the actual vacancy rate?
- Crime grade is D in this area — have there been break-ins, vandalism, or insurance claims at this property in the last 3 years? What carrier currently insures it and at what premium?
- What's the average days-on-market for RENTAL listings here right now (not sales)? A rising rental-DOM trend means longer vacancies and softer asking-rent achievability than the comps imply.
- What's the recent tenant-quality profile in this submarket — average credit score on applications, eviction rate, late-payment / NSF rate, and stable-employment percentage? A property-management company in the area should have these aggregated.
- How much new apartment / multifamily construction is in the pipeline within 1–3 miles? Heavy new supply (>2% of stock underway) typically softens rents 12–24 months out; light construction supports rent growth.
Investment metrics
- 1% rule
- 1.16% ✓
- Cap rate
- 9.69%
- Cash-on-cash
- 12.14%
- DSCR
- 1.54
- GRM
- 7.2
CMA / ARV
- ARV (median comp)
- $380,072
- List price
- $475,000
- Delta
- 24.98%
- Verdict
- OVERPRICED
- Comps
- 20 within 1.0 mi
Show comp detail 12 sales within ~0.75 mi
| Address | Dist | Beds/Ba | Sqft | Sold | Price | $/sf | Match |
|---|---|---|---|---|---|---|---|
| 16 Arch St | 0.05mi | 9/3.0 | 3,282 (-9%) | 2mo | $495,000 | $151 | 81 |
| 55 Plaza Ave | 0.11mi | 10/3.0 (+1) | 3,733 (+4%) | 3mo | $475,000 | $127 | 81 |
| 50 Elmwood Ave | 0.18mi | 8/3.0 (-1) | 3,563 (-1%) | 10mo | $170,000 | $48 | 76 |
| 215 Woodlawn Ter | 0.09mi | 10/3.0 (+1) | 3,410 (-5%) | 7mo | $473,000 | $139 | 76 |
| 127 Pearl St | 0.50mi | 9/3.0 | 3,636 (+1%) | 4mo | $397,800 | $109 | 72 |
| 156 Waterville St | 0.18mi | 8/3.0 (-1) | 3,732 (+4%) | 11mo | $540,000 | $145 | 72 |
| 16 Plaza Ave | 0.10mi | 8/3.0 (-1) | 3,178 (-12%) | 1mo | $455,000 | $143 | 70 |
| 26 Ridgewood St | 0.11mi | 10/5.5 (+1) | 3,415 (-5%) | 6mo | $435,000 | $127 | 66 |
| 35 Frederick St | 0.16mi | 8/3.0 (-1) | 3,088 (-14%) | 3mo | $255,000 | $83 | 61 |
| 70 Elmwood Ave | 0.21mi | 8/3.0 (-1) | 3,175 (-12%) | 10mo | $452,000 | $142 | 58 |
| 50 Manhan St | 0.28mi | 8/3.0 (-1) | 3,100 (-14%) | 10mo | $400,000 | $129 | 50 |
| 484 Waterville St | 0.47mi | 10/4.0 (+1) | 4,074 (+13%) | 1mo | $480,000 | $118 | 46 |
Match score weights: distance 35% · size 25% · config 20% · recency 20%. Top-matched comps best support the ARV.
Projected returns pro-forma
-3.0% appreciation · 0.0% rent growth · sell at horizon
- IRR
- -1.5%
- Equity multiple
- 0.94×
- Total profit
- $-7,477
- Equity at exit
- $70,824
- IRR
- 4.8%
- Equity multiple
- 1.31×
- Total profit
- $41,241
- Equity at exit
- $41,069
Cash invested: $133,000 (down + closing). Projections, not guarantees.
Landlord ↔ Tenant lean methodology
- Overall (STATE)
- 27 Tenant-Leaning
- State Connecticut
- 27 Tenant-Leaning · D+7
- County
- — inherits STATE
- City
- — inherits STATE
ZIP-level market 06710
- Home prices YoY
- -8.1%
- Rents YoY
- -0.4%
- Active inventory
- 32
- Price-to-rent
- 22.5×
Monthly cashflow live
- Estimated rent
- $5,491 high interval (Pro) →
- Mortgage (P&I)
- −$2,491
- Tax from tax record
- −$304 /mo · $3,645/yr
- Insurance
- −$198
- HOA
- −$0
- Vacancy / Maint / Mgmt
- −$1,153
- Net cashflow
- $1,345
Break-even live
3-unit breakdown (identical units grouped — click to expand)
| Units | Beds | Baths | Est. rent |
|---|---|---|---|
| 2× units | 3 | 1.7 | $3,522 |
| #1 | 3 | 1.7 | $1,761 |
| #2 | 3 | 1.7 | $1,761 |
| 1× unit | 4 | 2 | $1,969 |
| Total (3 units) | $5,491 | ||
UW: 25.0% down · 7.5% · 30yr · 1.5% tax · 5.0% vac · 8.0% maint · 8.0% mgmt
Financing live
Cash to close
- Down payment
- $118,750
- Closing costs
- $14,250
- Reserves months
- —
- Total cash needed
- —
Loan-product check · same deal, 3 products live
Conventional
25% down · 7.5% · 30yr
- Down + closing
- —
- Monthly P&I
- —
- Monthly cashflow
- —
- DSCR
- —
- Eligible?
- —
Personal DTI + credit; lowest rate.
DSCR
20% down · 8.5% · 30yr
- Down + closing
- —
- Monthly P&I
- —
- Monthly cashflow
- —
- DSCR
- —
- Eligible?
- —
No personal income docs; deal must DSCR.
Hard money
10% down · 12.0% · 12mo
- Down + closing
- —
- Monthly P&I
- —
- Monthly cashflow
- —
- DSCR
- —
- Eligible?
- —
Short-term bridge; refi at stabilization.
Rent comps 1 comps
| Address | Beds | Baths | Sqft | Rent | $/sqft | DOM | Units | Dist |
|---|---|---|---|---|---|---|---|---|
| 20 Coe St Waterbury, CT | 9.0 | 3.0 | 3240 | $1,800 | $0.56 | 3d | 1 | 1.00mi |
Listing history 10 events
-
2026-05-06$475,000 Active 977-char remark
-
2025-10-20historical
-
2025-09-15price $450,000
-
2025-08-29$465,000 Active
-
2019-04-17soldstatus $44,000
-
2019-04-12soldstatus $44,000 Closed
Show marketing remark (168 chars)
Three family in need of Rehab, excellent investor opportunity, potential cash cow for its new owners. Exterior decks have been replaced, newer pex plumbing. Sold AS-IS.
-
2019-03-15historical Under Contract - Continue to Show
Show marketing remark (168 chars)
Three family in need of Rehab, excellent investor opportunity, potential cash cow for its new owners. Exterior decks have been replaced, newer pex plumbing. Sold AS-IS.
-
2019-02-25$54,900 Active
Show marketing remark (168 chars)
Three family in need of Rehab, excellent investor opportunity, potential cash cow for its new owners. Exterior decks have been replaced, newer pex plumbing. Sold AS-IS.
-
2018-02-14soldstatus $16,000
-
2018-01-22$15,000
ⓘ Source: listings_history table (triggers on properties + properties_extension) + one-shot
backfill from property_details.listing_events for pre-trigger history.
Tax reassessment forecast CT · Partial reset (capped growth)
- Current annual tax
- $3,645 · $304/mo
- Projected year-2 tax
- $6,905 · $575/mo
- Expected delta
- +$3,260/yr (+$272/mo · 89.4%)
ⓘ Screening estimate from a state-policy table — verify with the county assessor before closing.
Climate risk First Street
- Flood 1/10 Low FEMA zone X (unshaded) · 0% chance over 30 yrs
- Wildfire 1/10 Low
- Heat 5/10 Major 7 d/yr ≥96°F today · 15 d/yr by 30 yrs out
- Wind 6/10 Major 27% chance of damaging wind over 30 yrs
- Air quality 3/10 Moderate 2 unhealthy d/yr today · 3 by 30 yrs out
Nearby sold comps map
Loading sold comps map…
Walkable amenities ~0.75 mi
Loading nearby amenities…
Taxation est. · year 1
- Rental income
- $65,892
- − Mortgage interest
- −$26,607
- − Property taxes
- −$3,645
- − Insurance
- −$2,375
- − Repairs & maintenance
- −$5,271
- − Management
- −$5,271
- − Depreciation
- −$13,818
- Taxable income
- $8,904
- Est. tax owed @ 24.0%
- −$2,137
- After-tax cash flow
- $14,006/yr
For passive investors: Depreciation is non-cash, so a rental often shows a tax loss while cash-flowing — sheltering income. Rental losses are passive: they offset passive income freely, and up to $25,000/yr can offset ordinary (W-2) income if you actively participate and your MAGI is under $100k (phasing out to $0 by $150k); unused losses carry forward. On sale, claimed depreciation is recaptured at up to 25%, and gains may owe capital-gains tax (a 1031 exchange can defer both). Figures are a year-1 estimate at your 24.0% rate — not tax advice; consult a CPA.
Schools (NCES district)
- District
- Waterbury School District
- NCES district ID
- 0904830
- Math proficiency
- 12% ▼ -7.00%
- Reading proficiency
- 23% ▼ -8.00%
- Median HH income
- $40,040
- Composite
- 14.85/100
- National rank
- #9380
- State rank
- #148 of 153 in CT
Livability — Waterbury
- Score
- 79/100
- State rank
- #32
- US rank
- #2205
Category grades
Schools grade is shown separately in the Schools card above.
Census & demographics
- Census place
- Waterbury, CT
- County
- New Haven County · 688,236 people
- City population
- 115,012
- Metro
- New Haven-Milford, CT
- Population (ZIP)
- 9,942
- Household income
- $37,191
- Rent vs Own
- Severe rent burden
- 856.0
Population outlook (Naugatuck Valley County) Hauer SSP2
- By 2040
- 496,846
Race, ethnicity, and origin ACS 2023
- Neighborhood character
- Highly diverse neighborhood (Simpson 0.74)
- Race & ethnicity
- Hispanic / Latino 33% Black 29% White 26% Two or more races 16% Asian 2%
- Hispanic origin (detail)
- Mexican 2% Puerto Rican 17% Cuban 2% Dominican 9%
- Common ancestry
- Romanian 2% Italian 2% Estonian 2%
- Foreign-born
- 16% · Canada, Mexico
- Languages at home
- 67% English-only · Spanish 27% Other Indo-European 3% Russian/Polish/Slavic 1%
Political lean MEDSL · Naugatuck Valley
- 2024 margin
- Lean R (+7.4) · D 45.6% · R 53.0% · Other 1.4%
- All cycles
- 2024: R+7.4
Not yet ingested
- Civics
- —
Market trends
- HPI YoY
- ▼ -26.17%
- Current HPI
- 296.1252
- Rent YoY
- ▼ -0.39%
- Metro
- New Haven-Milford, CT
- State GDP YoY
- ▲ 1.06%
- F500 in state
- 38
Industry mix (Fortune 500 HQ in CT)
| Industry | F500 HQs | Revenue |
|---|---|---|
| Industrial Machinery | 4 | $38B |
|
||
| Insurance | 3 | $71B |
|
||
| Financial Services | 2 | $25B |
|
||
| Transportation / Logistics | 2 | $18B |
|
||
| Healthcare | 1 | $247B |
|
||
| Telecommunications | 1 | $55B |
|
||
Price history
+3066.7% since first listed11 events — show timeline
- 2026-05-27 Pending — Smart MLS
- 2026-05-06 Listed $475,000 Smart MLS
- 2025-10-20 Listing Removed — Smart MLS
- 2025-09-15 Price Changed $450,000 Smart MLS
- 2025-08-29 Listed $465,000 Smart MLS
- 2019-04-17 Sold (Public Records) $44,000 Public Records
- 2019-04-12 Sold (MLS) $44,000 Smart MLS
- 2019-03-15 Contingent — Smart MLS
- 2019-02-25 Listed $54,900 Smart MLS
- 2018-02-14 Sold (MLS) $16,000 Smart MLS
- 2018-01-22 Listed $15,000 Smart MLS
Property tax history
+7.8%/yrLatest (2023): $3,645 · +136.4% YoY. Source: county tax records.
Cash-flow waterfall
monthlySold comps — $/sqft
last 12 mo · ≤1 miLoading sold comps…