 🏷️ Likely Rental
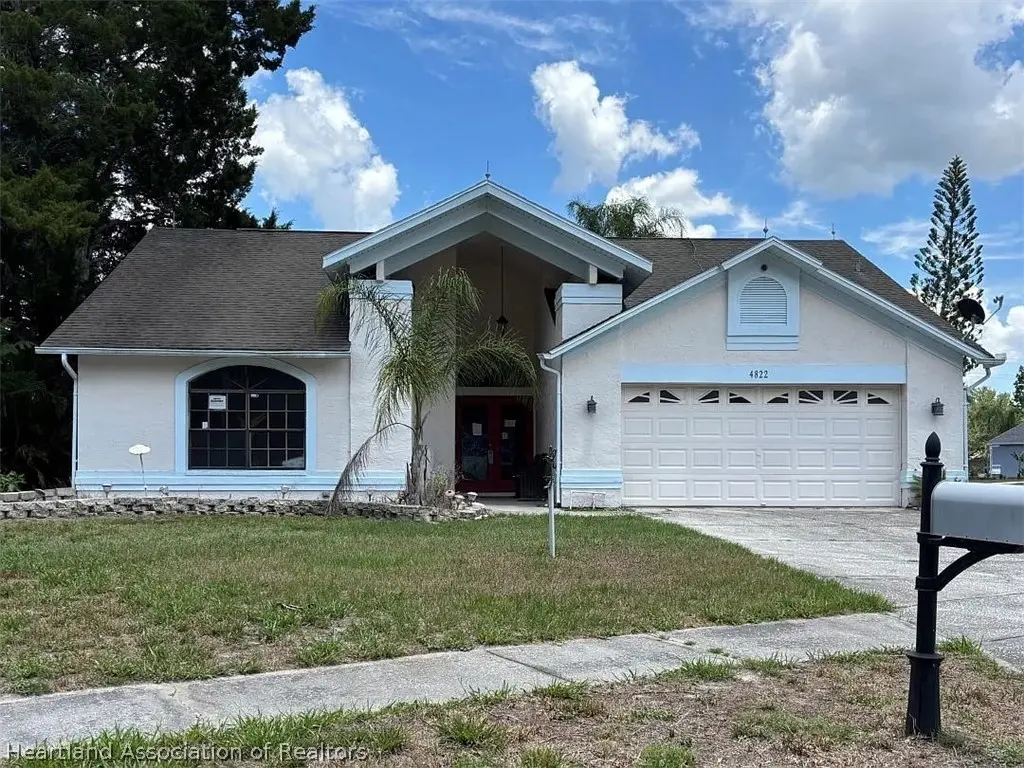
4822 Arbor Oaks Blvd · New Port Richey East, FL
Flood risk 1/10 · Minimal
- FEMA flood zone
- X (shaded)
- Chance of flooding over 30 yrs
- 0.0%
- Est. flood insurance / yr
- $507 – $1,088
Fire risk 4/10 · Minor
- Est. fire insurance / yr
- $947 – $1,759
Heat risk 10/10 · Severe
- Hot days now (above 108°F)
- 7 days/yr
- Hot days in 30 yrs
- 27 days/yr
Wind risk 10/10 · Severe
- Chance of severe wind over 30 yrs
- 99.0%
Air-quality risk 2/10 · Minimal
- Unhealthy air days now
- 1 days/yr
- Unhealthy air days in 30 yrs
- 1 days/yr
Risk factors via First Street. Map © Google.
Why this score? — see what drove the D grade
The composite is a weighted blend of 9 inputs, each scored 0–100. Each bar is that input's sub-score; the figure is the points it added to the 100-point composite (weight × sub-score).
- Cash flow +15.0/30.0
- ARV discount +7.5/15.0
- 1% rule +5.0/10.0
- DSCR +5.0/10.0
- Schools +4.3/10.0
- Livability +3.4/5.0
- Condition / age +2.5/5.0
- Rent growth +1.8/5.0
- Appreciation +0.0/10.0
$5,000
🖨 Deal sheet 📄 Offer letter ✓ Due diligence
Listing remarks MLS
Amazing Move-in ready pool home in Mill Run located on oversized corner lot. This home features : 3 bedrooms, 2 bathroom, 2 + Car Garage, & has many newer improvements including Large Kitchen with loads of cabinets, granite counters, stainless steel appliance, Flat Top Stove, & eat-in area. Spacious master suite with updated master bath that has double sinks, and separate shower, walk-in closets , vaulted ceilings, laundry room w/ cabinets & closet, Updated 2nd Bathroom with stone countertops, upgraded light fixtures & fans, Wood Flooring, huge screened-in brick pavered lanai w/ In ground pool & oversized yard, upgraded landscaping, and much more. Great location convenient to shopping, schools, medical, golf, restaurants, beaches, Tampa & new Trinity Hospital. Hurry won't last long!
Key facts
- 9,148 sq ft lot
- 2 garage spots
- Built 1991
Property features AI
Finance
- Other: Zoning: R4; Lot size about 0.21 acres
Exterior
- Parking: 2-car garage
- Utilities: Other water source; Other sewer
- Home design: Single-family residence; One level; Residential property
- Construction: Construction materials: see remarks
- Exterior features: Front porch; Other roof
Interior
- Bedrooms: 1 room total
- Flooring: Other flooring
- Bathrooms: 2 full bathrooms
- Heating & cooling: No heating specified; No cooling specified
- Interior features: Front porch
Neighborhood map
What this means for you Summary
Snapshot
- This is a 3-bed/2.0-bath single-family listed at $5k.
Deal economics
- At list price, monthly cash flow is $2k ($19k/yr) — positive.
- The deal already cash-flows at list — no discount required.
- Meets the 1% rule at list price ($2k rent vs $5k).
- Cap rate 383.8% vs local median 4.3% in New Port Richey East — top-decile yield for the area; either an underpriced asset or a hidden risk that comps aren't pricing in. Stress-test before assuming the spread holds.
Location & tenants
- Location reads 68/100 on livability (#499 in FL) — a middle-class / working-renter tenant base. Strengths: cost of living A+, housing A+, health & safety A+; Watch: amenities F, commute F, employment F.
- Pasco (suburban): math 50% / reading 52% proficiency, ranked #32 of 73 in FL (top 44%) — acceptable for families but not a draw, mixed tenant base, ~2y average lease.
- Market conditions: Rents soft (-2.9%/yr); 305 active listings in the ZIP; 33 comparable units currently listed for rent nearby; rentals at typical pace (median 17d on market — plan ~3-4 weeks tenant-placement turnaround); 6,765 units permitted in Pasco County in 2024 (1,250 in 5+ unit buildings).
- At $2,035/mo this rent would consume 49% of the median local household income ($50k/yr) (locally 1439% of renters already pay >50% of income on rent) — very limited rent-growth headroom before tenants either downsize or default.
Forward outlook
- Local home prices are declining (-3.0%/yr); year-one equity from $35 of loan paydown is wiped out by about $150 of value loss. Plan a longer hold.
- Pasco County population projected at +29% by 2050 — long-run rental-demand tailwind backs the buy-and-hold thesis.
- At projected returns (-3.0% appreciation + 0.0% rent growth), your $1k cash investment doubles in ~1 year — after that, you're playing with house money.
Negotiation context
- Only 11 days on market — expect competitive offers; lowballing is unlikely to land.
- 4 sale attempts since 13y ago with the ask held roughly flat each time — persistent listings suggest the price (not the market) is what's stuck; bring a comps-based counter.
Risks & watch-outs
- Climate carrying-cost: severe wind risk, 99% chance of damaging wind over 30y; extreme-heat days projected 7→27/yr by 2055 (HVAC capex compounding) — expect insurance premiums to compound above CPI over the hold.
Questions for the listing agent
- Is there a deadline driving the sale (1031 exchange, divorce, estate, relocation)? That informs how much negotiation room exists.
- Schools are A-rated — typically a magnet for longer-tenancy family renters. What's the average tenant stay here, and is there a school-zone premium baked into asking?
- The area grade is low — what's the realistic commute time and amenity access for the typical tenant pool here? Any planned neighborhood developments (good or bad) we should know about?
- What's the average days-on-market for RENTAL listings here right now (not sales)? A rising rental-DOM trend means longer vacancies and softer asking-rent achievability than the comps imply.
- What's the recent tenant-quality profile in this submarket — average credit score on applications, eviction rate, late-payment / NSF rate, and stable-employment percentage? A property-management company in the area should have these aggregated.
- How much new for-sale + rental construction is in the pipeline within 1–3 miles? Heavy new supply typically softens prices + rents 12–24 months out; constrained supply supports both.
Investment metrics
- 1% rule
- 40.70% ✓
- Cap rate
- 383.81%
- Cash-on-cash
- 1348.26%
- DSCR
- 60.99
- GRM
- 0.2
CMA / ARV
- ARV (on-the-fly)
- $338,208
- Comps found
- 12
Show comp detail 12 sales within ~0.75 mi
| Address | Dist | Beds/Ba | Sqft | Sold | Price | $/sf | Match |
|---|---|---|---|---|---|---|---|
| 7665 Deer Foot Dr | 0.29mi | 2/2.0 (-1) | 1,640 (+1%) | 2mo | $340,000 | $207 | 79 |
| 4752 Meadowsweet Ct | 0.07mi | 3/2.0 | 1,824 (+12%) | 0mo | $379,000 | $208 | 76 |
| 5147 Worth Ct | 0.38mi | 3/2.0 | 1,541 (-5%) | 4mo | $320,000 | $208 | 70 |
| 4434 Whitton Way | 0.42mi | 2/2.0 (-1) | 1,598 (-2%) | 4mo | $315,000 | $197 | 69 |
| 8041 Blue Finch Way | 0.39mi | 3/2.0 | 1,534 (-6%) | 5mo | $325,000 | $212 | 69 |
| 4550 Murcross Ln | 0.58mi | 3/2.0 | 1,563 (-4%) | 1mo | $399,000 | $255 | 66 |
| 4237 Northampton Dr | 0.56mi | 3/2.0 | 1,555 (-4%) | 2mo | $320,000 | $206 | 64 |
| 8357 Matthew Dr | 0.62mi | 3/2.0 | 1,593 (-2%) | 4mo | $360,000 | $226 | 64 |
| 4425 Black Fox Dr | 0.63mi | 3/2.0 | 1,549 (-5%) | 1mo | $320,000 | $207 | 62 |
| 4235 Manxcat Ln | 0.61mi | 3/2.0 | 1,549 (-5%) | 4mo | $305,000 | $197 | 60 |
| 4644 Sawgrass Blvd | 0.58mi | 3/2.5 | 1,717 (+6%) | 4mo | $305,000 | $178 | 58 |
| 4731 Spring Side Dr | 0.68mi | 3/2.0 | 1,820 (+12%) | 5mo | $480,000 | $264 | 44 |
Match score weights: distance 35% · size 25% · config 20% · recency 20%. Top-matched comps best support the ARV.
Projected returns pro-forma
-3.0% appreciation · 0.0% rent growth · sell at horizon
- IRR
- —
- Equity multiple
- 67.74×
- Total profit
- $93,440
- Equity at exit
- $746
- IRR
- —
- Equity multiple
- 134.89×
- Total profit
- $187,447
- Equity at exit
- $432
Cash invested: $1,400 (down + closing). Projections, not guarantees.
Landlord ↔ Tenant lean methodology
- Overall (STATE)
- 87 Strongly Landlord-Friendly
- State Florida
- 87 Strongly Landlord-Friendly · R+3
- County
- — inherits STATE
- City
- — inherits STATE
ZIP-level market 34653
- Home prices YoY
- -18.4%
- Rents YoY
- -2.9%
- Active inventory
- 305
- Price-to-rent
- 0.2×
Monthly cashflow live
- Estimated rent
- $2,035 high interval (Pro) →
- Mortgage (P&I)
- −$26
- Tax est. 1.5%
- −$6 /mo · $75/yr
- Insurance
- −$2
- HOA
- −$0
- Vacancy / Maint / Mgmt
- −$427
- Net cashflow
- $1,573
Break-even live
UW: 25.0% down · 7.5% · 30yr · 1.5% tax · 5.0% vac · 8.0% maint · 8.0% mgmt
Financing live
Cash to close
- Down payment
- $1,250
- Closing costs
- $150
- Reserves months
- —
- Total cash needed
- —
Loan-product check · same deal, 3 products live
Conventional
25% down · 7.5% · 30yr
- Down + closing
- —
- Monthly P&I
- —
- Monthly cashflow
- —
- DSCR
- —
- Eligible?
- —
Personal DTI + credit; lowest rate.
DSCR
20% down · 8.5% · 30yr
- Down + closing
- —
- Monthly P&I
- —
- Monthly cashflow
- —
- DSCR
- —
- Eligible?
- —
No personal income docs; deal must DSCR.
Hard money
10% down · 12.0% · 12mo
- Down + closing
- —
- Monthly P&I
- —
- Monthly cashflow
- —
- DSCR
- —
- Eligible?
- —
Short-term bridge; refi at stabilization.
Rent comps 33 comps
| Address | Beds | Baths | Sqft | Rent | $/sqft | DOM | Units | Dist |
|---|---|---|---|---|---|---|---|---|
| 4851 Mill Run Dr New Port Richey, FL | 3.0 | 2.0 | 1456 | $2,185 | $1.50 | 14d | 1 | 0.06mi |
| 5101 Glenhurst Ln New Port Richey, FL | 3.0 | 2.0 | 1419 | $2,310 | $1.63 | 4d | 1 | 0.28mi |
| 7704 Riverdale Dr New Port Richey, FL | 3.0 | 2.0 | 1320 | $1,916 | $1.45 | 4d | 1 | 0.39mi |
| 8107 Blue Finch Way New Port Richey, FL | 3.0 | 2.0 | 1320 | $1,975 | $1.50 | 24d | 1 | 0.41mi |
| 8135 Brown Pelican Ave New Port Richey, FL | 2.0 | 2.0 | 1089 | $2,000 | $1.84 | 4d | 1 | 0.48mi |
| 8403 Yearling Ln New Port Richey, FL | 3.0 | 2.0 | 1277 | $2,125 | $1.66 | 10d | 1 | 0.62mi |
| 4420 Sawgrass Blvd New Port Richey, FL | 3.0 | 2.0 | 1400 | $2,300 | $1.64 | 24d | 1 | 0.63mi |
| 4347 Otter Way New Port Richey, FL | 3.0 | 2.0 | 1344 | $1,715 | $1.28 | 1d | 1 | 0.65mi |
| 8504 Yearling Ln New Port Richey, FL | 4.0 | 2.0 | 1649 | $2,550 | $1.55 | 17d | 1 | 0.70mi |
| 4331 Fiji Dr New Port Richey, FL | 1.0–5.0 | 2.0–5.0 | 1343 | $1,708 | $1.27 | 3d | 11 | 0.72mi |
| 8504 Shallow Creek Ct New Port Richey, FL | 3.0 | 2.5 | 1686 | $2,050 | $1.22 | 24d | 1 | 0.84mi |
| 8712 Cypress Lakes Blvd New Port Richey, FL | 3.0 | 2.0 | 1729 | $2,240 | $1.30 | 14d | 1 | 0.88mi |
| 7733 Atherton Ave New Port Richey, FL | 2.0 | 2.0 | 1291 | $1,775 | $1.37 | 16d | 1 | 1.00mi |
| 8559 Pilgrim Ct New Port Richey, FL | 2.0 | 1.5 | 1236 | $1,500 | $1.21 | 20d | 1 | 1.00mi |
| 8563 Pilgrim Ct New Port Richey, FL | 2.0 | 1.5 | 1236 | $1,400 | $1.13 | 4d | 1 | 1.00mi |
| 6807 Porter Rd Unit PGC C-5432-209 New Port Richey, FL | 2.0 | 2.0 | 1100 | $1,300 | $1.18 | 17d | 1 | 1.03mi |
| 6807 Porter Rd Unit PCG G-101 New Port Richey, FL | 3.0 | 1.5 | 1080 | $1,375 | $1.27 | 4d | 1 | 1.03mi |
| 7911 Aden Loop New Port Richey, FL | 3.0 | 2.0 | 1067 | $1,785 | $1.67 | 24d | 1 | 1.04mi |
| 3707 Mexicali St New Port Richey, FL | 3.0 | 2.0 | 1185 | $1,925 | $1.62 | 4d | 1 | 1.11mi |
| 7742 Arlight Dr New Port Richey, FL | 3.0 | 2.0 | 1653 | $1,995 | $1.21 | 24d | 1 | 1.12mi |
| 7441 Carmel Ave New Port Richey, FL | 3.0 | 1.0 | 1238 | $1,875 | $1.51 | 2d | 1 | 1.15mi |
| 7239 Belvedere Ter New Port Richey, FL | 4.0 | 2.0 | 1200 | $2,800 | $2.33 | 17d | 1 | 1.20mi |
| 9026 Severn Ln New Port Richey, FL | 2.0 | 2.0 | 1476 | $1,800 | $1.22 | 3d | 1 | 1.20mi |
| 3602 Murrow St New Port Richey, FL | 3.0 | 2.0 | 1283 | $2,090 | $1.63 | 4d | 1 | 1.22mi |
| 5223 Hunters Ridge Dr New Port Richey, FL | 1.0–2.0 | 1.0–2.0 | 1128 | $2,235 | $1.98 | 21d | 5 | 1.30mi |
| 3455 Monte Rio St New Port Richey, FL | 2.0 | 2.0 | 1291 | $1,775 | $1.37 | 17d | 1 | 1.34mi |
| 7220 Exemplar Dr New Port Richey, FL | 4.0 | 2.0 | 1433 | $2,085 | $1.45 | 24d | 1 | 1.35mi |
| 8930 Lazy River Loop New Port Richey, FL | 1.0–3.0 | 1.0–2.0 | 1018 | $1,869 | $1.84 | 1d | 12 | 1.40mi |
| 7543 Ivory Ter New Port Richey, FL | 3.0 | 2.0 | 1653 | $1,895 | $1.15 | 24d | 1 | 1.40mi |
| 4233 Belle Isle Ct New Port Richey, FL | 3.0 | 2.0 | 1275 | $1,895 | $1.49 | 19d | 1 | 1.41mi |
| 4233 Belle Isle Ct New Port Richey, FL | 3.0 | 2.0 | 1275 | $1,950 | $1.53 | 24d | 1 | 1.41mi |
| 3406 Murrow St New Port Richey, FL | 2.0 | 1.0 | 1262 | $1,750 | $1.39 | 1d | 1 | 1.41mi |
| 8248 Corner Pine Way New Port Richey, FL | 3.0 | 2.5 | 1634 | $2,200 | $1.35 | 21d | 1 | 1.47mi |
Listing history 8 events
-
2026-06-09days on market $5,000 Active 11 DOM
-
2026-06-08days on market $5,000 Active 10 DOM
-
2026-06-07days on market $5,000 Active 9 DOM
-
2026-06-04days on market $5,000 Active 6 DOM
-
2026-06-03days on market $5,000 Active 5 DOM
-
2026-06-02days on market $5,000 Active 4 DOM
-
2026-06-01days on market $5,000 Active 3 DOM
-
2026-05-31days on market $5,000 Active 2 DOM
ⓘ Source: listings_history table (triggers on properties + properties_extension) + one-shot
backfill from property_details.listing_events for pre-trigger history.
Climate risk First Street
- Flood 1/10 Low FEMA zone X (shaded) · 0% chance over 30 yrs
- Wildfire 4/10 Moderate
- Heat 10/10 Extreme 7 d/yr ≥108°F today · 27 d/yr by 30 yrs out
- Wind 10/10 Extreme 99% chance of damaging wind over 30 yrs
- Air quality 2/10 Low 1 unhealthy d/yr today · 1 by 30 yrs out
Nearby sold comps map
Loading sold comps map…
Walkable amenities ~0.75 mi
Loading nearby amenities…
Taxation est. · year 1
- Rental income
- $24,418
- − Mortgage interest
- −$280
- − Property taxes
- −$75
- − Insurance
- −$25
- − Repairs & maintenance
- −$1,953
- − Management
- −$1,953
- − Depreciation
- −$145
- Taxable income
- $19,986
- Est. tax owed @ 24.0%
- −$4,797
- After-tax cash flow
- $14,079/yr
For passive investors: Depreciation is non-cash, so a rental often shows a tax loss while cash-flowing — sheltering income. Rental losses are passive: they offset passive income freely, and up to $25,000/yr can offset ordinary (W-2) income if you actively participate and your MAGI is under $100k (phasing out to $0 by $150k); unused losses carry forward. On sale, claimed depreciation is recaptured at up to 25%, and gains may owe capital-gains tax (a 1031 exchange can defer both). Figures are a year-1 estimate at your 24.0% rate — not tax advice; consult a CPA.
Schools (NCES district)
- District
- Pasco
- NCES district ID
- 1201530
- Math proficiency
- 50% ▼ -10.00%
- Reading proficiency
- 52% ▼ -5.00%
- Median HH income
- $45,039
- Composite
- 43.14/100
- National rank
- #3074
- State rank
- #32 of 73 in FL
Livability — New Port Richey East
- Score
- 68/100
- State rank
- #499
- US rank
- #9203
Category grades
Schools grade is shown separately in the Schools card above.
Census & demographics
- County
- Pasco County · 524,098 people
- City population
- 36,086
- Metro
- Tampa-St. Petersburg-Clearwater, FL
- Population (ZIP)
- 35,945
- Household income
- $49,563
- Rent vs Own
- Severe rent burden
- 1439.0
Population outlook (Pasco County) Hauer SSP2
- Today (2025)
- 570,045 people
- By 2030
- 605,844 · +6.3%
- By 2040
- 674,806 · +18.4%
- By 2050
- 736,022 · +29.1%
- By 2075
- 862,900 · +51.4%
- By 2100
- 906,364 · +59.0%
Race, ethnicity, and origin ACS 2023
- Neighborhood character
- Predominantly White (74%)
- Race & ethnicity
- White 74% Hispanic / Latino 14% Two or more races 9% Black 6% Asian 2%
- Hispanic origin (detail)
- Mexican 3% Puerto Rican 4% Cuban 2%
- Common ancestry
- Romanian 3% Lithuanian 2% Slovak 2%
- Foreign-born
- 11% · Canada, Jamaica, China
- Languages at home
- 84% English-only · Spanish 9% Other Indo-European 2% Russian/Polish/Slavic 2%
Political lean MEDSL · Pasco
- 2024 margin
- Strong R (+25.2) · D 36.9% · R 62.1% · Other 1.0%
- 2008→2024 swing
- -21.6pp toward R · 2008: -3.6pp · 2024: -25.2pp
- All cycles
- 2024: R+25.2 2020: R+20.1 2016: R+21.6 2012: R+6.7 2008: R+3.6
Not yet ingested
- Civics
- —
Market trends
- HPI YoY
- ▼ -73.10%
- Current HPI
- 324.6519
- Rent YoY
- ▼ -2.92%
- Metro
- Tampa-St. Petersburg-Clearwater, FL
- State GDP YoY
- ▲ 3.28%
- F500 in state
- 36
Industry mix (Fortune 500 HQ in FL)
| Industry | F500 HQs | Revenue |
|---|---|---|
| Industrial Technology | 2 | $29B |
|
||
| Insurance | 2 | $17B |
|
||
| Retail | 1 | $60B |
|
||
| Technology Distribution | 1 | $58B |
|
||
| Homebuilding | 1 | $35B |
|
||
| Technology Manufacturing | 1 | $35B |
|
||
Price history
-94.6% since first listed16 events — show timeline
- 2026-05-29 Listed $5,000 HAOR as distributed by MLS GRID
- 2025-04-16 Listing Removed — Stellar MLS as Distributed by MLS Grid
- 2025-04-09 Listed $259,000 Stellar MLS as Distributed by MLS Grid
- 2014-06-18 Sold (Public Records) $179,000 Public Records
- 2014-06-12 Sold (MLS) $179,000 Stellar MLS as Distributed by MLS Grid
- 2014-06-10 Listing Removed — Stellar MLS as Distributed by MLS Grid
- 2014-04-29 Contingent — Stellar MLS as Distributed by MLS Grid
- 2014-04-21 Pending — Stellar MLS as Distributed by MLS Grid
- 2014-04-21 Pending — Stellar MLS as Distributed by MLS Grid
- 2014-04-21 Price Changed $184,900 Stellar MLS as Distributed by MLS Grid
- 2014-04-05 Relisted — Stellar MLS as Distributed by MLS Grid
- 2014-03-29 Pending — Stellar MLS as Distributed by MLS Grid
- 2013-09-19 Listed $199,900 Stellar MLS as Distributed by MLS Grid
- 2002-03-01 Sold (Public Records) $144,000 Public Records
- 2001-01-18 Sold (Public Records) $134,000 Public Records
- 1995-04-13 Sold (Public Records) $92,500 Public Records
Property tax history
+4.5%/yrLatest (2025): $2,801 · +2.6% YoY. Source: county tax records.
Cash-flow waterfall
monthlySold comps — $/sqft
last 12 mo · ≤1 miLoading sold comps…