3630 Ranch Rd Unit 11-8 · Forest Acres, SC
Flood risk 1/10 · Minimal
- FEMA flood zone
- X (unshaded)
- Chance of flooding over 30 yrs
- 0.0%
- Est. flood insurance / yr
- $507 – $1,088
Fire risk 3/10 · Minor
- Est. fire insurance / yr
- $783 – $1,453
Heat risk 7/10 · Major
- Hot days now (above 108°F)
- 7 days/yr
- Hot days in 30 yrs
- 16 days/yr
Wind risk 6/10 · Moderate
- Chance of severe wind over 30 yrs
- 67.0%
Air-quality risk 3/10 · Minor
- Unhealthy air days now
- 2 days/yr
- Unhealthy air days in 30 yrs
- 2 days/yr
Risk factors via First Street. Map © Google.
Why this score? — see what drove the C- grade
The composite is a weighted blend of 9 inputs, each scored 0–100. Each bar is that input's sub-score; the figure is the points it added to the 100-point composite (weight × sub-score).
- Cash flow +16.9/30.0
- ARV discount +7.5/15.0
- 1% rule +6.8/10.0
- DSCR +5.3/10.0
- Appreciation +5.0/10.0
- Livability +3.7/5.0
- Schools +3.6/10.0
- Rent growth +2.5/5.0
- Condition / age +2.5/5.0
$110,000
🖨 Deal sheet 📄 Offer letter ✓ Due diligence
Listing remarks
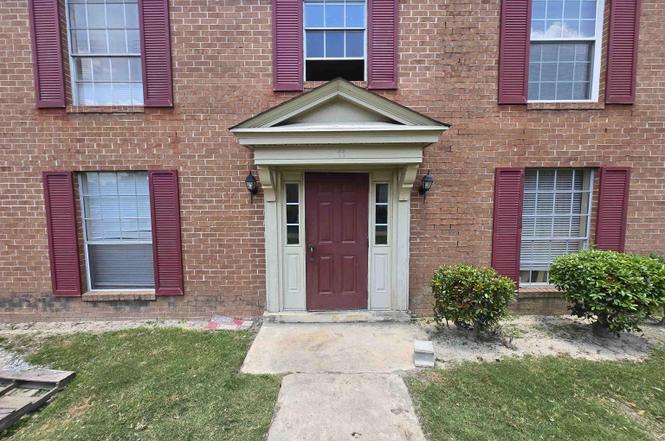
Step into comfort and convenience with this beautifully renovated 2-bedroom, 2-bath condo, offering the perfect blend of functionality and style with New Windows, and the open-concept dining and living area, ideal for relaxing and entertaining. The kitchen features modern appliances, and ample cabinet space. The spacious primary suite boasts a private ensuite bathroom and a generous large closet, while the second bedroom is perfect for guests, a home office or a roommate setup - conveniently located next to the second full bath. Additional highlights include private balcony/patio w/ in laundry, and most of all, it has an assigned parking spot. Disclaimer: CMLS has not reviewed and, therefo
Key facts
- Private balcony
- Modern appliances
- Ample cabinet space
Tags
Property features AI
Finance
- Other: Directions: From SC-277 N; take the Parklane Road exit; stay on Parklane Road and cross over Two Notch Road to Decker Blvd; turn right onto Ranch Road; condos on the left.
- HOA & community: Has association; Association maintains front and back yards, landscaping, common areas, exterior, sidewalks, street lights, roads, and green areas; Community features include a clubhouse and security
Exterior
- Parking: One parking space
- Security: Community security included in association services
- Utilities: Public water; Public sewer
- Home design: Single-story unit; Faces unspecified
- Construction: Slab foundation
- Exterior features: Patio; Screened porch; Brick exterior above foundation
Interior
- Kitchen: Painted cabinets; Other countertops; Dishwasher; Disposal; Refrigerator; Stove exhaust vented outside; Free-standing range
- Bedrooms: Master bedroom on main level with his-and-hers closets, private bath, ceiling fan, and laminate floors; Second bedroom on main level with his-and-hers closets, ceiling fan, and laminate floors
- Flooring: Laminate flooring; Luxury vinyl plank flooring; Parquet flooring
- Bathrooms: Two full bathrooms
- Heating & cooling: Central heating; Central air conditioning
- Interior features: Ceiling fans in main living areas; Laminate and luxury vinyl plank flooring in living and formal living areas; Parquet and luxury vinyl plank flooring in kitchen; Unheated laundry space on main level
- Laundry & utility: Washer/dryer area on main level (unheated space)
Neighborhood map
What this means for you Summary
Snapshot
- This is a 2-bed/2.0-bath condo listed at $110k.
Deal economics
- At list price, monthly cash flow is $72 ($867/yr) — positive.
- The deal already cash-flows at list — no discount required.
- Meets the 1% rule at list price ($1k rent vs $110k).
- Recommended offer: $97k (12.0% below list) — sets the bar for market timing.
Location & tenants
- Location reads 73/100 on livability (#39 in SC) — a middle-class / working-renter tenant base. Strengths: housing A+, cost of living A, employment A-; Watch: crime D, amenities F, commute F.
- Richland 02 (suburban): math 35% / reading 47% proficiency, ranked #29 of 80 in SC (top 36%) — families likely to look elsewhere, expect single-tenant / working-renter base with shorter leases.
- Zoned schools: Forest Lake Elementary (math 42% / reading 46%, grade F, #239 of 597 statewide, top 41%, 614 students, 70% FRL) — zoned schools average 70% FRL vs 38% district-wide (32 pts higher); higher-poverty schools than district average — tighter screening recommended.
- Market conditions: 2 active listings in the ZIP; 19 comparable units currently listed for rent nearby; rentals at typical pace (median 24d on market — plan ~3-4 weeks tenant-placement turnaround); 3,472 units permitted in Richland County in 2024 (1,096 in 5+ unit buildings).
Forward outlook
- In year one you build about $4k of equity ($761 loan paydown + $3k appreciation (3.0% local appreciation)).
- Richland County population projected at +30% by 2050 — long-run rental-demand tailwind backs the buy-and-hold thesis.
- At projected returns (3.0% appreciation + 3.0% rent growth), your $31k cash investment doubles in ~6 years — after that, you're playing with house money.
- By year 8, paydown + projected appreciation supports a ~$30k cash-out refi (75% LTV) — recoverable capital for the next deal without selling this one.
Negotiation context
- It's been on market 358 days — a 12% lower offer ($97k) is reasonable based on typical stale-listing flexibility.
- Current owner paid $45k; list at $110k implies a 144% gain — meaningful room to come down on a strong offer.
Risks & watch-outs
- Watch-outs: HOA is 21% of rent.
- Climate carrying-cost: major wind risk, 67% chance of damaging wind over 30y; extreme-heat days projected 7→16/yr by 2055 (HVAC capex compounding) — expect insurance premiums to compound above CPI over the hold.
Questions for the listing agent
- It's been on market 358 days. Have you received any prior offers? Is the seller open to a 12% concession, seller financing, or rate buy-down credit?
- Built in 1971 — when were the roof, HVAC, electrical panel, plumbing, and water heater last replaced?
- What does the HOA fee cover, when was the last increase, and are there any pending special assessments or reserve-fund shortfalls?
- Any open or pending special assessments — roof, HVAC, plumbing, elevator, façade? What's the per-unit balance and payoff schedule, and is the seller paying it off at close or rolling it to the buyer?
- Why hasn't it sold? Are there any deal-killer items the seller is aware of (foundation, flood, title, zoning, code violations)?
- Is there a deadline driving the sale (1031 exchange, divorce, estate, relocation)? That informs how much negotiation room exists.
- Schools are A-rated — typically a magnet for longer-tenancy family renters. What's the average tenant stay here, and is there a school-zone premium baked into asking?
- Crime grade is D in this area — have there been break-ins, vandalism, or insurance claims at this property in the last 3 years? What carrier currently insures it and at what premium?
- What's the average days-on-market for RENTAL listings here right now (not sales)? A rising rental-DOM trend means longer vacancies and softer asking-rent achievability than the comps imply.
- What's the recent tenant-quality profile in this submarket — average credit score on applications, eviction rate, late-payment / NSF rate, and stable-employment percentage? A property-management company in the area should have these aggregated.
- How much new apartment / multifamily construction is in the pipeline within 1–3 miles? Heavy new supply (>2% of stock underway) typically softens rents 12–24 months out; light construction supports rent growth.
Investment metrics
- 1% rule
- 1.18% ✓
- Cap rate
- 7.08%
- Cash-on-cash
- 2.81%
- DSCR
- 1.13
- GRM
- 7.1
CMA / ARV
No comps found within radius.
Projected returns pro-forma
3.0% appreciation · 3.0% rent growth · sell at horizon
- IRR
- 10.2%
- Equity multiple
- 1.58×
- Total profit
- $17,987
- Equity at exit
- $49,461
- IRR
- 12.6%
- Equity multiple
- 2.88×
- Total profit
- $57,790
- Equity at exit
- $76,225
Cash invested: $30,800 (down + closing). Projections, not guarantees.
Landlord ↔ Tenant lean methodology
- Overall (STATE)
- 90 Strongly Landlord-Friendly
- State South Carolina
- 90 Strongly Landlord-Friendly · R+6
- County
- — inherits STATE
- City
- — inherits STATE
ZIP-level market 29260
- Active inventory
- 2
- Price-to-rent
- 7.1×
Monthly cashflow live
- Estimated rent
- $1,294 high interval (Pro) →
- Mortgage (P&I)
- −$577
- Tax from tax record
- −$52 /mo · $625/yr
- Insurance
- −$46
- HOA
- −$275
- Vacancy / Maint / Mgmt
- −$272
- Net cashflow
- $72
Break-even live
UW: 25.0% down · 7.5% · 30yr · 1.5% tax · 5.0% vac · 8.0% maint · 8.0% mgmt
Financing live
Cash to close
- Down payment
- $27,500
- Closing costs
- $3,300
- Reserves months
- —
- Total cash needed
- —
Loan-product check · same deal, 3 products live
Conventional
25% down · 7.5% · 30yr
- Down + closing
- —
- Monthly P&I
- —
- Monthly cashflow
- —
- DSCR
- —
- Eligible?
- —
Personal DTI + credit; lowest rate.
DSCR
20% down · 8.5% · 30yr
- Down + closing
- —
- Monthly P&I
- —
- Monthly cashflow
- —
- DSCR
- —
- Eligible?
- —
No personal income docs; deal must DSCR.
Hard money
10% down · 12.0% · 12mo
- Down + closing
- —
- Monthly P&I
- —
- Monthly cashflow
- —
- DSCR
- —
- Eligible?
- —
Short-term bridge; refi at stabilization.
Rent comps 19 comps
| Address | Beds | Baths | Sqft | Rent | $/sqft | DOM | Units | Dist |
|---|---|---|---|---|---|---|---|---|
| 3630 Ranch Rd Unit 3-8 Columbia, SC | 2.0 | 2.0 | 1400 | $1,250 | $0.89 | 23d | 1 | 0.03mi |
| 3611 Ranch Rd Columbia, SC | 2.0–3.0 | 2.0 | 1400 | $1,250 | $0.89 | 3d | 3 | 0.10mi |
| 1930 Greenoaks Rd Unit A Columbia, SC | 2.0 | 1.5 | 900 | $1,175 | $1.31 | 11d | 1 | 0.46mi |
| 1633 Overhill Rd Columbia, SC | 3.0 | 1.5 | 1052 | $1,661 | $1.58 | 23d | 1 | 0.55mi |
| 2102 Long Shadow Ln Columbia, SC | 2.0 | 1.5 | 1150 | $1,300 | $1.13 | 3d | 1 | 0.61mi |
| 3509 Lake Ave Columbia, SC | 1.0–3.0 | 1.0–2.0 | 1195 | $1,245 | $1.04 | 2d | 23 | 0.63mi |
| 1741 Springfield Ave Columbia, SC | 3.0 | 1.0 | 1582 | $930 | $0.59 | 11d | 1 | 0.76mi |
| 1630 Edgemore Rd Unit 1 Columbia, SC | 3.0 | 2.0 | 1225 | $1,650 | $1.35 | 23d | 1 | 0.76mi |
| 7006 Brookfield Rd Columbia, SC | 1.0–3.0 | 1.0–2.0 | 1090 | $1,122 | $1.03 | 11d | 7 | 0.81mi |
| 308 Percival Rd Columbia, SC | 3.0 | 2.5 | 1360 | $1,395 | $1.03 | 23d | 1 | 1.07mi |
| 202 Partridge Dr Columbia, SC | 3.0 | 2.0 | 1500 | $1,850 | $1.23 | 14d | 1 | 1.09mi |
| 7501 Brookfield Rd Columbia, SC | 1.0–3.0 | 1.0–2.5 | 1097 | $1,074 | $0.98 | 23d | 1 | 1.10mi |
| 300 Meredith Sq Columbia, SC | 2.0–3.0 | 2.0–2.5 | 1258 | $1,299 | $1.03 | 23d | 1 | 1.17mi |
| 6905 Cleaton Rd Columbia, SC | 3.0 | 2.5–3.0 | 1546 | $1,925 | $1.25 | 23d | 3 | 1.27mi |
| 7502 Hunt Club Rd Columbia, SC | 1.0–3.0 | 1.0–2.0 | 875 | $1,292 | $1.48 | 23d | 1 | 1.31mi |
| 7502 Hunt Club Rd Columbia, SC | 1.0–2.0 | 1.0–2.0 | 825 | $1,305 | $1.58 | 3d | 22 | 1.31mi |
| 7400 Hunt Club Rd Columbia, SC | 1.0–3.0 | 1.0–2.0 | 1087 | $1,040 | $0.96 | 23d | 1 | 1.32mi |
| 7602 Hunt Club Rd Columbia, SC | 1.0–2.0 | 1.0–2.5 | 950 | $1,295 | $1.36 | 23d | 2 | 1.32mi |
| 7602 Hunt Club Rd Unit I-104 Columbia, SC | 2.0 | 2.5 | 1200 | $1,295 | $1.08 | 19d | 1 | 1.33mi |
HOA detail condo
- Monthly dues
- $275 · $3,300/yr
- Likely covers
- parking
- Assessments
- None detected in remarks — confirm with the listing agent.
Listing history 21 events
-
2026-06-18days on market $110,000 Active 358 DOM
-
2026-06-17days on market $110,000 Active 357 DOM
-
2026-06-16days on market $110,000 Active 356 DOM
-
2026-06-15days on market $110,000 Active 355 DOM
-
2026-06-14days on market $110,000 Active 353 DOM
-
2026-06-13days on market $110,000 Active 352 DOM
-
2026-06-10days on market $110,000 Active 350 DOM
-
2026-06-09days on market $110,000 Active 349 DOM
-
2026-06-08days on market $110,000 Active 348 DOM
-
2026-06-07days on market $110,000 Active 347 DOM
-
2026-06-05days on market $110,000 Active 344 DOM
-
2026-06-03days on market $110,000 Active 343 DOM
-
2026-06-03days on market $110,000 Active 342 DOM
-
2026-06-01days on market $110,000 Active 341 DOM
-
2026-05-31days on market $110,000 Active 340 DOM
-
2026-05-14price $110,000
-
2025-09-29price $115,000
-
2025-06-25$120,000 Active
-
2001-02-02soldstatus $45,000
-
1992-12-02soldstatus $29,900
-
1991-01-02soldstatus $1,550,000
ⓘ Source: listings_history table (triggers on properties + properties_extension) + one-shot
backfill from property_details.listing_events for pre-trigger history.
Tax reassessment forecast SC · Resets to sale price
- Current annual tax
- $625 · $52/mo
- Projected year-2 tax
- $627 · $52/mo
- Expected delta
- +$2/yr ($0/mo · 0.3%)
ⓘ Screening estimate from a state-policy table — verify with the county assessor before closing.
Climate risk First Street
- Flood 1/10 Low FEMA zone X (unshaded) · 0% chance over 30 yrs
- Wildfire 3/10 Moderate
- Heat 7/10 Severe 7 d/yr ≥108°F today · 16 d/yr by 30 yrs out
- Wind 6/10 Major 67% chance of damaging wind over 30 yrs
- Air quality 3/10 Moderate 2 unhealthy d/yr today · 2 by 30 yrs out
Nearby sold comps map
Loading sold comps map…
Walkable amenities ~0.75 mi
Loading nearby amenities…
Taxation est. · year 1
- Rental income
- $15,524
- − Mortgage interest
- −$6,162
- − Property taxes
- −$625
- − Insurance
- −$550
- − Repairs & maintenance
- −$1,242
- − Management
- −$1,242
- − HOA
- −$3,300
- − Depreciation
- −$3,200
- Taxable loss
- −$797
- Est. tax savings @ 24.0%
- +$191
- After-tax cash flow
- $1,058/yr
For passive investors: Depreciation is non-cash, so a rental often shows a tax loss while cash-flowing — sheltering income. Rental losses are passive: they offset passive income freely, and up to $25,000/yr can offset ordinary (W-2) income if you actively participate and your MAGI is under $100k (phasing out to $0 by $150k); unused losses carry forward. On sale, claimed depreciation is recaptured at up to 25%, and gains may owe capital-gains tax (a 1031 exchange can defer both). Figures are a year-1 estimate at your 24.0% rate — not tax advice; consult a CPA.
Schools (NCES district)
- District
- Richland 02
- NCES district ID
- 4503390
- Math proficiency
- 35% ▼ -15.00%
- Reading proficiency
- 47% ▼ -5.00%
- Median HH income
- $59,684
- Composite
- 36.2/100
- National rank
- #4730
- State rank
- #29 of 80 in SC
Livability — Forest Acres
- Score
- 73/100
- State rank
- #39
- US rank
- #5064
Category grades
Schools grade is shown separately in the Schools card above.
Census & demographics
No demographic data for this ZIP.
Market trends
- HPI YoY
- —
- Current HPI
- —
- Rent YoY
- —
- Metro
- —
- State GDP YoY
- ▲ 4.51%
- F500 in state
- 2
Industry mix (Fortune 500 HQ in SC)
| Industry | F500 HQs | Revenue |
|---|---|---|
| Packaging | 1 | $7B |
|
||
Price history
-92.9% since first listed6 events — show timeline
- 2026-05-14 Price Changed $110,000 Consolidated MLS
- 2025-09-29 Price Changed $115,000 Consolidated MLS
- 2025-06-25 Listed $120,000 Consolidated MLS
- 2001-02-02 Sold (Public Records) $45,000 Public Records
- 1992-12-02 Sold (Public Records) $29,900 Public Records
- 1991-01-02 Sold (Public Records) $1,550,000 Public Records
Property tax history
-1.5%/yrLatest (2025): $625 · +2.1% YoY. Source: county tax records.
Cash-flow waterfall
monthlySold comps — $/sqft
last 12 mo · ≤1 miLoading sold comps…