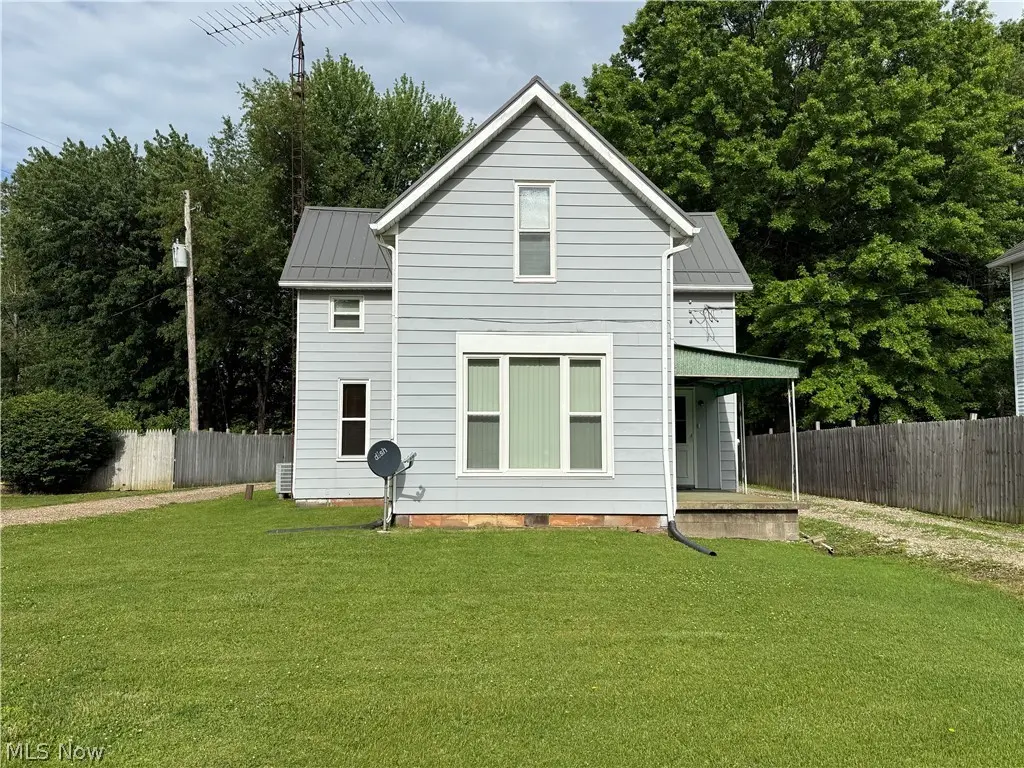
61148 Oakwood Rd · Byesville, OH
Flood risk 1/10 · Minimal
- FEMA flood zone
- X (unshaded)
- Chance of flooding over 30 yrs
- 0.0%
- Est. flood insurance / yr
- $473 – $860
Fire risk 3/10 · Minor
- Est. fire insurance / yr
- $713 – $1,323
Heat risk 3/10 · Minor
- Hot days now (above 98°F)
- 7 days/yr
- Hot days in 30 yrs
- 18 days/yr
Wind risk 1/10 · Minimal
- Chance of severe wind over 30 yrs
- 1.0%
Air-quality risk 2/10 · Minimal
- Unhealthy air days now
- 1 days/yr
- Unhealthy air days in 30 yrs
- 1 days/yr
Risk factors via First Street. Map © Google.
Why this score? — see what drove the C- grade
The composite is a weighted blend of 9 inputs, each scored 0–100. Each bar is that input's sub-score; the figure is the points it added to the 100-point composite (weight × sub-score).
- Cash flow +15.4/30.0
- ARV discount +15.0/15.0
- DSCR +4.7/10.0
- Schools +4.1/10.0
- Livability +3.4/5.0
- 1% rule +3.2/10.0
- Rent growth +2.5/5.0
- Condition / age +2.5/5.0
- Appreciation +0.0/10.0
$137,500
🖨 Deal sheet (PDF) 📄 Offer letter ✓ Due diligence
Listing remarks
Located at the edge of town is this 2br. 2 bath 2 story home with a spacious living room and dining area, a family room or use as a 3rd bedroom on the main floor. A galley kitchen and first floor laundry and full bath, then upstairs there's the 2 bedrooms with a huge full bath and spacious closet space and plenty of storage and hardwood floors under the carpet. There's a covered front porch to sit and relax on and 2 car garage and extra sheds for storage and all this is situated on 1.024 acres with city water and septic. The home has had many updates to include new metal roof in 2022, garage roof in 2023, vinyl windows in 2016, furnace/ca 2018, hot water tank new in 2019, septic pipes redon
Key facts
- Covered front porch
- New metal roof
- Galley kitchen
Tags
Property features AI
Exterior
- Parking: Detached 2-car garage; Garage with door opener; Circular driveway; Driveway with shared driveway access; Off-street parking
- Security: Smoke detector(s); Carbon monoxide detector(s)
- Utilities: Public water; Septic tank
- Home design: Two-story property; Metal roof; Aluminum siding; Brick, block and combination foundation
- Construction: Built according to public records; Aluminum siding construction; Metal roof
- Exterior features: Private yard; Front yard; Back yard; Cleared and mostly level lot with few trees; Corners marked; Storage shed(s); Front porch; Wood fencing; Has a view
Interior
- Kitchen: Range; Refrigerator
- Bathrooms: Two full bathrooms; One main-level bathroom
- Heating & cooling: Central air; Window unit(s); Forced air heating; Gas and propane heating options; Space heater
- Interior features: Double-pane windows; Laminate counters
- Laundry & utility: Washer hookup; Electric dryer hookup; Main-level laundry; Washer; Dryer
Neighborhood map
What this means for you Summary
Snapshot
- This is a 2-bed/1.0-bath single-family listed at $138k.
Deal economics
- At list price, monthly cash flow is $54 ($643/yr) — positive.
- The deal already cash-flows at list — no discount required.
- To meet the 1% rule (rent ≥ 1% of price), the offer needs to be $112k (18.2% below list).
- Recommended offer: $112k (18.2% below list) — sets the bar for 1% rule.
Location & tenants
- Location reads 67/100 on livability (#632 in OH) — a middle-class / working-renter tenant base. Strengths: crime A+, cost of living A+, housing A+; Watch: amenities F, commute F, employment F.
- Rolling Hills Local (rural): math 44% / reading 54% proficiency, ranked #463 of 656 in OH (top 71%) — families likely to look elsewhere, expect single-tenant / working-renter base with shorter leases.
- Zoned schools: Brook Intermediate School (math 54% / reading 52%, grade C, #840 of 1,584 statewide, top 53%, 317 students, 0% FRL); Meadowbrook Middle School (math 45% / reading 57%, grade C, #405 of 654 statewide, top 63%, 361 students, 0% FRL); Meadowbrook High School (math 22% / reading 52%, grade F, #564 of 781 statewide, top 74%, 420 students, 41% FRL) — zoned schools average 14% FRL vs 52% district-wide (38 pts lower); this property's tenant base skews higher-income than the district average.
- Market conditions: 34 active listings in the ZIP; 37 units permitted in Guernsey County in 2024 (0 in 5+ unit buildings).
Forward outlook
- Local home prices are declining (-3.0%/yr); year-one equity from $951 of loan paydown is wiped out by about $4k of value loss. Plan a longer hold.
- Guernsey County population projected at -20% by 2050 — secular population decline; favor cash flow + early exit over multi-decade hold.
Negotiation context
- It's been on market 17 days — a 2% lower offer ($135k) is reasonable based on typical stale-listing flexibility.
- 2 sale attempts since 10y ago with the ask held roughly flat each time — persistent listings suggest the price (not the market) is what's stuck; bring a comps-based counter.
- Current owner paid $47k; list at $138k implies a 193% gain — meaningful room to come down on a strong offer.
Questions for the listing agent
- Is there a deadline driving the sale (1031 exchange, divorce, estate, relocation)? That informs how much negotiation room exists.
- What's the average days-on-market for RENTAL listings here right now (not sales)? A rising rental-DOM trend means longer vacancies and softer asking-rent achievability than the comps imply.
- What's the recent tenant-quality profile in this submarket — average credit score on applications, eviction rate, late-payment / NSF rate, and stable-employment percentage? A property-management company in the area should have these aggregated.
- How much new for-sale + rental construction is in the pipeline within 1–3 miles? Heavy new supply typically softens prices + rents 12–24 months out; constrained supply supports both.
Investment metrics
- 1% rule
- 0.82% ✗
- Cap rate
- 6.76%
- Cash-on-cash
- 1.67%
- DSCR
- 1.07
- GRM
- 10.2
CMA / ARV
- ARV (on-the-fly)
- $190,547
- Comps found
- 1
Show comp detail 1 sale within ~0.75 mi
| Address | Dist | Beds/Ba | Sqft | Sold | Price | $/sf | Match |
|---|---|---|---|---|---|---|---|
| 10164 Sycamore St | 0.30mi | 3/2.0 (+1) | 1,200 (+3%) | 1mo | $196,000 | $163 | 72 |
Match score weights: distance 35% · size 25% · config 20% · recency 20%. Top-matched comps best support the ARV.
Projected returns pro-forma
-3.0% appreciation · 3.0% rent growth · sell at horizon
- IRR
- -13.7%
- Equity multiple
- 0.51×
- Total profit
- $-18,921
- Equity at exit
- $20,502
- IRR
- -4.9%
- Equity multiple
- 0.68×
- Total profit
- $-12,300
- Equity at exit
- $11,888
Cash invested: $38,500 (down + closing). Projections, not guarantees.
Landlord ↔ Tenant lean methodology
- Overall (STATE)
- 73 Landlord-Friendly
- State Ohio
- 73 Landlord-Friendly · R+6
- County
- — inherits STATE
- City
- — inherits STATE
ZIP-level market 43723
- Home prices YoY
- -22.5%
- Active inventory
- 34
- Price-to-rent
- 10.2×
Monthly cashflow live
- Estimated rent
- $1,125 medium interval (Pro) →
- Mortgage (P&I)
- −$721
- Tax from tax record
- −$56 /mo · $677/yr
- Insurance
- −$57
- HOA
- −$0
- Vacancy / Maint / Mgmt
- −$236
- Net cashflow
- $54
Break-even live
Sensitivity live
| Price | -10% $131 | -5% $93 | +0% $54 | +5% $15 | +10% $-24 |
|---|---|---|---|---|---|
| Rent | -10% $-35 | -5% $9 | +0% $54 | +5% $98 | +10% $142 |
| Rate | -1.0pp $123 | -0.5pp $89 | base $54 | +0.5pp $18 | +1.0pp $-18 |
UW: 25.0% down · 7.5% · 30yr · 1.5% tax · 5.0% vac · 8.0% maint · 8.0% mgmt
Financing live
Cash to close
- Down payment
- $34,375
- Closing costs
- $4,125
- Reserves months
- —
- Total cash needed
- —
Loan-product check · same deal, 3 products live
Conventional
25% down · 7.5% · 30yr
- Down + closing
- —
- Monthly P&I
- —
- Monthly cashflow
- —
- DSCR
- —
- Eligible?
- —
Personal DTI + credit; lowest rate.
DSCR
20% down · 8.5% · 30yr
- Down + closing
- —
- Monthly P&I
- —
- Monthly cashflow
- —
- DSCR
- —
- Eligible?
- —
No personal income docs; deal must DSCR.
Hard money
10% down · 12.0% · 12mo
- Down + closing
- —
- Monthly P&I
- —
- Monthly cashflow
- —
- DSCR
- —
- Eligible?
- —
Short-term bridge; refi at stabilization.
Listing history 16 events
-
2026-06-21days on market $137,500 Active 17 DOM
-
2026-06-21days on market $137,500 Active 16 DOM
-
2026-06-18days on market $137,500 Active 14 DOM
-
2026-06-17days on market $137,500 Active 13 DOM
-
2026-06-16days on market $137,500 Active 12 DOM
-
2026-06-15days on market $137,500 Active 11 DOM
-
2026-06-13days on market $137,500 Active 9 DOM
-
2026-06-12days on market $137,500 Active 8 DOM
-
2026-06-09days on market $137,500 Active 5 DOM
-
2026-06-08days on market $137,500 Active 4 DOM
-
2026-06-08days on market $137,500 Active 3 DOM
-
2026-06-07statusdays on market $137,500 Active 2 DOM
-
2026-05-21$137,500 Active
-
2016-08-19soldstatus $47,000
-
2016-08-16soldstatus $47,000
-
2016-07-26$49,900
ⓘ Source: listings_history table (triggers on properties + properties_extension) + one-shot
backfill from property_details.listing_events for pre-trigger history.
Tax reassessment forecast OH · Partial reset (capped growth)
- Current annual tax
- $677 · $56/mo
- Projected year-2 tax
- $1,411 · $118/mo
- Expected delta
- +$734/yr (+$61/mo · 108.4%)
ⓘ Screening estimate from a state-policy table — verify with the county assessor before closing.
Climate risk First Street
- Flood 1/10 Low FEMA zone X (unshaded) · 0% chance over 30 yrs
- Wildfire 3/10 Moderate
- Heat 3/10 Moderate 7 d/yr ≥98°F today · 18 d/yr by 30 yrs out
- Wind 1/10 Low 100% chance of damaging wind over 30 yrs
- Air quality 2/10 Low 1 unhealthy d/yr today · 1 by 30 yrs out
Nearby sold comps map
Loading sold comps map…
Walkable amenities ~0.75 mi
Loading nearby amenities…
Taxation est. · year 1
- Rental income
- $13,494
- − Mortgage interest
- −$7,702
- − Property taxes
- −$677
- − Insurance
- −$688
- − Repairs & maintenance
- −$1,080
- − Management
- −$1,080
- − Depreciation
- −$4,000
- Taxable loss
- −$1,731
- Est. tax savings @ 24.0%
- +$416
- After-tax cash flow
- $1,059/yr
For passive investors: Depreciation is non-cash, so a rental often shows a tax loss while cash-flowing — sheltering income. Rental losses are passive: they offset passive income freely, and up to $25,000/yr can offset ordinary (W-2) income if you actively participate and your MAGI is under $100k (phasing out to $0 by $150k); unused losses carry forward. On sale, claimed depreciation is recaptured at up to 25%, and gains may owe capital-gains tax (a 1031 exchange can defer both). Figures are a year-1 estimate at your 24.0% rate — not tax advice; consult a CPA.
Schools (NCES district)
- District
- Rolling Hills Local
- NCES district ID
- 3904730
- Math proficiency
- 44% ▼ -16.00%
- Reading proficiency
- 54% ▼ -4.00%
- Median HH income
- $39,979
- Composite
- 40.96/100
- National rank
- #3602
- State rank
- #463 of 656 in OH
Livability — Byesville
- Score
- 67/100
- State rank
- #632
- US rank
- #11122
Category grades
Schools grade is shown separately in the Schools card above.
Census & demographics
- County
- Guernsey · 34,843 people
- City population
- 4,490
- Population (ZIP)
- 4,490
- Household income
- $48,656
- Rent vs Own
- Severe rent burden
- 14.8
Population outlook (Guernsey County) Hauer SSP2
- Today (2025)
- 37,281 people
- By 2030
- 35,900 · -3.7%
- By 2040
- 32,861 · -11.9%
- By 2050
- 29,700 · -20.3%
- By 2075
- 22,199 · -40.5%
- By 2100
- 15,192 · -59.3%
Race, ethnicity, and origin ACS 2023
- Neighborhood character
- Predominantly White (96%)
- Race & ethnicity
- White 96% Two or more races 3%
- Common ancestry
- Romanian 5% Slovak 3% Iranian 2%
- Foreign-born
- 1% · China
Political lean MEDSL · Guernsey
- 2024 margin
- Solid R (+52.1) · D 23.6% · R 75.7%
- 2008→2024 swing
- -43.0pp toward R · 2008: -9.1pp · 2024: -52.1pp
- All cycles
- 2024: R+52.1 2020: R+48.4 2016: R+42.6 2012: R+9.7 2008: R+9.1
Not yet ingested
- Civics
- —
Market trends
- HPI YoY
- ▼ -61.19%
- Current HPI
- 210.9015
- Rent YoY
- —
- Metro
- —
- State GDP YoY
- ▲ 1.98%
- F500 in state
- 48
Industry mix (Fortune 500 HQ in OH)
| Industry | F500 HQs | Revenue |
|---|---|---|
| Insurance | 3 | $145B |
|
||
| Industrial Machinery | 3 | $49B |
|
||
| Financial Services | 3 | $24B |
|
||
| Consumer Goods | 2 | $93B |
|
||
| Aerospace / Defense | 2 | $47B |
|
||
| Utilities | 2 | $33B |
|
||
Price history
+175.6% since first listed4 events — show timeline
- 2026-05-21 Listed $137,500 MLSNOW
- 2016-08-19 Sold (Public Records) $47,000 Public Records
- 2016-08-16 Sold (MLS) $47,000 MLSNOW
- 2016-07-26 Listed $49,900 MLSNOW
Property tax history
+9.4%/yrLatest (2025): $677 · +1.4% YoY. Source: county tax records.
Cash-flow waterfall
monthlySold comps — $/sqft
last 12 mo · ≤1 miLoading sold comps…