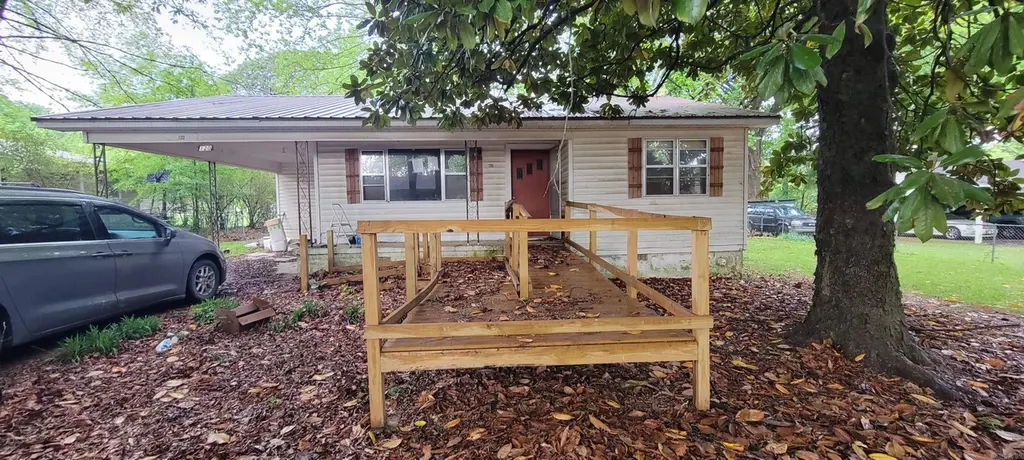
120 Brookhaven Rd · Searcy, AR
Flood risk 1/10 · Minimal
- FEMA flood zone
- X (unshaded)
- Chance of flooding over 30 yrs
- 0.0%
- Est. flood insurance / yr
- $507 – $1,088
Fire risk 3/10 · Minor
- Est. fire insurance / yr
- $1,499 – $2,785
Heat risk 6/10 · Moderate
- Hot days now (above 110°F)
- 7 days/yr
- Hot days in 30 yrs
- 19 days/yr
Wind risk 3/10 · Minor
- Chance of severe wind over 30 yrs
- 7.0%
Air-quality risk 1/10 · Minimal
- Unhealthy air days now
- 0 days/yr
- Unhealthy air days in 30 yrs
- 0 days/yr
Risk factors via First Street. Map © Google.
Why this score? — see what drove the C- grade
The composite is a weighted blend of 9 inputs, each scored 0–100. Each bar is that input's sub-score; the figure is the points it added to the 100-point composite (weight × sub-score).
- Cash flow +17.2/30.0
- ARV discount +15.0/15.0
- DSCR +5.4/10.0
- 1% rule +4.7/10.0
- Schools +3.8/10.0
- Livability +3.5/5.0
- Rent growth +2.5/5.0
- Condition / age +2.5/5.0
- Appreciation +0.0/10.0
$115,900
🖨 Deal sheet 📄 Offer letter ✓ Due diligence
Listing remarks MLS
This house has had alot of work done to it! Flooring, counter tops, cabinets and much more. It has a big yard and a nice covered back porch. The house has hardwood floors and laminate throughout except for the wet areas. The house has a wonderful large kitchen and laundry room!
Key facts
- 0.54 acre lot
- Built 1965
- Listed 39 days
Property features AI
Exterior
- Parking: Carport
- Utilities: Public water; Septic system
- Home design: Single-family property
- Construction: Metal/Vinyl siding; Metal roof; Crawl space foundation; Built on approximately 0.54 acre lot
- Exterior features: Level lot; Paved road access; Inside city limits
Interior
- Flooring: Wood flooring; Laminate flooring
- Bathrooms: 2 full bathrooms
- Heating & cooling: Central heating; Central cooling
- Interior features: Wood and laminate floors; Great Room
Neighborhood map
What this means for you Summary
Snapshot
- This is a 3-bed/2.0-bath single-family listed at $116k.
Deal economics
- At list price, monthly cash flow is $83 ($999/yr) — positive.
- The deal already cash-flows at list — no discount required.
- To meet the 1% rule (rent ≥ 1% of price), the offer needs to be $112k (3.4% below list).
- Recommended offer: $112k (3.4% below list) — sets the bar for 1% rule.
- Cap rate 7.2% vs local median 3.3% in Searcy — top-decile yield for the area; either an underpriced asset or a hidden risk that comps aren't pricing in. Stress-test before assuming the spread holds.
Location & tenants
- Location reads 70/100 on livability (#51 in AR) — a middle-class / working-renter tenant base. Strengths: cost of living A+, health & safety A+, housing A-; Watch: crime D, commute F, employment F.
- Searcy School District (town): math 47% / reading 43% proficiency, ranked #37 of 238 in AR (top 16%) — families likely to look elsewhere, expect single-tenant / working-renter base with shorter leases.
- Market conditions: 173 active listings in the ZIP; 219 units permitted in White County in 2024 (36 in 5+ unit buildings).
Forward outlook
- Local home prices are declining (-3.0%/yr); year-one equity from $801 of loan paydown is wiped out by about $3k of value loss. Plan a longer hold.
- White County population projected at +7% by 2050 — modest demand growth; plan on rents tracking national, not racing it.
Negotiation context
- It's been on market 40 days — a 3% lower offer ($112k) is reasonable based on typical stale-listing flexibility.
- 3 sale attempts since 11y ago; this cycle's ask has dropped $13k (10%) from the opening price — seller is motivated, your offer sets the floor, not the list.
- Current owner paid $69k; list at $116k implies a 68% gain — meaningful room to come down on a strong offer.
Risks & watch-outs
- Climate carrying-cost: extreme-heat days projected 7→19/yr by 2055 (HVAC capex compounding) — expect insurance premiums to compound above CPI over the hold.
Questions for the listing agent
- It's been on market 40 days. Have you received any prior offers? Is the seller open to a 3% concession, seller financing, or rate buy-down credit?
- Built in 1965 — when were the roof, HVAC, electrical panel, plumbing, and water heater last replaced?
- Is there a deadline driving the sale (1031 exchange, divorce, estate, relocation)? That informs how much negotiation room exists.
- Crime grade is D in this area — have there been break-ins, vandalism, or insurance claims at this property in the last 3 years? What carrier currently insures it and at what premium?
- What's the average days-on-market for RENTAL listings here right now (not sales)? A rising rental-DOM trend means longer vacancies and softer asking-rent achievability than the comps imply.
- What's the recent tenant-quality profile in this submarket — average credit score on applications, eviction rate, late-payment / NSF rate, and stable-employment percentage? A property-management company in the area should have these aggregated.
- How much new for-sale + rental construction is in the pipeline within 1–3 miles? Heavy new supply typically softens prices + rents 12–24 months out; constrained supply supports both.
Investment metrics
- 1% rule
- 0.97% ✗
- Cap rate
- 7.16%
- Cash-on-cash
- 3.08%
- DSCR
- 1.14
- GRM
- 8.6
CMA / ARV
- ARV (median comp)
- $213,958
- List price
- $115,900
- Delta
- -45.83%
- Verdict
- UNDERPRICED
- Comps
- 20 within 1.0 mi
Show comp detail 4 sales within ~0.75 mi
| Address | Dist | Beds/Ba | Sqft | Sold | Price | $/sf | Match |
|---|---|---|---|---|---|---|---|
| 114 Rosedale Dr | 0.10mi | 3/1.5 | 1,132 (-4%) | 9mo | $120,000 | $106 | 79 |
| 129 Carter Dr | 0.07mi | 3/1.0 | 1,008 (-14%) | 10mo | $65,000 | $64 | 61 |
| 2700 Ridgewood Rd | 0.73mi | 3/2.0 | 1,211 (+3%) | 6mo | $210,000 | $173 | 56 |
| 113 N Valley Rd | 0.69mi | 3/2.0 | 1,344 (+14%) | 22mo | $189,900 | $141 | 26 |
Match score weights: distance 35% · size 25% · config 20% · recency 20%. Top-matched comps best support the ARV.
Projected returns pro-forma
-3.0% appreciation · 3.0% rent growth · sell at horizon
- IRR
- -11.4%
- Equity multiple
- 0.59×
- Total profit
- $-13,460
- Equity at exit
- $17,281
- IRR
- -2.2%
- Equity multiple
- 0.85×
- Total profit
- $-4,823
- Equity at exit
- $10,021
Cash invested: $32,452 (down + closing). Projections, not guarantees.
Landlord ↔ Tenant lean methodology
- Overall (STATE)
- 92 Strongly Landlord-Friendly
- State Arkansas
- 92 Strongly Landlord-Friendly · R+14
- County
- — inherits STATE
- City
- — inherits STATE
ZIP-level market 72143
- Home prices YoY
- -28.4%
- Active inventory
- 173
- Price-to-rent
- 8.6×
Monthly cashflow live
- Estimated rent
- $1,119 medium interval (Pro) →
- Mortgage (P&I)
- −$608
- Tax est. 1.5%
- −$145 /mo · $1,738/yr
- Insurance
- −$48
- HOA
- −$0
- Vacancy / Maint / Mgmt
- −$235
- Net cashflow
- $83
Break-even live
UW: 25.0% down · 7.5% · 30yr · 1.5% tax · 5.0% vac · 8.0% maint · 8.0% mgmt
Financing live
Cash to close
- Down payment
- $28,975
- Closing costs
- $3,477
- Reserves months
- —
- Total cash needed
- —
Loan-product check · same deal, 3 products live
Conventional
25% down · 7.5% · 30yr
- Down + closing
- —
- Monthly P&I
- —
- Monthly cashflow
- —
- DSCR
- —
- Eligible?
- —
Personal DTI + credit; lowest rate.
DSCR
20% down · 8.5% · 30yr
- Down + closing
- —
- Monthly P&I
- —
- Monthly cashflow
- —
- DSCR
- —
- Eligible?
- —
No personal income docs; deal must DSCR.
Hard money
10% down · 12.0% · 12mo
- Down + closing
- —
- Monthly P&I
- —
- Monthly cashflow
- —
- DSCR
- —
- Eligible?
- —
Short-term bridge; refi at stabilization.
Listing history 27 events
-
2026-06-19days on market $115,900 Active 40 DOM
-
2026-06-18days on market $115,900 Active 39 DOM
-
2026-06-17days on market $115,900 Active 38 DOM
-
2026-06-16days on market $115,900 Active 37 DOM
-
2026-06-15days on market $115,900 Active 36 DOM
-
2026-06-14days on market $115,900 Active 34 DOM
-
2026-06-12days on market $115,900 Active 33 DOM
-
2026-06-09days on market $115,900 Active 30 DOM
-
2026-06-08days on market $115,900 Active 29 DOM
-
2026-06-07statusdays on market $115,900 Active 28 DOM
-
2026-06-05days on market $115,900 Price Change 25 DOM
-
2026-06-03days on market $115,900 Price Change 24 DOM
-
2026-06-02days on market $115,900 Price Change 23 DOM
-
2026-06-01days on market $115,900 Price Change 22 DOM
-
2026-05-31days on market $115,900 Price Change 21 DOM
-
2026-05-30days on market $115,900 Price Change 20 DOM
-
2026-05-10$129,000 New Listing 12-char remark
-
2017-08-25soldstatus $69,000
-
2017-08-24soldstatus $69,000 278-char remark
Show marketing remark (278 chars)
This house has had alot of work done to it! Flooring, counter tops, cabinets and much more. It has a big yard and a nice covered back porch. The house has hardwood floors and laminate throughout except for the wet areas. The house has a wonderful large kitchen and laundry room!
-
2017-08-01historical 278-char remark
Show marketing remark (278 chars)
This house has had alot of work done to it! Flooring, counter tops, cabinets and much more. It has a big yard and a nice covered back porch. The house has hardwood floors and laminate throughout except for the wet areas. The house has a wonderful large kitchen and laundry room!
-
2017-08-01$69,900 278-char remark
Show marketing remark (278 chars)
This house has had alot of work done to it! Flooring, counter tops, cabinets and much more. It has a big yard and a nice covered back porch. The house has hardwood floors and laminate throughout except for the wet areas. The house has a wonderful large kitchen and laundry room!
-
2016-08-24historical
-
2016-07-08price $69,900
-
2016-04-12price $75,500
-
2015-10-22price $79,500
-
2015-10-20$82,900 New Listing
-
2001-04-19soldstatus $55,000
ⓘ Source: listings_history table (triggers on properties + properties_extension) + one-shot
backfill from property_details.listing_events for pre-trigger history.
Climate risk First Street
- Flood 1/10 Low FEMA zone X (unshaded) · 0% chance over 30 yrs
- Wildfire 3/10 Moderate
- Heat 6/10 Major 7 d/yr ≥110°F today · 19 d/yr by 30 yrs out
- Wind 3/10 Moderate 7% chance of damaging wind over 30 yrs
- Air quality 1/10 Low 0 unhealthy d/yr today · 0 by 30 yrs out
Nearby sold comps map
Loading sold comps map…
Walkable amenities ~0.75 mi
Loading nearby amenities…
Taxation est. · year 1
- Rental income
- $13,431
- − Mortgage interest
- −$6,492
- − Property taxes
- −$1,738
- − Insurance
- −$580
- − Repairs & maintenance
- −$1,075
- − Management
- −$1,075
- − Depreciation
- −$3,372
- Taxable loss
- −$899
- Est. tax savings @ 24.0%
- +$216
- After-tax cash flow
- $1,215/yr
For passive investors: Depreciation is non-cash, so a rental often shows a tax loss while cash-flowing — sheltering income. Rental losses are passive: they offset passive income freely, and up to $25,000/yr can offset ordinary (W-2) income if you actively participate and your MAGI is under $100k (phasing out to $0 by $150k); unused losses carry forward. On sale, claimed depreciation is recaptured at up to 25%, and gains may owe capital-gains tax (a 1031 exchange can defer both). Figures are a year-1 estimate at your 24.0% rate — not tax advice; consult a CPA.
Schools (NCES district)
- District
- Searcy School District
- NCES district ID
- 0512210
- Math proficiency
- 47% ▼ -11.00%
- Reading proficiency
- 43% ▼ -10.00%
- Median HH income
- $44,318
- Composite
- 38.12/100
- National rank
- #4272
- State rank
- #37 of 238 in AR
Livability — Searcy
- Score
- 70/100
- State rank
- #51
- US rank
- #7408
Category grades
Schools grade is shown separately in the Schools card above.
Census & demographics
- Census place
- Searcy, AR
- County
- White County · 35,000 people
- City population
- 35,000
- Metro
- Searcy, AR
- Population (ZIP)
- 35,000
- Household income
- $58,344
- Rent vs Own
- Severe rent burden
- 804.0
Population outlook (White County) Hauer SSP2
- Today (2025)
- 82,310 people
- By 2030
- 83,861 · +1.9%
- By 2040
- 86,492 · +5.1%
- By 2050
- 88,246 · +7.2%
- By 2075
- 91,307 · +10.9%
- By 2100
- 91,548 · +11.2%
Race, ethnicity, and origin ACS 2023
- Neighborhood character
- Predominantly White (82%)
- Race & ethnicity
- White 82% Black 7% Hispanic / Latino 6% Two or more races 5%
- Hispanic origin (detail)
- Mexican 4%
- Common ancestry
- Italian 2% Slovak 1% Serbian 1%
- Foreign-born
- 2% · Canada
- Languages at home
- 95% English-only · Spanish 4%
Political lean MEDSL · White
- 2024 margin
- Solid R (+61.2) · D 18.3% · R 79.5% · Other 2.2%
- 2008→2024 swing
- -14.0pp toward R · 2008: -47.2pp · 2024: -61.2pp
- All cycles
- 2024: R+61.2 2020: R+58.9 2016: R+57.9 2012: R+53.7 2008: R+47.2
Not yet ingested
- Civics
- —
Market trends
- HPI YoY
- ▼ -81.60%
- Current HPI
- 206.0334
- Rent YoY
- —
- Metro
- Searcy, AR
- State GDP YoY
- ▲ 3.80%
- F500 in state
- 10
Industry mix (Fortune 500 HQ in AR)
| Industry | F500 HQs | Revenue |
|---|---|---|
| Retail | 1 | $681B |
|
||
| Food / Agriculture | 1 | $53B |
|
||
| Retail / Energy | 1 | $22B |
|
||
| Transportation / Logistics | 1 | $12B |
|
||
| Energy | 1 | $4B |
|
||
Price history
+110.7% since first listed12 events — show timeline
- 2026-05-29 Price Changed $115,900 CARMLS
- 2026-05-10 Listed $129,000 CARMLS
- 2017-08-25 Sold (Public Records) $69,000 Public Records
- 2017-08-24 Sold (MLS) $69,000 CARMLS
- 2017-08-01 Listing Removed — CARMLS
- 2017-08-01 Listed $69,900 CARMLS
- 2016-08-24 Listing Removed — CARMLS
- 2016-07-08 Price Changed $69,900 CARMLS
- 2016-04-12 Price Changed $75,500 CARMLS
- 2015-10-22 Price Changed $79,500 CARMLS
- 2015-10-20 Listed $82,900 CARMLS
- 2001-04-19 Sold (Public Records) $55,000 Public Records
Property tax history
-14.4%/yrLatest (2025): $85 · -54.0% YoY. Source: county tax records.
Cash-flow waterfall
monthlySold comps — $/sqft
last 12 mo · ≤1 miLoading sold comps…