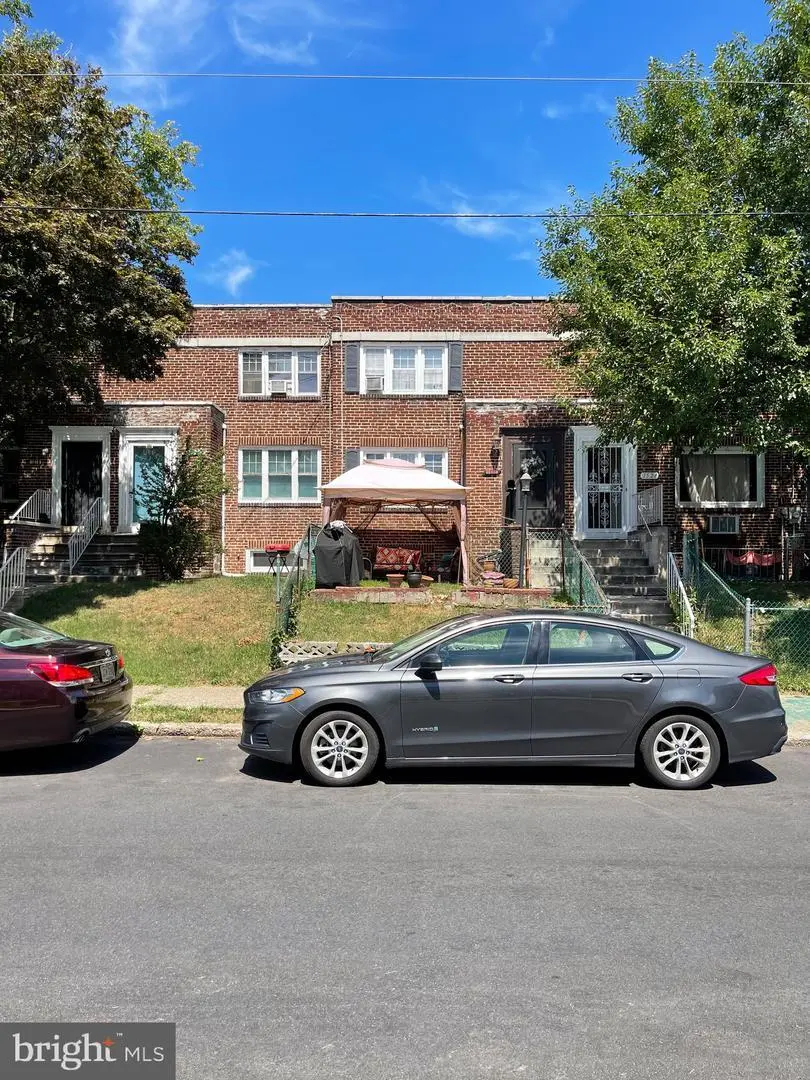
1522 Greenwood Ave · Camden, NJ
Flood risk 1/10 · Minimal
- FEMA flood zone
- X (unshaded)
- Chance of flooding over 30 yrs
- 0.0%
- Est. flood insurance / yr
- $507 – $1,088
Fire risk 1/10 · Minimal
- Est. fire insurance / yr
- $526 – $976
Heat risk 7/10 · Major
- Hot days now (above 104°F)
- 7 days/yr
- Hot days in 30 yrs
- 15 days/yr
Wind risk 6/10 · Moderate
- Chance of severe wind over 30 yrs
- 27.0%
Air-quality risk 4/10 · Minor
- Unhealthy air days now
- 5 days/yr
- Unhealthy air days in 30 yrs
- 6 days/yr
Risk factors via First Street. Map © Google.
Why this score? — see what drove the C- grade
The composite is a weighted blend of 9 inputs, each scored 0–100. Each bar is that input's sub-score; the figure is the points it added to the 100-point composite (weight × sub-score).
- Cash flow +21.1/30.0
- ARV discount +7.5/15.0
- DSCR +6.7/10.0
- 1% rule +5.4/10.0
- Appreciation +3.8/10.0
- Livability +3.5/5.0
- Rent growth +2.5/5.0
- Condition / age +2.5/5.0
- Schools +0.7/10.0
$179,999
🖨 Deal sheet (PDF) 📄 Offer letter ✓ Due diligence
Listing remarks
it is great location behind our lady lord's hospital, brick house with a deck at the back room exit from the dining room finish basement with full bath and one bedroom tenant occupied they are moving to different state before the end of the month house need cosmetic work because long time tenancy
Key facts
- Brick house
- Great location
- Finished basement
Tags
Property features AI
Finance
- Financial info: Lease considered
Exterior
- Parking: Concrete driveway; Off-street and off-site parking
- Utilities: 110 Volt and 120/240V electric service; Natural gas heating and hot water; Public water; Public sewer
- Home design: Interior townhouse/rowhouse; Fee simple ownership
- Construction: Brick construction; Brick/mortar foundation
- Exterior features: Concrete driveway; Off-street and off-site parking available
Interior
- Bedrooms: 3 bedrooms on the main level
- Bathrooms: 2 full bathrooms on the main level; 2 full bathrooms total
- Heating & cooling: Forced air heating; Natural gas hot water
- Interior features: Fully finished basement; 36+ inch wide hallways
Neighborhood map
What this means for you Summary
Snapshot
- This is a 3-bed/2.0-bath townhouse listed at $180k.
Deal economics
- At list price, monthly cash flow is $257 ($3k/yr) — positive.
- The deal already cash-flows at list — no discount required.
- Meets the 1% rule at list price ($2k rent vs $180k).
Location & tenants
- Location reads 70/100 on livability (#262 in NJ) — a middle-class / working-renter tenant base. Strengths: amenities A+, commute A+, cost of living A; Watch: crime F, employment F.
- Camden City School District (urban): math 3% / reading 16% proficiency, ranked #472 of 472 in NJ (top 100%) — low school quality limits family demand, transient renter base, plan for 1-2y turnover; 86% free/reduced lunch — lower-income household profile, screen leases tightly.
- Zoned schools: Morgan Village Middle School (244 students, 77% FRL).
- Market conditions: 64 active listings in the ZIP; 27 comparable units currently listed for rent nearby; rentals at typical pace (median 20d on market — plan ~3-4 weeks tenant-placement turnaround); lower-income renter base — watch delinquency; 1,018 units permitted in Camden County in 2024 (509 in 5+ unit buildings).
- At $1,871/mo this rent would consume 61% of the median local household income ($37k/yr) (locally 1141% of renters already pay >50% of income on rent) — very limited rent-growth headroom before tenants either downsize or default.
Forward outlook
- Local home prices are declining (-2.4%/yr); year-one equity from $1k of loan paydown is wiped out by about $4k of value loss. Plan a longer hold.
- Camden County population projected to shrink 8% by 2050 — rents likely to lag national; underwrite the cash flow, not the appreciation.
Negotiation context
- Only 13 days on market — expect competitive offers; lowballing is unlikely to land.
- 8 sale attempts since 23y ago with the ask held roughly flat each time — persistent listings suggest the price (not the market) is what's stuck; bring a comps-based counter.
- Current owner paid $36k; list at $180k implies a 407% gain — meaningful room to come down on a strong offer.
Risks & watch-outs
- Watch-outs: built in 1930 — expect roof / HVAC / electrical / plumbing capex.
- Climate carrying-cost: major wind risk, 27% chance of damaging wind over 30y; extreme-heat days projected 7→15/yr by 2055 (HVAC capex compounding) — expect insurance premiums to compound above CPI over the hold.
Questions for the listing agent
- Built in 1930 — when were the roof, HVAC, electrical panel, plumbing, and water heater last replaced?
- Is there a deadline driving the sale (1031 exchange, divorce, estate, relocation)? That informs how much negotiation room exists.
- Schools are F-rated, which usually means shorter tenancies and higher turnover. Who's the typical renter profile here, and what's been the actual vacancy rate?
- Crime grade is F in this area — have there been break-ins, vandalism, or insurance claims at this property in the last 3 years? What carrier currently insures it and at what premium?
- What's the average days-on-market for RENTAL listings here right now (not sales)? A rising rental-DOM trend means longer vacancies and softer asking-rent achievability than the comps imply.
- What's the recent tenant-quality profile in this submarket — average credit score on applications, eviction rate, late-payment / NSF rate, and stable-employment percentage? A property-management company in the area should have these aggregated.
- How much new for-sale + rental construction is in the pipeline within 1–3 miles? Heavy new supply typically softens prices + rents 12–24 months out; constrained supply supports both.
Investment metrics
- 1% rule
- 1.04% ✓
- Cap rate
- 8.00%
- Cash-on-cash
- 6.11%
- DSCR
- 1.27
- GRM
- 8.0
CMA / ARV
- ARV (on-the-fly)
- $118,400
- Comps found
- 12
Show comp detail 12 sales within ~0.75 mi
| Address | Dist | Beds/Ba | Sqft | Sold | Price | $/sf | Match |
|---|---|---|---|---|---|---|---|
| 541 Randolph St | 0.65mi | 3/2.0 | 1,162 (-2%) | 1mo | $210,000 | $181 | 66 |
| 45 Bellevue Ter | 0.68mi | 3/2.0 | 1,119 (-6%) | 1mo | $245,000 | $219 | 59 |
| 1246 Everett St | 0.49mi | 3/1.0 | 1,081 (-9%) | 1mo | $108,333 | $100 | 58 |
| 1248 Everett St | 0.49mi | 3/1.0 | 1,081 (-9%) | 1mo | $108,333 | $100 | 58 |
| 14 Bellevue Ter | 0.67mi | 3/1.0 | 1,135 (-4%) | 0mo | $180,000 | $159 | 57 |
| 1235 Thurman St | 0.51mi | 3/1.0 | 1,084 (-8%) | 1mo | $108,333 | $100 | 57 |
| 1250 Sayrs | 0.74mi | 3/1.0 | 1,142 (-4%) | 0mo | $100,000 | $88 | 55 |
| 1154 Thurman St | 0.65mi | 3/1.0 | 1,255 (+6%) | 1mo | $108,333 | $86 | 55 |
| 1010 Kenwood Ave | 0.73mi | 3/1.0 | 1,088 (-8%) | 1mo | $75,000 | $69 | 48 |
| 632 Raritan St | 0.72mi | 3/1.0 | 1,080 (-9%) | 1mo | $135,000 | $125 | 47 |
| 1085 Morton St | 0.75mi | 3/1.0 | 1,280 (+8%) | 1mo | $83,000 | $65 | 47 |
| 40 Bellevue Ter | 0.69mi | 3/1.0 | 1,063 (-10%) | 1mo | $135,000 | $127 | 46 |
Match score weights: distance 35% · size 25% · config 20% · recency 20%. Top-matched comps best support the ARV.
Projected returns pro-forma
-2.36% appreciation · 3.0% rent growth · sell at horizon
- IRR
- -4.0%
- Equity multiple
- 0.84×
- Total profit
- $-7,929
- Equity at exit
- $32,032
- IRR
- 4.6%
- Equity multiple
- 1.37×
- Total profit
- $18,471
- Equity at exit
- $24,632
Cash invested: $50,400 (down + closing). Projections, not guarantees.
Landlord ↔ Tenant lean methodology
- Overall (STATE)
- 21 Tenant-Leaning
- State New Jersey
- 21 Tenant-Leaning · D+6
- County
- — inherits STATE
- City
- — inherits STATE
ZIP-level market 08103
- Home prices YoY
- -1.4%
- Active inventory
- 64
- Price-to-rent
- 8.0×
Monthly cashflow live
- Estimated rent
- $1,871 high interval (Pro) →
- Mortgage (P&I)
- −$944
- Tax from tax record
- −$203 /mo · $2,433/yr
- Insurance
- −$75
- HOA
- −$0
- Vacancy / Maint / Mgmt
- −$393
- Net cashflow
- $257
Break-even live
Sensitivity live
| Price | -10% $358 | -5% $308 | +0% $257 | +5% $206 | +10% $155 |
|---|---|---|---|---|---|
| Rent | -10% $109 | -5% $183 | +0% $257 | +5% $330 | +10% $404 |
| Rate | -1.0pp $347 | -0.5pp $302 | base $257 | +0.5pp $210 | +1.0pp $162 |
UW: 25.0% down · 7.5% · 30yr · 1.5% tax · 5.0% vac · 8.0% maint · 8.0% mgmt
Financing live
Cash to close
- Down payment
- $45,000
- Closing costs
- $5,400
- Reserves months
- —
- Total cash needed
- —
Loan-product check · same deal, 3 products live
Conventional
25% down · 7.5% · 30yr
- Down + closing
- —
- Monthly P&I
- —
- Monthly cashflow
- —
- DSCR
- —
- Eligible?
- —
Personal DTI + credit; lowest rate.
DSCR
20% down · 8.5% · 30yr
- Down + closing
- —
- Monthly P&I
- —
- Monthly cashflow
- —
- DSCR
- —
- Eligible?
- —
No personal income docs; deal must DSCR.
Hard money
10% down · 12.0% · 12mo
- Down + closing
- —
- Monthly P&I
- —
- Monthly cashflow
- —
- DSCR
- —
- Eligible?
- —
Short-term bridge; refi at stabilization.
Rent comps 27 comps
| Address | Beds | Baths | Sqft | Rent | $/sqft | DOM | Units | Dist |
|---|---|---|---|---|---|---|---|---|
| 1364 Kaighn Ave Camden, NJ | 2.0 | 1.0 | 912 | $1,485 | $1.63 | 4d | 1 | 0.38mi |
| 1455 Wildwood Ave Camden, NJ | 3.0 | 1.5 | 1353 | $1,900 | $1.40 | 12d | 1 | 0.52mi |
| 1509 Park Blvd Camden, NJ | 1.0–2.0 | 1.0 | 1075 | $1,650 | $1.53 | 26d | 1 | 0.63mi |
| 1055 Kenwood Ave Camden, NJ | 4.0 | 1.0 | 1088 | $1,875 | $1.72 | 26d | 1 | 0.69mi |
| 141 Cooper Ave Oaklyn, NJ | 2.0 | 1.0 | 850 | $1,725 | $2.03 | 26d | 1 | 0.81mi |
| 145 Cooper Ave Unit 1N Woodlynne, NJ | 2.0 | 1.0 | 850 | $1,725 | $2.03 | 20d | 1 | 0.82mi |
| 225 Haddon Ave Collingswood, NJ | 2.0 | 2.0 | 1219 | $3,372 | $2.76 | 0d | 7 | 0.86mi |
| 132 E Franklin Ave Unit A Collingswood, NJ | 2.0 | 1.0 | 1000 | $2,400 | $2.40 | 26d | 1 | 0.86mi |
| 1502 S 9th St Camden, NJ | 2.0 | 1.0 | 1050 | $1,475 | $1.40 | 21d | 1 | 0.92mi |
| 209 Cedar Ave Oaklyn, NJ | 2.0 | 1.0 | 1400 | $1,800 | $1.29 | 7d | 1 | 0.92mi |
| 209 Cedar Ave Oaklyn, NJ | 2.0 | 1.0 | 1400 | $1,500 | $1.07 | 18d | 1 | 0.92mi |
| 324 S 27th St Camden, NJ | 3.0 | 1.0 | 1152 | $1,900 | $1.65 | 26d | 1 | 1.02mi |
| 2752 Mickle St Camden, NJ | 3.0 | 1.0 | 1450 | $1,850 | $1.28 | 18d | 1 | 1.15mi |
| 2754 Mickle St Camden, NJ | 3.0 | 1.0 | 1500 | $1,850 | $1.23 | 0d | 1 | 1.15mi |
| 4137 Marlton Pike Pennsauken Township, NJ | 2.0 | 1.0 | 900 | $1,800 | $2.00 | 26d | 1 | 1.17mi |
| 380 Garden Ave Camden, NJ | 2.0 | 2.0 | 1184 | $2,100 | $1.77 | 26d | 1 | 1.17mi |
| 537 Newton Ave Camden, NJ | 2.0 | 1.0 | 1092 | $1,500 | $1.37 | 14d | 1 | 1.24mi |
| 537 Newton Ave Camden, NJ | 2.0 | 1.0 | 1092 | $1,500 | $1.37 | 20d | 1 | 1.24mi |
| 708 Royden St Camden, NJ | 3.0 | 1.0 | 1113 | $1,595 | $1.43 | 19d | 1 | 1.26mi |
| 301 Champion Ave Oaklyn, NJ | 2.0 | 1.0 | 661 | $1,770 | $2.68 | 6d | 3 | 1.26mi |
| 727 Berkley St Camden, NJ | 2.0 | 1.5 | 1008 | $1,660 | $1.65 | 26d | 1 | 1.27mi |
| 430 Richey Ave Unit 1A Oaklyn, NJ | 2.0 | 1.0 | 897 | $2,100 | $2.34 | 6d | 1 | 1.31mi |
| 17 W Madison Ave Unit B Collingswood, NJ | 2.0 | 1.0 | 1400 | $1,775 | $1.27 | 26d | 1 | 1.36mi |
| 457 Mechanic St Camden, NJ | 3.0 | 2.0 | 1200 | $1,950 | $1.62 | 20d | 1 | 1.39mi |
| 574 Haddon Ave Collingswood, NJ | 2.0 | 1.0 | 1100 | $1,800 | $1.64 | 19d | 1 | 1.45mi |
| 700 W Browning Rd Oaklyn, NJ | 2.0 | 1.0 | 670 | $1,867 | $2.79 | 0d | 45 | 1.48mi |
| 1034 Collings Ave Oaklyn, NJ | 2.0 | 1.0 | 1100 | $1,750 | $1.59 | 20d | 1 | 1.48mi |
Listing history 9 events
-
2026-06-21days on market $179,999 Active 13 DOM
-
2026-06-18days on market $179,999 Active 10 DOM
-
2026-06-17days on market $179,999 Active 9 DOM
-
2026-06-16days on market $179,999 Active 8 DOM
-
2026-06-15days on market $179,999 Active 7 DOM
-
2026-06-13days on market $179,999 Active 5 DOM
-
2026-06-13days on market $179,999 Active 4 DOM
-
2026-06-09remarks 297-char remark
-
2026-06-09$179,999 Active 1 DOM
ⓘ Source: listings_history table (triggers on properties + properties_extension) + one-shot
backfill from property_details.listing_events for pre-trigger history.
Tax reassessment forecast NJ · Partial reset (capped growth)
- Current annual tax
- $2,433 · $203/mo
- Projected year-2 tax
- $3,458 · $288/mo
- Expected delta
- +$1,024/yr (+$85/mo · 42.1%)
ⓘ Screening estimate from a state-policy table — verify with the county assessor before closing.
Climate risk First Street
- Flood 1/10 Low FEMA zone X (unshaded) · 0% chance over 30 yrs
- Wildfire 1/10 Low
- Heat 7/10 Severe 7 d/yr ≥104°F today · 15 d/yr by 30 yrs out
- Wind 6/10 Major 27% chance of damaging wind over 30 yrs
- Air quality 4/10 Moderate 5 unhealthy d/yr today · 6 by 30 yrs out
Nearby sold comps map
Loading sold comps map…
Walkable amenities ~0.75 mi
Loading nearby amenities…
Taxation est. · year 1
- Rental income
- $22,455
- − Mortgage interest
- −$10,083
- − Property taxes
- −$2,433
- − Insurance
- −$900
- − Repairs & maintenance
- −$1,796
- − Management
- −$1,796
- − Depreciation
- −$5,236
- Taxable income
- $210
- Est. tax owed @ 24.0%
- −$50
- After-tax cash flow
- $3,029/yr
For passive investors: Depreciation is non-cash, so a rental often shows a tax loss while cash-flowing — sheltering income. Rental losses are passive: they offset passive income freely, and up to $25,000/yr can offset ordinary (W-2) income if you actively participate and your MAGI is under $100k (phasing out to $0 by $150k); unused losses carry forward. On sale, claimed depreciation is recaptured at up to 25%, and gains may owe capital-gains tax (a 1031 exchange can defer both). Figures are a year-1 estimate at your 24.0% rate — not tax advice; consult a CPA.
Schools (NCES district)
- District
- Camden City School District
- NCES district ID
- 3402640
- Math proficiency
- 3% ▼ -6.00%
- Reading proficiency
- 16% ▬ 0.00%
- Median HH income
- $25,845
- Composite
- 6.85/100
- National rank
- #9981
- State rank
- #472 of 472 in NJ
Livability — Camden
- Score
- 70/100
- State rank
- #262
- US rank
- #7721
Category grades
Schools grade is shown separately in the Schools card above.
Census & demographics
- Census place
- Camden, NJ
- County
- Camden County · 407,624 people
- City population
- 20,865
- Metro
- Philadelphia-Camden-Wilmington, PA-NJ-DE-MD
- Population (ZIP)
- 12,573
- Household income
- $36,793
- Rent vs Own
- Severe rent burden
- 1141.0
Population outlook (Camden County) Hauer SSP2
- Today (2025)
- 507,964 people
- By 2030
- 502,182 · -1.1%
- By 2040
- 485,602 · -4.4%
- By 2050
- 465,630 · -8.3%
- By 2075
- 419,986 · -17.3%
- By 2100
- 369,492 · -27.3%
Race, ethnicity, and origin ACS 2023
- Neighborhood character
- Diverse neighborhood (Simpson 0.57)
- Race & ethnicity
- Black 54% Hispanic / Latino 36% Two or more races 9% White 5% Asian 1%
- Hispanic origin (detail)
- Mexican 4% Puerto Rican 19% Dominican 4%
- Common ancestry
- Hispanic 1%
- Foreign-born
- 12% · Canada, Jamaica
- Languages at home
- 75% English-only · Spanish 22% Tagalog/Filipino 2%
Political lean MEDSL · Camden
- 2024 margin
- Strong D (+27.4) · D 63.0% · R 35.5% · Other 1.5%
- 2008→2024 swing
- -8.8pp toward R · 2008: 36.2pp · 2024: 27.4pp
- All cycles
- 2024: D+27.4 2020: D+33.5 2016: D+32.4 2012: D+36.6 2008: D+36.2
Not yet ingested
- Civics
- —
Market trends
- HPI YoY
- ▼ -2.36%
- Current HPI
- 162.557
- Rent YoY
- —
- Metro
- Philadelphia-Camden-Wilmington, PA-NJ-DE-MD
- State GDP YoY
- ▲ 2.05%
- F500 in state
- 34
Industry mix (Fortune 500 HQ in NJ)
| Industry | F500 HQs | Revenue |
|---|---|---|
| Consumer Goods | 3 | $31B |
|
||
| Pharmaceuticals | 2 | $153B |
|
||
| Technology | 2 | $21B |
|
||
| Insurance | 2 | $20B |
|
||
| Healthcare | 2 | $19B |
|
||
| Financial Services | 1 | $70B |
|
||
Price history
+407.0% since first listed16 events — show timeline
- 2026-06-08 Listed $179,999 BRIGHT MLS
- 2022-12-24 Listing Removed — BRIGHT MLS
- 2022-12-16 Relisted — BRIGHT MLS
- 2022-10-23 Listing Removed — BRIGHT MLS
- 2022-07-30 Relisted — BRIGHT MLS
- 2022-07-29 Price Changed $139,500 BRIGHT MLS
- 2022-07-28 Listing Removed — BRIGHT MLS
- 2022-07-12 Relisted — BRIGHT MLS
- 2022-07-07 Listing Removed — BRIGHT MLS
- 2022-07-05 Listed $142,900 BRIGHT MLS
- 2008-05-11 Listing Removed — BRIGHT MLS
- 2008-04-04 Listed $121,900 BRIGHT MLS
- 2006-02-14 Listing Removed — BRIGHT MLS
- 2005-05-24 Listed $124,900 BRIGHT MLS
- 2003-11-24 Sold (MLS) $35,502 BRIGHT MLS
- 2003-08-28 Listed $35,502 BRIGHT MLS
Property tax history
+1.3%/yrLatest (2025): $2,433 · +4.1% YoY. Source: county tax records.
Cash-flow waterfall
monthlySold comps — $/sqft
last 12 mo · ≤1 miLoading sold comps…