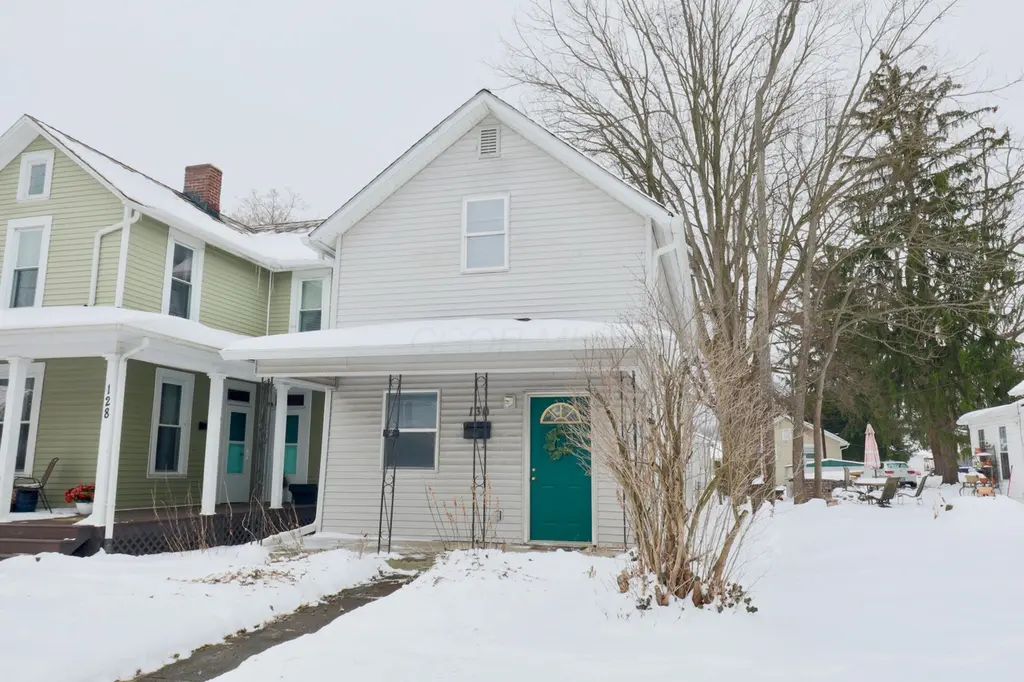
130 W Fair Ave · Lancaster, OH
Flood risk 1/10 · Minimal
- FEMA flood zone
- X (unshaded)
- Chance of flooding over 30 yrs
- 0.0%
- Est. flood insurance / yr
- $507 – $1,088
Fire risk 1/10 · Minimal
- Est. fire insurance / yr
- $713 – $1,323
Heat risk 4/10 · Minor
- Hot days now (above 99°F)
- 7 days/yr
- Hot days in 30 yrs
- 19 days/yr
Wind risk 2/10 · Minimal
- Chance of severe wind over 30 yrs
- 1.0%
Air-quality risk 2/10 · Minimal
- Unhealthy air days now
- 1 days/yr
- Unhealthy air days in 30 yrs
- 2 days/yr
Risk factors via First Street. Map © Google.
Why this score? — see what drove the D grade
The composite is a weighted blend of 9 inputs, each scored 0–100. Each bar is that input's sub-score; the figure is the points it added to the 100-point composite (weight × sub-score).
- Cash flow +12.1/30.0
- ARV discount +10.1/15.0
- Livability +4.3/5.0
- Rent growth +3.8/5.0
- Schools +3.7/10.0
- DSCR +3.6/10.0
- 1% rule +2.8/10.0
- Condition / age +2.5/5.0
- Appreciation +0.0/10.0
$209,000
🖨 Deal sheet (PDF) 📄 Offer letter ✓ Due diligence
Listing remarks MLS
Discover the best seat in Lancaster for the 4th of July fireworks! This spacious 1,472 sq. ft. home is situated right across from the fairgrounds, offering incredible views of Mt. Pleasant and easy access to local events. Move-in ready, this 3-bedroom, 2-full bath residence features a host of valuable updates, including replacement vinyl windows for energy efficiency. The interior shines with fresh paint, newly laid carpet, and durable new luxury vinyl plank flooring in the kitchen. Enjoy the convenience of first-floor laundry, central air, and a newer hot water heater. The exterior is equally inviting with a fenced-in backyard, fire pit, and a detached one-car garage with plenty of additional alley parking. Located just a short drive from local downtown restaurants, shopping, and a straight shot to the bypass, this home combines size, style, and a prime location.
Key facts
- 3,484 sq ft lot
- Garage
- Built 1900
Neighborhood map
What this means for you Summary
Snapshot
- This is a 2-bed/2.0-bath single-family listed at $209k.
Deal economics
- At list price, monthly cash flow is $-44 ($-528/yr) — negative.
- To cash-flow at today's rent, offer at most $201k (3.7% below list).
- To meet the 1% rule (rent ≥ 1% of price), the offer needs to be $163k (22.0% below list).
- Recommended offer: $163k (22.0% below list) — sets the bar for 1% rule.
- Cap rate 6.0% vs local median 4.2% in Lancaster — top-decile yield for the area; either an underpriced asset or a hidden risk that comps aren't pricing in. Stress-test before assuming the spread holds.
Location & tenants
- Location reads 86/100 on livability (#41 in OH, #423 nationally) — a professional / high-income tenant draw. Strengths: amenities A+, cost of living A+, housing A+; Watch: crime D, employment D.
- Lancaster City (town): math 38% / reading 51% proficiency, ranked #504 of 656 in OH (top 77%) — families likely to look elsewhere, expect single-tenant / working-renter base with shorter leases.
- Market conditions: Rents rising fast (+5.2%/yr); 202 active listings in the ZIP; 8 comparable units currently listed for rent nearby; rentals lingering (median 45d on market — plan ~5-8 weeks vacancy on turnover, expect pricing pressure); 50% of comp listings sitting > 30 days — soft ceiling on asking rent; 475 units permitted in Fairfield County in 2024 (0 in 5+ unit buildings).
Forward outlook
- Local home prices are declining (-3.0%/yr); year-one equity from $1k of loan paydown is wiped out by about $6k of value loss. Plan a longer hold.
- Fairfield County population projected at +8% by 2050 — modest demand growth; plan on rents tracking national, not racing it.
Negotiation context
- It's been on market 133 days — a 12% lower offer ($184k) is reasonable based on typical stale-listing flexibility.
Risks & watch-outs
- Watch-outs: built in 1900 — expect roof / HVAC / electrical / plumbing capex.
Questions for the listing agent
- What do current leases actually rent for vs. the listed asking? Can we see a recent rent roll and the last 12 months of T-12 income?
- It's been on market 133 days. Have you received any prior offers? Is the seller open to a 22% concession, seller financing, or rate buy-down credit?
- Built in 1900 — when were the roof, HVAC, electrical panel, plumbing, and water heater last replaced?
- Why hasn't it sold? Are there any deal-killer items the seller is aware of (foundation, flood, title, zoning, code violations)?
- Is there a deadline driving the sale (1031 exchange, divorce, estate, relocation)? That informs how much negotiation room exists.
- Crime grade is D in this area — have there been break-ins, vandalism, or insurance claims at this property in the last 3 years? What carrier currently insures it and at what premium?
- The area grade is low — what's the realistic commute time and amenity access for the typical tenant pool here? Any planned neighborhood developments (good or bad) we should know about?
- What's the average days-on-market for RENTAL listings here right now (not sales)? A rising rental-DOM trend means longer vacancies and softer asking-rent achievability than the comps imply.
- What's the recent tenant-quality profile in this submarket — average credit score on applications, eviction rate, late-payment / NSF rate, and stable-employment percentage? A property-management company in the area should have these aggregated.
- How much new for-sale + rental construction is in the pipeline within 1–3 miles? Heavy new supply typically softens prices + rents 12–24 months out; constrained supply supports both.
Investment metrics
- 1% rule
- 0.78% ✗
- Cap rate
- 6.04%
- Cash-on-cash
- -0.90%
- DSCR
- 0.96
- GRM
- 10.7
CMA / ARV
- ARV (median comp)
- $221,597
- List price
- $209,000
- Delta
- -5.68%
- Verdict
- FAIR
- Comps
- 20 within 1.0 mi
Show comp detail 12 sales within ~0.75 mi
| Address | Dist | Beds/Ba | Sqft | Sold | Price | $/sf | Match |
|---|---|---|---|---|---|---|---|
| 526 N Columbus St | 0.29mi | 2/2.0 | 1,444 (-2%) | 2mo | $206,000 | $143 | 82 |
| 925 N Columbus St | 0.11mi | 3/1.5 (+1) | 1,555 (+6%) | 2mo | $196,400 | $126 | 77 |
| 148 Marks Ave | 0.42mi | 2/2.0 | 1,512 (+3%) | 2mo | $210,000 | $139 | 74 |
| 220 E Fair Ave | 0.35mi | 3/1.5 (+1) | 1,508 (+2%) | 6mo | $170,000 | $113 | 68 |
| 349 E Allen St | 0.45mi | 3/1.5 (+1) | 1,433 (-3%) | 1mo | $355,000 | $248 | 67 |
| 1190 N Columbus St | 0.36mi | 2/1.5 | 1,560 (+6%) | 6mo | $186,000 | $119 | 66 |
| 806 N High St | 0.30mi | 3/1.0 (+1) | 1,400 (-5%) | 6mo | $120,000 | $86 | 63 |
| 230 Lake St | 0.35mi | 3/2.0 (+1) | 1,622 (+10%) | 5mo | $290,000 | $179 | 58 |
| 1318 Graf St | 0.47mi | 2/2.0 | 1,266 (-14%) | 5mo | $185,000 | $146 | 51 |
| 224 King St | 0.52mi | 3/1.5 (+1) | 1,648 (+12%) | 2mo | $275,000 | $167 | 47 |
| 181 Marks Ave | 0.47mi | 3/1.0 (+1) | 1,284 (-13%) | 3mo | $254,000 | $198 | 46 |
| 1377 Graf St | 0.59mi | 3/1.0 (+1) | 1,288 (-12%) | 2mo | $142,500 | $111 | 42 |
Match score weights: distance 35% · size 25% · config 20% · recency 20%. Top-matched comps best support the ARV.
Projected returns pro-forma
-3.0% appreciation · 5.22% rent growth · sell at horizon
- IRR
- -15.5%
- Equity multiple
- 0.44×
- Total profit
- $-32,992
- Equity at exit
- $31,163
- IRR
- -3.9%
- Equity multiple
- 0.72×
- Total profit
- $-16,541
- Equity at exit
- $18,071
Cash invested: $58,520 (down + closing). Projections, not guarantees.
Landlord ↔ Tenant lean methodology
- Overall (STATE)
- 73 Landlord-Friendly
- State Ohio
- 73 Landlord-Friendly · R+6
- County
- — inherits STATE
- City
- — inherits STATE
ZIP-level market 43130
- Rents YoY
- 5.2%
- Active inventory
- 202
- Price-to-rent
- 10.7×
Monthly cashflow live
- Estimated rent
- $1,630 high interval (Pro) →
- Mortgage (P&I)
- −$1,096
- Tax from tax record
- −$148 /mo · $1,779/yr
- Insurance
- −$87
- HOA
- −$0
- Vacancy / Maint / Mgmt
- −$342
- Net cashflow
- $-44
Break-even live
Sensitivity live
| Price | -10% $74 | -5% $15 | +0% $-44 | +5% $-103 | +10% $-162 |
|---|---|---|---|---|---|
| Rent | -10% $-173 | -5% $-108 | +0% $-44 | +5% $20 | +10% $85 |
| Rate | -1.0pp $61 | -0.5pp $9 | base $-44 | +0.5pp $-98 | +1.0pp $-153 |
UW: 25.0% down · 7.5% · 30yr · 1.5% tax · 5.0% vac · 8.0% maint · 8.0% mgmt
Financing live
Cash to close
- Down payment
- $52,250
- Closing costs
- $6,270
- Reserves months
- —
- Total cash needed
- —
Loan-product check · same deal, 3 products live
Conventional
25% down · 7.5% · 30yr
- Down + closing
- —
- Monthly P&I
- —
- Monthly cashflow
- —
- DSCR
- —
- Eligible?
- —
Personal DTI + credit; lowest rate.
DSCR
20% down · 8.5% · 30yr
- Down + closing
- —
- Monthly P&I
- —
- Monthly cashflow
- —
- DSCR
- —
- Eligible?
- —
No personal income docs; deal must DSCR.
Hard money
10% down · 12.0% · 12mo
- Down + closing
- —
- Monthly P&I
- —
- Monthly cashflow
- —
- DSCR
- —
- Eligible?
- —
Short-term bridge; refi at stabilization.
Rent comps 8 comps
| Address | Beds | Baths | Sqft | Rent | $/sqft | DOM | Units | Dist |
|---|---|---|---|---|---|---|---|---|
| 532 N Columbus St Unit A Lancaster, OH | 2.0 | 1.0 | 1300 | $1,550 | $1.19 | 44d | 1 | 0.29mi |
| 635 N High St Lancaster, OH | 3.0 | 2.0 | 1608 | $2,200 | $1.37 | 44d | 1 | 0.34mi |
| 219 N Columbus St Unit 205 Lancaster, OH | 2.0 | 2.0 | 1103 | $1,875 | $1.70 | 44d | 1 | 0.56mi |
| 219 N Columbus St Unit 231 Lancaster, OH | 2.0 | 2.0 | 975 | $1,735 | $1.78 | 44d | 1 | 0.56mi |
| 219 N Columbus St Lancaster, OH | 1.0–2.0 | 1.0–2.0 | 1184 | $1,895 | $1.60 | 2d | 31 | 0.56mi |
| 1508 Greyfield ST Lancaster, OH | 1.0–3.0 | 1.0–2.0 | 953 | $1,564 | $1.64 | 2d | 1 | 0.72mi |
| 1733 Bellmeadow Dr Lancaster, OH | 1.0–3.0 | 1.0–2.5 | 993 | $1,607 | $1.62 | 2d | 10 | 0.89mi |
| 747 E Main St Lancaster, OH | 2.0 | 1.0 | 1150 | $1,195 | $1.04 | 2d | 1 | 1.13mi |
Listing history 16 events
-
2026-06-21days on market $209,000 Active 133 DOM
-
2026-06-18days on market $209,000 Active 130 DOM
-
2026-06-17days on market $209,000 Active 129 DOM
-
2026-06-16days on market $209,000 Active 128 DOM
-
2026-06-15days on market $209,000 Active 127 DOM
-
2026-06-13pricedays on market $209,000 Active 125 DOM
-
2026-06-09days on market $239,900 Active 121 DOM
-
2026-06-08days on market $239,900 Active 120 DOM
-
2026-06-07days on market $239,900 Active 119 DOM
-
2026-06-03days on market $239,900 Active 115 DOM
-
2026-06-02days on market $239,900 Active 114 DOM
-
2026-06-01days on market $239,900 Active 113 DOM
-
2026-05-31days on market $239,900 Active 112 DOM
-
2026-02-26price $239,900 876-char remark
Show marketing remark (876 chars)
Discover the best seat in Lancaster for the 4th of July fireworks! This spacious 1,472 sq. ft. home is situated right across from the fairgrounds, offering incredible views of Mt. Pleasant and easy access to local events. Move-in ready, this 3-bedroom, 2-full bath residence features a host of valuable updates, including replacement vinyl windows for energy efficiency. The interior shines with fresh paint, newly laid carpet, and durable new luxury vinyl plank flooring in the kitchen. Enjoy the convenience of first-floor laundry, central air, and a newer hot water heater. The exterior is equally inviting with a fenced-in backyard, fire pit, and a detached one-car garage with plenty of additional alley parking. Located just a short drive from local downtown restaurants, shopping, and a straight shot to the bypass, this home combines size, style, and a prime location.
-
2026-02-08$244,900 Active 876-char remark
Show marketing remark (876 chars)
Discover the best seat in Lancaster for the 4th of July fireworks! This spacious 1,472 sq. ft. home is situated right across from the fairgrounds, offering incredible views of Mt. Pleasant and easy access to local events. Move-in ready, this 3-bedroom, 2-full bath residence features a host of valuable updates, including replacement vinyl windows for energy efficiency. The interior shines with fresh paint, newly laid carpet, and durable new luxury vinyl plank flooring in the kitchen. Enjoy the convenience of first-floor laundry, central air, and a newer hot water heater. The exterior is equally inviting with a fenced-in backyard, fire pit, and a detached one-car garage with plenty of additional alley parking. Located just a short drive from local downtown restaurants, shopping, and a straight shot to the bypass, this home combines size, style, and a prime location.
-
2026-02-04historical $244,900 876-char remark
Show marketing remark (876 chars)
Discover the best seat in Lancaster for the 4th of July fireworks! This spacious 1,472 sq. ft. home is situated right across from the fairgrounds, offering incredible views of Mt. Pleasant and easy access to local events. Move-in ready, this 3-bedroom, 2-full bath residence features a host of valuable updates, including replacement vinyl windows for energy efficiency. The interior shines with fresh paint, newly laid carpet, and durable new luxury vinyl plank flooring in the kitchen. Enjoy the convenience of first-floor laundry, central air, and a newer hot water heater. The exterior is equally inviting with a fenced-in backyard, fire pit, and a detached one-car garage with plenty of additional alley parking. Located just a short drive from local downtown restaurants, shopping, and a straight shot to the bypass, this home combines size, style, and a prime location.
ⓘ Source: listings_history table (triggers on properties + properties_extension) + one-shot
backfill from property_details.listing_events for pre-trigger history.
Tax reassessment forecast OH · Partial reset (capped growth)
- Current annual tax
- $1,779 · $148/mo
- Projected year-2 tax
- $2,520 · $210/mo
- Expected delta
- +$740/yr (+$62/mo · 41.6%)
ⓘ Screening estimate from a state-policy table — verify with the county assessor before closing.
Climate risk First Street
- Flood 1/10 Low FEMA zone X (unshaded) · 0% chance over 30 yrs
- Wildfire 1/10 Low
- Heat 4/10 Moderate 7 d/yr ≥99°F today · 19 d/yr by 30 yrs out
- Wind 2/10 Low 100% chance of damaging wind over 30 yrs
- Air quality 2/10 Low 1 unhealthy d/yr today · 2 by 30 yrs out
Nearby sold comps map
Loading sold comps map…
Walkable amenities ~0.75 mi
Loading nearby amenities…
Taxation est. · year 1
- Rental income
- $19,556
- − Mortgage interest
- −$11,707
- − Property taxes
- −$1,779
- − Insurance
- −$1,045
- − Repairs & maintenance
- −$1,564
- − Management
- −$1,564
- − Depreciation
- −$6,080
- Taxable loss
- −$4,185
- Est. tax savings @ 24.0%
- +$1,004
- After-tax cash flow
- $477/yr
For passive investors: Depreciation is non-cash, so a rental often shows a tax loss while cash-flowing — sheltering income. Rental losses are passive: they offset passive income freely, and up to $25,000/yr can offset ordinary (W-2) income if you actively participate and your MAGI is under $100k (phasing out to $0 by $150k); unused losses carry forward. On sale, claimed depreciation is recaptured at up to 25%, and gains may owe capital-gains tax (a 1031 exchange can defer both). Figures are a year-1 estimate at your 24.0% rate — not tax advice; consult a CPA.
Schools (NCES district)
- District
- Lancaster City
- NCES district ID
- 3904420
- Math proficiency
- 38% ▼ -21.00%
- Reading proficiency
- 51% ▼ -11.00%
- Median HH income
- $41,696
- Composite
- 37.39/100
- National rank
- #4427
- State rank
- #504 of 656 in OH
Livability — Lancaster
- Score
- 86/100
- State rank
- #41
- US rank
- #423
Category grades
Schools grade is shown separately in the Schools card above.
Census & demographics
- Census place
- Lancaster, OH
- County
- Fairfield County · 109,896 people
- City population
- 62,933
- Metro
- Columbus, OH
- Population (ZIP)
- 62,933
- Household income
- $72,153
- Rent vs Own
- Severe rent burden
- 1400.0
Population outlook (Fairfield County) Hauer SSP2
- Today (2025)
- 162,442 people
- By 2030
- 166,796 · +2.7%
- By 2040
- 172,835 · +6.4%
- By 2050
- 174,822 · +7.6%
- By 2075
- 174,938 · +7.7%
- By 2100
- 160,988 · -0.9%
Race, ethnicity, and origin ACS 2023
- Neighborhood character
- Predominantly White (91%)
- Race & ethnicity
- White 91% Two or more races 4% Hispanic / Latino 2% Black 2%
- Common ancestry
- Slovak 2% Italian 1% Iranian 1%
- Foreign-born
- 1% · Canada
- Languages at home
- 98% English-only · Spanish 1%
Political lean MEDSL · Fairfield
- 2024 margin
- Strong R (+24.1) · D 37.5% · R 61.6%
- 2008→2024 swing
- -6.9pp toward R · 2008: -17.1pp · 2024: -24.1pp
- All cycles
- 2024: R+24.1 2020: R+23.5 2016: R+27.0 2012: R+16.1 2008: R+17.1
Not yet ingested
- Civics
- —
Market trends
- HPI YoY
- ▼ -298.81%
- Current HPI
- 239.6352
- Rent YoY
- ▲ 5.22%
- Metro
- Columbus, OH
- State GDP YoY
- ▲ 1.98%
- F500 in state
- 48
Industry mix (Fortune 500 HQ in OH)
| Industry | F500 HQs | Revenue |
|---|---|---|
| Insurance | 3 | $145B |
|
||
| Industrial Machinery | 3 | $49B |
|
||
| Financial Services | 3 | $24B |
|
||
| Consumer Goods | 2 | $93B |
|
||
| Aerospace / Defense | 2 | $47B |
|
||
| Utilities | 2 | $33B |
|
||
Price history
-2.0% since first listed3 events — show timeline
- 2026-02-26 Price Changed $239,900 CBRMLS
- 2026-02-08 Listed $244,900 CBRMLS
- 2026-02-04 Coming Soon $244,900 CBRMLS
Property tax history
+8.1%/yrLatest (2025): $1,779 · +39.7% YoY. Source: county tax records.
Cash-flow waterfall
monthlySold comps — $/sqft
last 12 mo · ≤1 miLoading sold comps…