206 S Chestnut St · Earl Park, IN
Flood risk 1/10 · Minimal
- FEMA flood zone
- X (unshaded)
- Chance of flooding over 30 yrs
- 0.0%
- Est. flood insurance / yr
- $473 – $860
Fire risk 1/10 · Minimal
- Est. fire insurance / yr
- $717 – $1,331
Heat risk 3/10 · Minor
- Hot days now (above 103°F)
- 7 days/yr
- Hot days in 30 yrs
- 17 days/yr
Wind risk 2/10 · Minimal
- Chance of severe wind over 30 yrs
- 1.0%
Air-quality risk 2/10 · Minimal
- Unhealthy air days now
- 1 days/yr
- Unhealthy air days in 30 yrs
- 2 days/yr
Risk factors via First Street. Map © Google.
Why this score? — see what drove the D+ grade
The composite is a weighted blend of 9 inputs, each scored 0–100. Each bar is that input's sub-score; the figure is the points it added to the 100-point composite (weight × sub-score).
- Cash flow +13.8/30.0
- Appreciation +8.6/10.0
- ARV discount +7.5/15.0
- DSCR +4.2/10.0
- Schools +3.5/10.0
- Livability +3.2/5.0
- 1% rule +3.1/10.0
- Rent growth +2.5/5.0
- Condition / age +2.5/5.0
$159,900
🖨 Deal sheet (PDF) 📄 Offer letter ✓ Due diligence
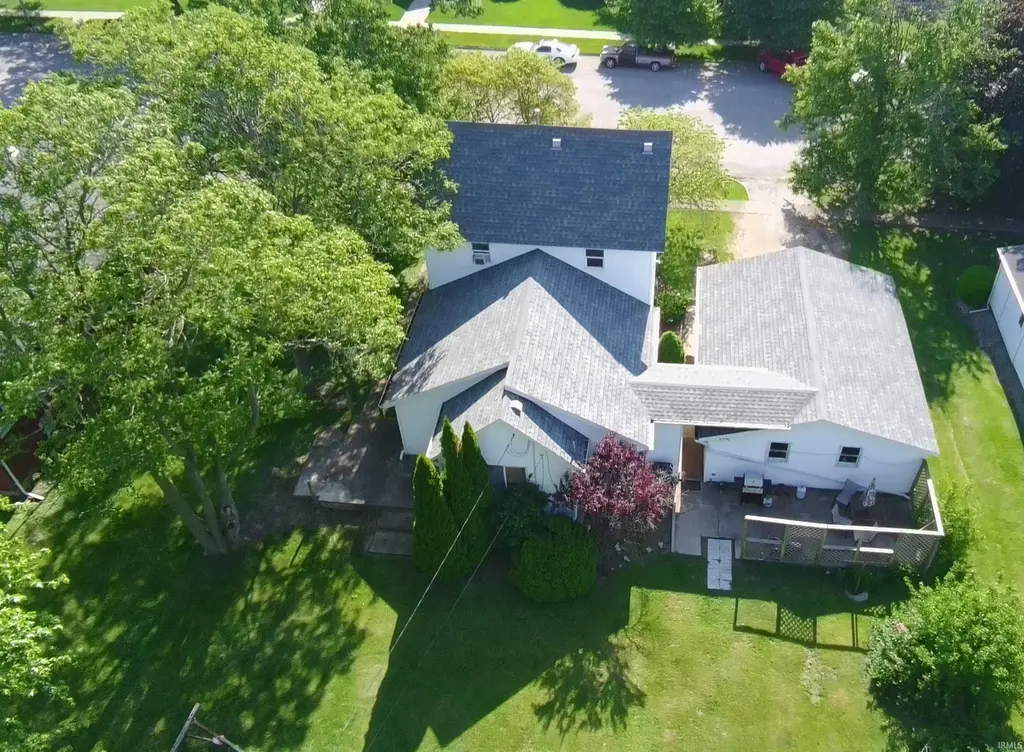
Listing remarks
We've got a wonderful home priced just right for you! This property has had several updates over the last few years including updates to the baths, some new flooring, and a newer roof. Located in the heart of the wonderful community of Earl Park and offering 3 to possibly 4 bedrooms, 2 baths, a 2 car garage, PLUS an extra storage shed in the backyard, both front porch and back patios for your outdoor activities, a spacious yard, and so much more. We really love the corner built-ins that you'll find tucked away in the open dining space. The kitchen also has plenty of room to add your chef's island if you so desire. Come check it out for yourself, this one won't last long at all!
Key facts
- 0.36 acre lot
- 2 garage spots
- Built 1910
Neighborhood map
What this means for you Summary
Snapshot
- This is a 4-bed/2.0-bath single-family listed at $160k.
Deal economics
- At list price, monthly cash flow is $14 ($167/yr) — positive.
- The deal already cash-flows at list — no discount required.
- To meet the 1% rule (rent ≥ 1% of price), the offer needs to be $129k (19.2% below list).
- Recommended offer: $129k (19.2% below list) — sets the bar for 1% rule.
Location & tenants
- Location reads 64/100 on livability (#392 in IN) — a middle-class / working-renter tenant base. Strengths: cost of living A+, housing A+; Watch: amenities F, commute F, health & safety F.
- Benton Community School Corporation (rural): math 38% / reading 43% proficiency, ranked #134 of 301 in IN (top 44%) — families likely to look elsewhere, expect single-tenant / working-renter base with shorter leases.
- Zoned schools: Prairie Crossing Elementary School (math 46% / reading 37%, grade F, #478 of 994 statewide, top 49%, 561 students, 65% FRL); Benton Central Jr-Sr High School (math 31% / reading 53%, grade F, #197 of 369 statewide, top 57%, 790 students, 48% FRL) — zoned schools average 57% FRL vs 38% district-wide (18 pts higher); higher-poverty schools than district average — tighter screening recommended.
- Market conditions: 8 active listings in the ZIP.
Forward outlook
- In year one you build about $12k of equity ($1k loan paydown + $11k appreciation (7.1% local appreciation)).
- Benton County population projected at -13% by 2050 — secular population decline; favor cash flow + early exit over multi-decade hold.
- At projected returns (7.1% appreciation + 3.0% rent growth), your $45k cash investment doubles in ~4 years — after that, you're playing with house money.
- By year 3, paydown + projected appreciation supports a ~$31k cash-out refi (75% LTV) — recoverable capital for the next deal without selling this one.
Negotiation context
- Only 0 days on market — expect competitive offers; lowballing is unlikely to land.
- Current owner paid $69k; list at $160k implies a 132% gain — meaningful room to come down on a strong offer.
Risks & watch-outs
- Watch-outs: built in 1910 — expect roof / HVAC / electrical / plumbing capex.
Questions for the listing agent
- Built in 1910 — when were the roof, HVAC, electrical panel, plumbing, and water heater last replaced?
- Is there a deadline driving the sale (1031 exchange, divorce, estate, relocation)? That informs how much negotiation room exists.
- Schools are F-rated, which usually means shorter tenancies and higher turnover. Who's the typical renter profile here, and what's been the actual vacancy rate?
- The area grade is low — what's the realistic commute time and amenity access for the typical tenant pool here? Any planned neighborhood developments (good or bad) we should know about?
- What's the average days-on-market for RENTAL listings here right now (not sales)? A rising rental-DOM trend means longer vacancies and softer asking-rent achievability than the comps imply.
- What's the recent tenant-quality profile in this submarket — average credit score on applications, eviction rate, late-payment / NSF rate, and stable-employment percentage? A property-management company in the area should have these aggregated.
- How much new for-sale + rental construction is in the pipeline within 1–3 miles? Heavy new supply typically softens prices + rents 12–24 months out; constrained supply supports both.
Investment metrics
- 1% rule
- 0.81% ✗
- Cap rate
- 6.40%
- Cash-on-cash
- 0.37%
- DSCR
- 1.02
- GRM
- 10.3
CMA / ARV
No comps found within radius.
Projected returns pro-forma
7.11% appreciation · 3.0% rent growth · sell at horizon
- IRR
- 18.2%
- Equity multiple
- 2.29×
- Total profit
- $57,723
- Equity at exit
- $111,915
- IRR
- 17.4%
- Equity multiple
- 4.73×
- Total profit
- $166,935
- Equity at exit
- $213,600
Cash invested: $44,772 (down + closing). Projections, not guarantees.
Landlord ↔ Tenant lean methodology
- Overall (STATE)
- 90 Strongly Landlord-Friendly
- State Indiana
- 90 Strongly Landlord-Friendly · R+11
- County
- — inherits STATE
- City
- — inherits STATE
ZIP-level market 47942
- Home prices YoY
- 2.4%
- Active inventory
- 8
- Price-to-rent
- 10.3×
Monthly cashflow live
- Estimated rent
- $1,292 medium interval (Pro) →
- Mortgage (P&I)
- −$839
- Tax from tax record
- −$102 /mo · $1,222/yr
- Insurance
- −$67
- HOA
- −$0
- Vacancy / Maint / Mgmt
- −$271
- Net cashflow
- $14
Break-even live
Sensitivity live
| Price | -10% $104 | -5% $59 | +0% $14 | +5% $-31 | +10% $-77 |
|---|---|---|---|---|---|
| Rent | -10% $-88 | -5% $-37 | +0% $14 | +5% $65 | +10% $116 |
| Rate | -1.0pp $94 | -0.5pp $55 | base $14 | +0.5pp $-28 | +1.0pp $-70 |
UW: 25.0% down · 7.5% · 30yr · 1.5% tax · 5.0% vac · 8.0% maint · 8.0% mgmt
Financing live
Cash to close
- Down payment
- $39,975
- Closing costs
- $4,797
- Reserves months
- —
- Total cash needed
- —
Loan-product check · same deal, 3 products live
Conventional
25% down · 7.5% · 30yr
- Down + closing
- —
- Monthly P&I
- —
- Monthly cashflow
- —
- DSCR
- —
- Eligible?
- —
Personal DTI + credit; lowest rate.
DSCR
20% down · 8.5% · 30yr
- Down + closing
- —
- Monthly P&I
- —
- Monthly cashflow
- —
- DSCR
- —
- Eligible?
- —
No personal income docs; deal must DSCR.
Hard money
10% down · 12.0% · 12mo
- Down + closing
- —
- Monthly P&I
- —
- Monthly cashflow
- —
- DSCR
- —
- Eligible?
- —
Short-term bridge; refi at stabilization.
Listing history 4 events
-
2012-09-24soldstatus $69,000
-
2012-06-14historical
-
2012-05-02historical
-
2012-01-13$74,900
ⓘ Source: listings_history table (triggers on properties + properties_extension) + one-shot
backfill from property_details.listing_events for pre-trigger history.
Tax reassessment forecast IN · Partial reset (capped growth)
- Current annual tax
- $1,222 · $102/mo
- Projected year-2 tax
- $1,291 · $108/mo
- Expected delta
- +$69/yr (+$6/mo · 5.6%)
ⓘ Screening estimate from a state-policy table — verify with the county assessor before closing.
Climate risk First Street
- Flood 1/10 Low FEMA zone X (unshaded) · 0% chance over 30 yrs
- Wildfire 1/10 Low
- Heat 3/10 Moderate 7 d/yr ≥103°F today · 17 d/yr by 30 yrs out
- Wind 2/10 Low 100% chance of damaging wind over 30 yrs
- Air quality 2/10 Low 1 unhealthy d/yr today · 2 by 30 yrs out
Nearby sold comps map
Loading sold comps map…
Walkable amenities ~0.75 mi
Loading nearby amenities…
Taxation est. · year 1
- Rental income
- $15,507
- − Mortgage interest
- −$8,957
- − Property taxes
- −$1,222
- − Insurance
- −$800
- − Repairs & maintenance
- −$1,241
- − Management
- −$1,241
- − Depreciation
- −$4,652
- Taxable loss
- −$2,604
- Est. tax savings @ 24.0%
- +$625
- After-tax cash flow
- $792/yr
For passive investors: Depreciation is non-cash, so a rental often shows a tax loss while cash-flowing — sheltering income. Rental losses are passive: they offset passive income freely, and up to $25,000/yr can offset ordinary (W-2) income if you actively participate and your MAGI is under $100k (phasing out to $0 by $150k); unused losses carry forward. On sale, claimed depreciation is recaptured at up to 25%, and gains may owe capital-gains tax (a 1031 exchange can defer both). Figures are a year-1 estimate at your 24.0% rate — not tax advice; consult a CPA.
Schools (NCES district)
- District
- Benton Community School Corporation
- NCES district ID
- 1800480
- Math proficiency
- 38% ▼ -7.00%
- Reading proficiency
- 43% ▼ -7.00%
- Median HH income
- $50,073
- Composite
- 34.9/100
- National rank
- #5076
- State rank
- #134 of 301 in IN
Livability — Earl Park
- Score
- 64/100
- State rank
- #392
- US rank
- #14495
Category grades
Schools grade is shown separately in the Schools card above.
Census & demographics
- Census place
- Earl Park, IN
- Population (ZIP)
- 789
Population outlook (Benton County) Hauer SSP2
- Today (2025)
- 8,404 people
- By 2030
- 8,234 · -2.0%
- By 2040
- 7,832 · -6.8%
- By 2050
- 7,337 · -12.7%
- By 2075
- 6,436 · -23.4%
- By 2100
- 5,139 · -38.9%
Race, ethnicity, and origin ACS 2023
- Neighborhood character
- Predominantly White (94%)
- Race & ethnicity
- White 94% Two or more races 4% Hispanic / Latino 3%
- Common ancestry
- Lithuanian 8% Romanian 5% Iranian 1%
- Languages at home
- 99% English-only · Spanish 1%
Political lean MEDSL · Benton
- 2024 margin
- Solid R (+47.1) · D 25.5% · R 72.7% · Other 1.8%
- 2008→2024 swing
- -30.9pp toward R · 2008: -16.3pp · 2024: -47.1pp
- All cycles
- 2024: R+47.1 2020: R+48.6 2016: R+47.0 2012: R+32.7 2008: R+16.3
Not yet ingested
- Civics
- —
Market trends
- HPI YoY
- ▲ 7.11%
- Current HPI
- 305.0335
- Rent YoY
- —
- Metro
- —
- State GDP YoY
- ▲ 2.90%
- F500 in state
- 18
Industry mix (Fortune 500 HQ in IN)
| Industry | F500 HQs | Revenue |
|---|---|---|
| Industrial Machinery | 2 | $37B |
|
||
| Healthcare | 1 | $177B |
|
||
| Pharmaceuticals | 1 | $45B |
|
||
| Metals / Steel | 1 | $18B |
|
||
| Agriculture | 1 | $17B |
|
||
| Packaging | 1 | $12B |
|
||
Price history
-7.9% since first listed4 events — show timeline
- 2012-09-24 Sold (Public Records) $69,000 Public Records
- 2012-06-14 Listing Removed — NIRA MLS as Distributed by MLS Grid
- 2012-05-02 Listing Removed — MRED as Distributed by MLS Grid
- 2012-01-13 Listed $74,900 NIRA MLS as Distributed by MLS Grid
Property tax history
+12.2%/yrLatest (2024): $1,222 · +11.7% YoY. Source: county tax records.
Cash-flow waterfall
monthlySold comps — $/sqft
last 12 mo · ≤1 miLoading sold comps…