16810 N 2nd Dr #269 · Phoenix, AZ
Flood risk 1/10 · Minimal
- FEMA flood zone
- X (unshaded)
- Chance of flooding over 30 yrs
- 0.0%
- Est. flood insurance / yr
- $507 – $1,088
Fire risk 1/10 · Minimal
- Est. fire insurance / yr
- $610 – $1,132
Heat risk 8/10 · Major
- Hot days now (above 110°F)
- 5 days/yr
- Hot days in 30 yrs
- 13 days/yr
Wind risk 1/10 · Minimal
- Chance of severe wind over 30 yrs
- —
Air-quality risk 3/10 · Minor
- Unhealthy air days now
- 3 days/yr
- Unhealthy air days in 30 yrs
- 4 days/yr
Risk factors via First Street. Map © Google.
Why this score? — see what drove the C- grade
The composite is a weighted blend of 9 inputs, each scored 0–100. Each bar is that input's sub-score; the figure is the points it added to the 100-point composite (weight × sub-score).
- Cash flow +15.0/30.0
- ARV discount +15.0/15.0
- 1% rule +5.0/10.0
- DSCR +5.0/10.0
- Livability +3.8/5.0
- Condition / age +2.5/5.0
- Schools +2.3/10.0
- Rent growth +1.7/5.0
- Appreciation +0.0/10.0
$29,000
🖨 Deal sheet 📄 Offer letter ✓ Due diligence
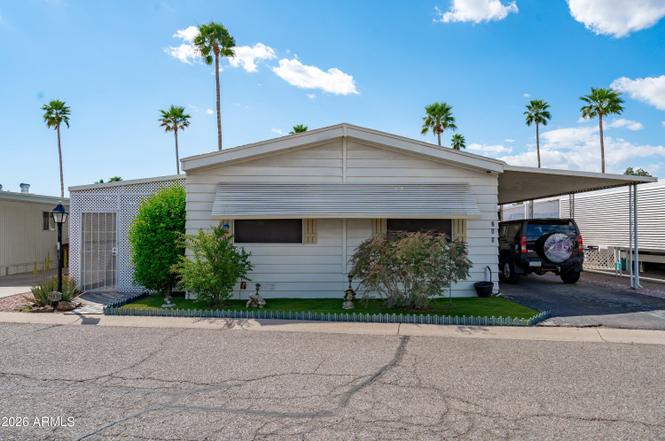
Listing remarks
Charming 3 bedroom, 2 bath mobile home in a highly desirable location close to popular dining and convenient shopping. Nestled within a welcoming adult community, residents enjoy fantastic amenities including a refreshing pool, golf, shuffleboard, and a vibrant clubhouse. The property also features a fenced yard area, perfect for relaxing or entertaining, and a separate workshop with power, ideal for hobbies or extra storage. A wonderful opportunity to enjoy comfort, convenience, and an active lifestyle all in one place.
Key facts
- Refreshing pool
- Vibrant clubhouse
- 2 parking spots
Tags
Property features AI
Finance
- Other: Lot size source: owner; Building area source: owner
- HOA & community: Land lease: $1,063 monthly; Community pool; Community golf
Exterior
- Parking: 2 covered parking spaces; 2 carport spaces
- Utilities: City water; Public sewer
- Home design: Manufactured/mobile home; Leasehold ownership
- Construction: Aluminum siding; Wood frame construction; Composition roof; Foam roof
- Exterior features: Screened-in patio(s); Storage; Gravel/stone front yard; Gravel/stone back yard; Synthetic grass in back
Interior
- Kitchen: Refrigerator; Dishwasher; Disposal; Walk-in pantry
- Bedrooms: Up to 3 bedrooms
- Flooring: Carpet; Vinyl
- Bathrooms: 2 full bathrooms
- Heating & cooling: Natural gas heating; Central air; Programmable thermostat
- Interior features: High-speed internet; Granite counters; Breakfast bar; No interior steps; Vaulted ceilings; Separate shower and tub
- Laundry & utility: Inside laundry
Neighborhood map
What this means for you Summary
Snapshot
- This is a 3-bed/2.0-bath manufactured listed at $29k.
Deal economics
- At list price, monthly cash flow is $1k ($18k/yr) — positive.
- The deal already cash-flows at list — no discount required.
- Meets the 1% rule at list price ($2k rent vs $29k).
- Recommended offer: $26k (9.0% below list) — sets the bar for market timing.
- Cap rate 67.9% vs local median 3.3% in Phoenix — top-decile yield for the area; either an underpriced asset or a hidden risk that comps aren't pricing in. Stress-test before assuming the spread holds.
Location & tenants
- Location reads 75/100 on livability (#16 in AZ, #3,924 nationally) — a middle-class / working-renter tenant base. Strengths: amenities A+, commute A+, housing A+; Watch: health & safety C-, crime F.
- Glendale Union High School District (4285) (urban): math 23% / reading 31% proficiency, ranked #130 of 249 in AZ (top 52%) — low school quality limits family demand, transient renter base, plan for 1-2y turnover.
- Market conditions: Rents falling (-3.4%/yr); 138 active listings in the ZIP; 40 comparable units currently listed for rent nearby; rentals leasing fast (median 11d on market — plan ~1-2 weeks tenant-placement turnaround); solid renter incomes; 36,011 units permitted in Maricopa County in 2024 (12,801 in 5+ unit buildings).
- This rent runs 33% of the median local income ($77k/yr) — at the standard rent-burdened threshold; future hikes will face affordability resistance.
Forward outlook
- Local home prices are declining (-3.0%/yr); year-one equity from $200 of loan paydown is wiped out by about $870 of value loss. Plan a longer hold.
- Maricopa County population projected at +38% by 2050 — long-run rental-demand tailwind backs the buy-and-hold thesis.
- At projected returns (-3.0% appreciation + 0.0% rent growth), your $8k cash investment doubles in ~1 year — after that, you're playing with house money.
Negotiation context
- It's been on market 94 days — a 9% lower offer ($26k) is reasonable based on typical stale-listing flexibility.
- 2 sale attempts; this cycle's ask has dropped $21k (42%) from the opening price — seller is motivated, your offer sets the floor, not the list.
Risks & watch-outs
- Climate carrying-cost: extreme-heat days projected 5→13/yr by 2055 (HVAC capex compounding) — expect insurance premiums to compound above CPI over the hold.
Questions for the listing agent
- It's been on market 94 days. Have you received any prior offers? Is the seller open to a 9% concession, seller financing, or rate buy-down credit?
- Why hasn't it sold? Are there any deal-killer items the seller is aware of (foundation, flood, title, zoning, code violations)?
- Is there a deadline driving the sale (1031 exchange, divorce, estate, relocation)? That informs how much negotiation room exists.
- Crime grade is F in this area — have there been break-ins, vandalism, or insurance claims at this property in the last 3 years? What carrier currently insures it and at what premium?
- What's the average days-on-market for RENTAL listings here right now (not sales)? A rising rental-DOM trend means longer vacancies and softer asking-rent achievability than the comps imply.
- What's the recent tenant-quality profile in this submarket — average credit score on applications, eviction rate, late-payment / NSF rate, and stable-employment percentage? A property-management company in the area should have these aggregated.
- How much new for-sale + rental construction is in the pipeline within 1–3 miles? Heavy new supply typically softens prices + rents 12–24 months out; constrained supply supports both.
Investment metrics
- 1% rule
- 7.37% ✓
- Cap rate
- 67.88%
- Cash-on-cash
- 219.95%
- DSCR
- 10.79
- GRM
- 1.1
CMA / ARV
- ARV (on-the-fly)
- $43,008
- Comps found
- 7
Show comp detail 7 sales within ~0.75 mi
| Address | Dist | Beds/Ba | Sqft | Sold | Price | $/sf | Match |
|---|---|---|---|---|---|---|---|
| 16804 N 2nd Dr #156 | 0.03mi | 2/2.0 (-1) | 1,440 (-6%) | 10mo | $67,000 | $47 | 75 |
| 16805 N 1st Dr #22 | 0.12mi | 2/2.0 (-1) | 1,560 (+2%) | 16mo | $43,500 | $28 | 73 |
| 16809 N 1st Ave #47 | 0.15mi | 3/2.0 | 1,440 (-6%) | 16mo | $22,000 | $15 | 69 |
| 16607 N 3rd Ave | 0.14mi | 2/2.0 (-1) | 1,344 (-12%) | 3mo | $100,000 | $74 | 65 |
| 16811 N 1st Ave #48 | 0.15mi | 2/2.0 (-1) | 1,440 (-6%) | 16mo | $20,000 | $14 | 64 |
| 16602 N 2nd Ln | 0.16mi | 2/2.0 (-1) | 1,344 (-12%) | 6mo | $59,900 | $45 | 62 |
| 16814 N 2nd Ln #245 | 0.04mi | 2/2.0 (-1) | 1,344 (-12%) | 23mo | $35,500 | $26 | 53 |
Match score weights: distance 35% · size 25% · config 20% · recency 20%. Top-matched comps best support the ARV.
Projected returns pro-forma
-3.0% appreciation · 0.0% rent growth · sell at horizon
- IRR
- —
- Equity multiple
- 11.33×
- Total profit
- $83,861
- Equity at exit
- $4,324
- IRR
- —
- Equity multiple
- 22.06×
- Total profit
- $171,006
- Equity at exit
- $2,507
Cash invested: $8,120 (down + closing). Projections, not guarantees.
Landlord ↔ Tenant lean methodology
- Overall (STATE)
- 87 Strongly Landlord-Friendly
- State Arizona
- 87 Strongly Landlord-Friendly · R+3
- County
- — inherits STATE
- City
- — inherits STATE
ZIP-level market 85023
- Rents YoY
- -3.4%
- Active inventory
- 138
- Price-to-rent
- 1.1×
Monthly cashflow live
- Estimated rent
- $2,138 high interval (Pro) →
- Mortgage (P&I)
- −$152
- Tax est. 1.5%
- −$36 /mo · $435/yr
- Insurance
- −$12
- HOA
- −$0
- Vacancy / Maint / Mgmt
- −$449
- Net cashflow
- $1,488
Break-even live
UW: 25.0% down · 7.5% · 30yr · 1.5% tax · 5.0% vac · 8.0% maint · 8.0% mgmt
Financing live
Cash to close
- Down payment
- $7,250
- Closing costs
- $870
- Reserves months
- —
- Total cash needed
- —
Loan-product check · same deal, 3 products live
Conventional
25% down · 7.5% · 30yr
- Down + closing
- —
- Monthly P&I
- —
- Monthly cashflow
- —
- DSCR
- —
- Eligible?
- —
Personal DTI + credit; lowest rate.
DSCR
20% down · 8.5% · 30yr
- Down + closing
- —
- Monthly P&I
- —
- Monthly cashflow
- —
- DSCR
- —
- Eligible?
- —
No personal income docs; deal must DSCR.
Hard money
10% down · 12.0% · 12mo
- Down + closing
- —
- Monthly P&I
- —
- Monthly cashflow
- —
- DSCR
- —
- Eligible?
- —
Short-term bridge; refi at stabilization.
Rent comps 40 comps
| Address | Beds | Baths | Sqft | Rent | $/sqft | DOM | Units | Dist |
|---|---|---|---|---|---|---|---|---|
| 220 W Bell Rd Phoenix, AZ | 1.0–3.0 | 1.0–2.0 | 1082 | $1,989 | $1.84 | 1d | 32 | 0.17mi |
| 11 E Bell Rd Phoenix, AZ | 1.0–2.0 | 1.0–2.0 | 950 | $1,705 | $1.79 | 1d | 11 | 0.21mi |
| 415 W Aire Libre Ave Phoenix, AZ | 3.0 | 2.0 | 1615 | $2,100 | $1.30 | 16d | 1 | 0.24mi |
| 233 W Sandra Ter Phoenix, AZ | 3.0 | 2.0 | 1971 | $2,895 | $1.47 | 1d | 1 | 0.33mi |
| 618 W Aire Libre Ave Phoenix, AZ | 4.0 | 2.5 | 2057 | $2,750 | $1.34 | 2d | 1 | 0.34mi |
| 234 W Beverly Ln Phoenix, AZ | 3.0 | 2.0 | 1971 | $2,950 | $1.50 | 23d | 1 | 0.36mi |
| 118 E Anderson Ave Phoenix, AZ | 2.0 | 2.0 | 1272 | $1,950 | $1.53 | 24d | 1 | 0.37mi |
| 17420 N 2nd Ave Phoenix, AZ | 3.0 | 2.0 | 1312 | $2,000 | $1.52 | 21d | 1 | 0.40mi |
| 229 E Anderson Ave Phoenix, AZ | 2.0 | 2.0 | 1256 | $2,100 | $1.67 | 7d | 1 | 0.47mi |
| 314 E Hartford Ave Phoenix, AZ | 2.0 | 2.0 | 1320 | $2,195 | $1.66 | 24d | 1 | 0.52mi |
| 313 W Monte Cristo Ave Phoenix, AZ | 3.0 | 2.0 | 1725 | $2,550 | $1.48 | 1d | 1 | 0.53mi |
| 16220 N 7th St Phoenix, AZ | 1.0–2.0 | 1.0–2.0 | 885 | $1,708 | $1.93 | 1d | 35 | 0.56mi |
| 16229 N 10th Ave Phoenix, AZ | 4.0 | 2.0 | 2111 | $2,550 | $1.21 | 13d | 1 | 0.62mi |
| 15822 N 5th Ave Phoenix, AZ | 3.0 | 2.0 | 1558 | $2,400 | $1.54 | 1d | 1 | 0.62mi |
| 17646 N 6th Ave Phoenix, AZ | 3.0 | 2.0 | 1286 | $2,200 | $1.71 | 3d | 1 | 0.63mi |
| 17249 N 7th St Phoenix, AZ | 1.0–3.0 | 1.0–2.0 | 956 | $1,933 | $2.02 | 1d | 37 | 0.84mi |
| 18207 N 5th Ave Phoenix, AZ | 3.0 | 2.0 | 1651 | $2,300 | $1.39 | 7d | 1 | 0.85mi |
| 17625 N 7th St Phoenix, AZ | 1.0–3.0 | 1.0–2.0 | 925 | $1,739 | $1.88 | 3d | 7 | 0.92mi |
| 1312 W Libby St Phoenix, AZ | 4.0 | 2.5 | 1997 | $2,650 | $1.33 | 24d | 1 | 0.98mi |
| 815 E Grovers Ave Phoenix, AZ | 1.0–2.0 | 1.0–2.5 | 1469 | $2,800 | $1.91 | 5d | 2 | 1.04mi |
| 17243 N 10th St Phoenix, AZ | 3.0 | 2.5 | 2196 | $3,100 | $1.41 | 24d | 1 | 1.09mi |
| 726 E Villa Rita Dr Phoenix, AZ | 2.0 | 2.0 | 1088 | $2,000 | $1.84 | 10d | 1 | 1.10mi |
| 726 E Villa Rita Dr Phoenix, AZ | 2.0 | 2.0 | 1088 | $2,000 | $1.84 | 18d | 1 | 1.10mi |
| 1413 W Villa Rita Dr Phoenix, AZ | 3.0 | 2.0 | 1539 | $1,850 | $1.20 | 21d | 1 | 1.12mi |
| 1100 E Bell Rd Phoenix, AZ | 1.0–3.0 | 1.0–2.0 | 987 | $2,274 | $2.30 | 1d | 26 | 1.13mi |
| 1305 W Villa Maria Dr Phoenix, AZ | 3.0 | 2.0 | 1401 | $2,300 | $1.64 | 18d | 1 | 1.14mi |
| 1028 E Paradise Ln Phoenix, AZ | 3.0 | 2.0 | 1624 | $2,195 | $1.35 | 24d | 1 | 1.15mi |
| 18624 N 2nd Ave Phoenix, AZ | 4.0 | 2.0 | 1813 | $2,600 | $1.43 | 24d | 1 | 1.15mi |
| 17617 N 9th St Phoenix, AZ | 1.0–3.0 | 1.0–2.0 | 956 | $2,017 | $2.11 | 1d | 35 | 1.16mi |
| 229 W Pine Valley Dr Phoenix, AZ | 3.0 | 2.0 | 2168 | $3,300 | $1.52 | 1d | 1 | 1.21mi |
| 16875 N 12th St #3 Phoenix, AZ | 3.0 | 2.5 | 1755 | $2,600 | $1.48 | 12d | 1 | 1.21mi |
| 16875 N 12th St #24 Phoenix, AZ | 3.0 | 2.5 | 1736 | $2,200 | $1.27 | 7d | 1 | 1.21mi |
| 17617 N 17th Ln Phoenix, AZ | 3.0 | 2.0 | 1353 | $2,100 | $1.55 | 3d | 1 | 1.22mi |
| 1407 W Bluefield Ave Phoenix, AZ | 4.0 | 2.0 | 1710 | $2,350 | $1.37 | 18d | 1 | 1.22mi |
| 1637 W Tierra Buena Ln Phoenix, AZ | 4.0 | 2.0 | 2026 | $2,450 | $1.21 | 13d | 1 | 1.23mi |
| 1633 W Charleston Ave Phoenix, AZ | 3.0 | 1.5 | 1441 | $1,796 | $1.25 | 7d | 1 | 1.24mi |
| 524 W Rosemonte Dr Phoenix, AZ | 3.0 | 2.0 | 1515 | $2,500 | $1.65 | 24d | 1 | 1.27mi |
| 16875 N 12th St Unit 17 Phoenix, AZ | 3.0 | 2.5 | 1323 | $2,200 | $1.66 | 24d | 1 | 1.28mi |
| 1216 E Angela Dr Phoenix, AZ | 3.0 | 2.5 | 1887 | $2,300 | $1.22 | 24d | 1 | 1.29mi |
| 16601 N 12th St Phoenix, AZ | 1.0–3.0 | 1.0–2.0 | 1242 | $1,995 | $1.61 | 1d | 21 | 1.29mi |
Listing history 20 events
-
2026-06-18days on market $29,000 Active 94 DOM
-
2026-06-17days on market $29,000 Active 93 DOM
-
2026-06-16days on market $29,000 Active 92 DOM
-
2026-06-15days on market $29,000 Active 91 DOM
-
2026-06-13days on market $29,000 Active 89 DOM
-
2026-06-09days on market $29,000 Active 85 DOM
-
2026-06-08days on market $29,000 Active 84 DOM
-
2026-06-07days on market $29,000 Active 83 DOM
-
2026-06-04days on market $29,000 Active 80 DOM
-
2026-06-03days on market $29,000 Active 79 DOM
-
2026-06-02days on market $29,000 Active 78 DOM
-
2026-06-01days on market $29,000 Active 77 DOM
-
2026-05-31days on market $29,000 Active 76 DOM
-
2026-05-07price $29,000
-
2026-04-19status Active
-
2026-04-19price $35,000
-
2026-04-16status Pending
-
2026-04-09price $45,000
-
2026-03-27price $47,400
-
2026-03-13$49,900 Active
ⓘ Source: listings_history table (triggers on properties + properties_extension) + one-shot
backfill from property_details.listing_events for pre-trigger history.
Climate risk First Street
- Flood 1/10 Low FEMA zone X (unshaded) · 0% chance over 30 yrs
- Wildfire 1/10 Low
- Heat 8/10 Severe 5 d/yr ≥110°F today · 13 d/yr by 30 yrs out
- Wind 1/10 Low
- Air quality 3/10 Moderate 3 unhealthy d/yr today · 4 by 30 yrs out
Nearby sold comps map
Loading sold comps map…
Walkable amenities ~0.75 mi
Loading nearby amenities…
Taxation est. · year 1
- Rental income
- $25,652
- − Mortgage interest
- −$1,624
- − Property taxes
- −$435
- − Insurance
- −$145
- − Repairs & maintenance
- −$2,052
- − Management
- −$2,052
- − Depreciation
- −$844
- Taxable income
- $18,499
- Est. tax owed @ 24.0%
- −$4,440
- After-tax cash flow
- $13,420/yr
For passive investors: Depreciation is non-cash, so a rental often shows a tax loss while cash-flowing — sheltering income. Rental losses are passive: they offset passive income freely, and up to $25,000/yr can offset ordinary (W-2) income if you actively participate and your MAGI is under $100k (phasing out to $0 by $150k); unused losses carry forward. On sale, claimed depreciation is recaptured at up to 25%, and gains may owe capital-gains tax (a 1031 exchange can defer both). Figures are a year-1 estimate at your 24.0% rate — not tax advice; consult a CPA.
Schools (NCES district)
- District
- Glendale Union High School District (4285)
- NCES district ID
- 0403450
- Math proficiency
- 23% ▼ -38.00%
- Reading proficiency
- 31% ▼ -19.00%
- Median HH income
- $40,846
- Composite
- 22.81/100
- National rank
- #8020
- State rank
- #130 of 249 in AZ
Livability — Phoenix
- Score
- 75/100
- State rank
- #16
- US rank
- #3924
Category grades
Schools grade is shown separately in the Schools card above.
Census & demographics
- Census place
- Phoenix, AZ
- County
- Maricopa County · 4,537,380 people
- City population
- 1,500,198
- Metro
- Phoenix-Mesa-Chandler, AZ
- Population (ZIP)
- 35,034
- Household income
- $77,369
- Rent vs Own
- Severe rent burden
- 1539.0
Population outlook (Maricopa County) Hauer SSP2
- Today (2025)
- 4,979,203 people
- By 2030
- 5,378,229 · +8.0%
- By 2040
- 6,156,598 · +23.6%
- By 2050
- 6,872,376 · +38.0%
- By 2075
- 8,401,270 · +68.7%
- By 2100
- 9,247,439 · +85.7%
Race, ethnicity, and origin ACS 2023
- Neighborhood character
- Diverse neighborhood (Simpson 0.61)
- Race & ethnicity
- White 56% Hispanic / Latino 26% Two or more races 11% Black 7% Asian 6% Native American 2%
- Hispanic origin (detail)
- Mexican 22%
- Common ancestry
- Romanian 3% Italian 3% Portuguese 2%
- Foreign-born
- 17% · Canada, Jamaica, Vietnam
- Languages at home
- 73% English-only · Spanish 18% Other Indo-European 3% Other Asian/Pacific 2%
Political lean MEDSL · Maricopa
- 2024 margin
- Toss-up / Even · D 47.7% · R 51.2% · Other 1.1%
- 2008→2024 swing
- +7.1pp toward D · 2008: -10.6pp · 2024: -3.5pp
- All cycles
- 2024: R+3.5 2020: D+2.2 2016: R+3.5 2012: R+12.0 2008: R+10.6
Not yet ingested
- Civics
- —
Market trends
- HPI YoY
- ▼ -348.79%
- Current HPI
- 311.8587
- Rent YoY
- ▼ -3.35%
- Metro
- Phoenix-Mesa-Chandler, AZ
- State GDP YoY
- ▲ 4.54%
- F500 in state
- 20
Industry mix (Fortune 500 HQ in AZ)
| Industry | F500 HQs | Revenue |
|---|---|---|
| Technology | 2 | $13B |
|
||
| Mining / Metals | 1 | $23B |
|
||
| Environmental Services | 1 | $16B |
|
||
| Metals / Steel | 1 | $14B |
|
||
| Technology Distribution | 1 | $9B |
|
||
| Homebuilding | 1 | $8B |
|
||
Price history
-41.9% since first listed7 events — show timeline
- 2026-05-07 Price Changed $29,000 ARMLS
- 2026-04-19 Relisted — ARMLS
- 2026-04-19 Price Changed $35,000 ARMLS
- 2026-04-16 Pending — ARMLS
- 2026-04-09 Price Changed $45,000 ARMLS
- 2026-03-27 Price Changed $47,400 ARMLS
- 2026-03-13 Listed $49,900 ARMLS
Cash-flow waterfall
monthlySold comps — $/sqft
last 12 mo · ≤1 miLoading sold comps…