 6-Plex
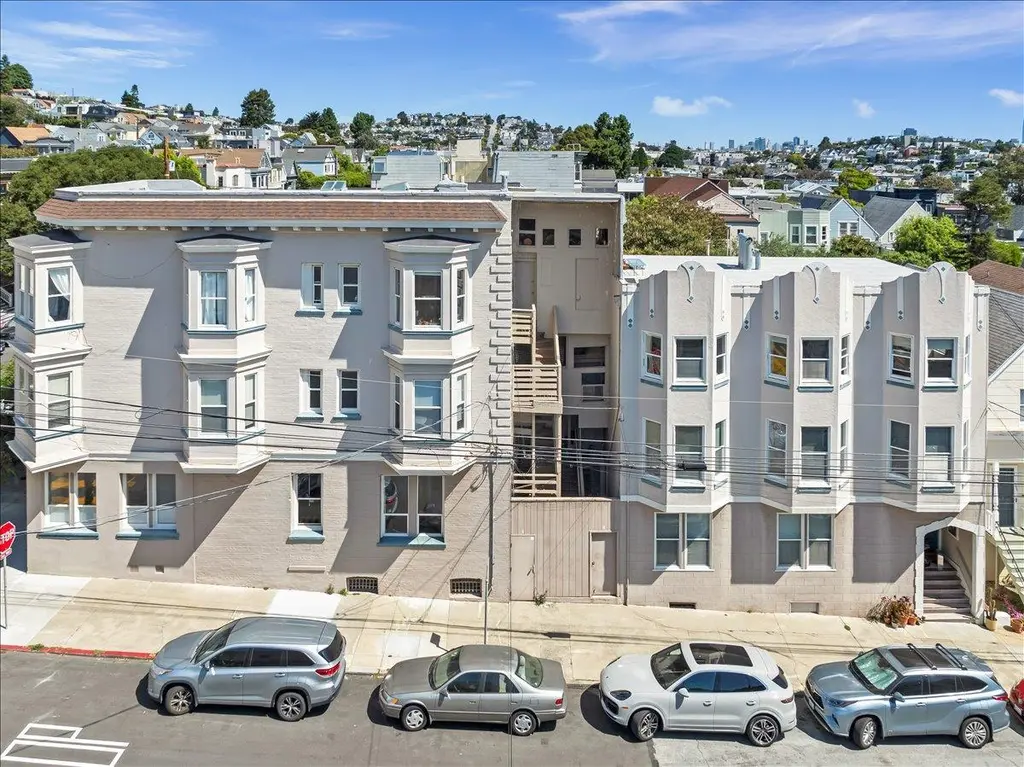
282 Valley St · San Francisco, CA
Flood risk 1/10 · Minimal
- FEMA flood zone
- X (unshaded)
- Chance of flooding over 30 yrs
- 0.0%
- Est. flood insurance / yr
- $507 – $1,088
Fire risk 1/10 · Minimal
- Est. fire insurance / yr
- $659 – $1,223
Heat risk 2/10 · Minimal
- Hot days now (above 78°F)
- 8 days/yr
- Hot days in 30 yrs
- 19 days/yr
Wind risk 1/10 · Minimal
- Chance of severe wind over 30 yrs
- —
Air-quality risk 7/10 · Major
- Unhealthy air days now
- 13 days/yr
- Unhealthy air days in 30 yrs
- 13 days/yr
Risk factors via First Street. Map © Google.
Why this score? — see what drove the D grade
The composite is a weighted blend of 9 inputs, each scored 0–100. Each bar is that input's sub-score; the figure is the points it added to the 100-point composite (weight × sub-score).
- Cash flow +11.0/30.0
- ARV discount +7.5/15.0
- Rent growth +5.0/5.0
- Schools +5.0/10.0
- Livability +3.8/5.0
- Condition / age +3.8/5.0
- 1% rule +3.2/10.0
- DSCR +3.2/10.0
- Appreciation +0.0/10.0
$3,480,000
🖨 Deal sheet (PDF) 📄 Offer letter ✓ Due diligence
Multi-family units
County records classify this as Multi-Family (5+ Unit). Listing-text estimate: 6 units. confirmed
5+ unit building — per-unit beds/baths from public records are typically unavailable; the breakdown below (if shown) is an estimate from the listing text.
Listing remarks MLS
282 Valley Street presents a rare opportunity to acquire a premier 6-unit apartment building in the heart of Noe Valley, one of San Francisco's most sought-after neighborhoods. Comprised of (5) spacious 2-bedroom / 1-bath units and (1) oversized 3-bedroom / 1-bath unit, the property offers an attractive in-place 5.09% CAP rate with a clear path to approximately 9.00% CAP through continued rent growth and operational optimization. Positioned on the coveted Sanchez Slow street with exceptional walkability to 24th Streets shops, restaurants, transit, and neighborhood amenities, 282 Valley Street offers investors immediate cash flow today with substantial long-term upside in one of San Francisco's strongest multifamily submarkets.
Key facts
- Noe valley
- Sanchez slow street
- Walkability to shops
Tags
Property features AI
Finance
- Other: Primary water meter; Property primary ID 745204; City transfer tax applies
- Financial info: Six-unit complex; Annual rental income approximately $230,595; Annual gross income approximately $246,510; Gross scheduled income approximately $254,134; Other income approximately $23,539; Total expenses approximately $70,084; Other expenses approximately $1,371; Vacancy factor 3%; Trash expense approximately $4,536; Utility expenses approximately $4,008; Gross rent multiplier 13.69; Unit rents: 2-bed units around $1,552; 3-bed unit around $5,095
Exterior
- Parking: On-street parking
- Utilities: Public water; Public sewer; Individual electric meters; Individual gas meters; Public utilities
- Home design: One building; Zoned RH2
- Construction: Concrete perimeter foundation
- Exterior features: Rolled composition roof; Tenant pays electric, gas, and other utilities
Interior
- Kitchen: Standard unit kitchens (specific appliances not listed)
- Bedrooms: Five 2-bedroom units; One 3-bedroom unit
- Bathrooms: Units include one full bath
- Heating & cooling: Electric heating
- Interior features: Coin-operated laundry available; some units have washer/dryer hookups
- Laundry & utility: Coin-operated laundry; some units include washer/dryer
Neighborhood map
What this means for you Summary
Snapshot
- This is a 5×2bd/1.0ba + 1×3bd/1.0ba units multifamily listed at $3.48M. Condition is rated good.
Deal economics
- At list price, monthly cash flow is $-1k ($-17k/yr) — negative. Per door: $-239/mo.
- To cash-flow at today's rent, offer at most $3.27M (6.0% below list).
- To meet the 1% rule (rent ≥ 1% of price), the offer needs to be $2.86M (17.7% below list).
- Recommended offer: $2.86M (17.7% below list) — sets the bar for 1% rule.
- Cap rate 5.8% vs local median 2.1% in San Francisco — top-decile yield for the area; either an underpriced asset or a hidden risk that comps aren't pricing in. Stress-test before assuming the spread holds.
Location & tenants
- Location reads 76/100 on livability (#90 in CA, #3,143 nationally) — a middle-class / working-renter tenant base. Strengths: amenities A+, commute A+, employment A+; Watch: crime F, cost of living F.
- San Francisco Unified (urban): math 50% / reading 56% proficiency, ranked #322 of 1,400 in CA (top 23%) — acceptable for families but not a draw, mixed tenant base, ~2y average lease.
- Zoned schools: Lilienthal (Claire) Elementary (669 students, 19% FRL); Giannini (A.P.) Middle (1,192 students, 34% FRL); Lowell High (2,632 students, 37% FRL) — zoned schools average 30% FRL vs 49% district-wide (19 pts lower); this property's tenant base skews higher-income than the district average.
- Market conditions: Rents rising fast (+14.1%/yr); 95 active listings in the ZIP; high-income renter base; 750 units permitted in San Francisco County in 2024 (688 in 5+ unit buildings).
- At $28,628/mo this rent would consume 172% of the median local household income ($199k/yr) (locally 865% of renters already pay >50% of income on rent) — very limited rent-growth headroom before tenants either downsize or default.
Forward outlook
- Local home prices are declining (-3.0%/yr); year-one equity from $24k of loan paydown is wiped out by about $104k of value loss. Plan a longer hold.
- San Francisco County population projected at +39% by 2050 — long-run rental-demand tailwind backs the buy-and-hold thesis.
Negotiation context
- It's been on market 26 days — a 2% lower offer ($3.43M) is reasonable based on typical stale-listing flexibility.
- 2 sale attempts with the ask held roughly flat each time — persistent listings suggest the price (not the market) is what's stuck; bring a comps-based counter.
Risks & watch-outs
- Watch-outs: built in 1910 — expect roof / HVAC / electrical / plumbing capex.
Questions for the listing agent
- What do current leases actually rent for vs. the listed asking? Can we see a recent rent roll and the last 12 months of T-12 income?
- Can we see the unit-by-unit rent roll, current vacancy, and any below-market leases? What's the average tenancy length?
- What capital expenditures (roof, boiler, parking lot, exteriors) have been made in the last 5 years, and what's planned in the next 2?
- Built in 1910 — when were the roof, HVAC, electrical panel, plumbing, and water heater last replaced?
- Is there a deadline driving the sale (1031 exchange, divorce, estate, relocation)? That informs how much negotiation room exists.
- Schools are B-rated — typically a magnet for longer-tenancy family renters. What's the average tenant stay here, and is there a school-zone premium baked into asking?
- Crime grade is F in this area — have there been break-ins, vandalism, or insurance claims at this property in the last 3 years? What carrier currently insures it and at what premium?
- The area grade is low — what's the realistic commute time and amenity access for the typical tenant pool here? Any planned neighborhood developments (good or bad) we should know about?
- What's the average days-on-market for RENTAL listings here right now (not sales)? A rising rental-DOM trend means longer vacancies and softer asking-rent achievability than the comps imply.
- What's the recent tenant-quality profile in this submarket — average credit score on applications, eviction rate, late-payment / NSF rate, and stable-employment percentage? A property-management company in the area should have these aggregated.
- How much new apartment / multifamily construction is in the pipeline within 1–3 miles? Heavy new supply (>2% of stock underway) typically softens rents 12–24 months out; light construction supports rent growth.
Investment metrics
- 1% rule
- 0.82% ✗
- Cap rate
- 5.80%
- Cash-on-cash
- -1.77%
- DSCR
- 0.92
- GRM
- 10.1
CMA / ARV
- ARV (on-the-fly)
- $2,005,150
- Comps found
- 1
Show comp detail 1 sale within ~0.75 mi
| Address | Dist | Beds/Ba | Sqft | Sold | Price | $/sf | Match |
|---|---|---|---|---|---|---|---|
| 1415-1417 Guerrero St | 0.44mi | 12/6.0 | 5,346 (-10%) | 2mo | $1,800,000 | $337 | 61 |
Match score weights: distance 35% · size 25% · config 20% · recency 20%. Top-matched comps best support the ARV.
Projected returns pro-forma
-3.0% appreciation · 8.0% rent growth · sell at horizon
- IRR
- -13.8%
- Equity multiple
- 0.48×
- Total profit
- $-503,478
- Equity at exit
- $518,879
- IRR
- 1.6%
- Equity multiple
- 1.14×
- Total profit
- $134,375
- Equity at exit
- $300,887
Cash invested: $974,400 (down + closing). Projections, not guarantees.
Landlord ↔ Tenant lean methodology
- Overall (CITY)
- 0 Strongly Tenant-Friendly
- State California
- 18 Strongly Tenant-Friendly · D+13
- County
- — inherits STATE
- City San Francisco
- 0 Strongly Tenant-Friendly · D+57
ZIP-level market 94131
- Rents YoY
- 14.1%
- Active inventory
- 95
- Price-to-rent
- 62.2×
Monthly cashflow live
- Estimated rent
- $28,628 high interval (Pro) →
- Mortgage (P&I)
- −$18,249
- Tax est. 1.5%
- −$4,350 /mo · $52,200/yr
- Insurance
- −$1,450
- HOA
- −$0
- Vacancy / Maint / Mgmt
- −$6,012
- Net cashflow
- $-1,433
Break-even live
Sensitivity live
| Price | -10% $972 | -5% $-231 | +0% $-1,433 | +5% $-2,636 | +10% $-3,838 |
|---|---|---|---|---|---|
| Rent | -10% $-3,695 | -5% $-2,564 | +0% $-1,433 | +5% $-303 | +10% $828 |
| Rate | -1.0pp $319 | -0.5pp $-548 | base $-1,433 | +0.5pp $-2,335 | +1.0pp $-3,253 |
6-unit breakdown (identical units grouped — click to expand)
| Units | Beds | Baths | Est. rent |
|---|---|---|---|
| 5× units | 2 | 1 | $23,315 |
| #1 | 2 | 1 | $4,663 |
| #2 | 2 | 1 | $4,663 |
| #3 | 2 | 1 | $4,663 |
| #4 | 2 | 1 | $4,663 |
| #5 | 2 | 1 | $4,663 |
| 1× unit | 3 | 1 | $5,315 |
| Total (6 units) | $28,628 | ||
UW: 25.0% down · 7.5% · 30yr · 1.5% tax · 5.0% vac · 8.0% maint · 8.0% mgmt
Financing live
Cash to close
- Down payment
- $870,000
- Closing costs
- $104,400
- Reserves months
- —
- Total cash needed
- —
Loan-product check · same deal, 3 products live
Conventional
25% down · 7.5% · 30yr
- Down + closing
- —
- Monthly P&I
- —
- Monthly cashflow
- —
- DSCR
- —
- Eligible?
- —
Personal DTI + credit; lowest rate.
DSCR
20% down · 8.5% · 30yr
- Down + closing
- —
- Monthly P&I
- —
- Monthly cashflow
- —
- DSCR
- —
- Eligible?
- —
No personal income docs; deal must DSCR.
Hard money
10% down · 12.0% · 12mo
- Down + closing
- —
- Monthly P&I
- —
- Monthly cashflow
- —
- DSCR
- —
- Eligible?
- —
Short-term bridge; refi at stabilization.
Listing history 17 events
-
2026-06-21days on market $3,480,000 Active 26 DOM
-
2026-06-18days on market $3,480,000 Active 23 DOM
-
2026-06-17days on market $3,480,000 Active 22 DOM
-
2026-06-16days on market $3,480,000 Active 21 DOM
-
2026-06-15days on market $3,480,000 Active 20 DOM
-
2026-06-13days on market $3,480,000 Active 18 DOM
-
2026-06-13days on market $3,480,000 Active 17 DOM
-
2026-06-09days on market $3,480,000 Active 14 DOM
-
2026-06-08days on market $3,480,000 Active 13 DOM
-
2026-06-07days on market $3,480,000 Active 12 DOM
-
2026-06-04days on market $3,480,000 Active 9 DOM
-
2026-06-03days on market $3,480,000 Active 8 DOM
-
2026-06-02days on market $3,480,000 Active 7 DOM
-
2026-06-01days on market $3,480,000 Active 6 DOM
-
2026-05-31days on market $3,480,000 Active 5 DOM
-
2026-05-26$3,480,000 Active 736-char remark
Show marketing remark (736 chars)
282 Valley Street presents a rare opportunity to acquire a premier 6-unit apartment building in the heart of Noe Valley, one of San Francisco's most sought-after neighborhoods. Comprised of (5) spacious 2-bedroom / 1-bath units and (1) oversized 3-bedroom / 1-bath unit, the property offers an attractive in-place 5.09% CAP rate with a clear path to approximately 9.00% CAP through continued rent growth and operational optimization. Positioned on the coveted Sanchez Slow street with exceptional walkability to 24th Streets shops, restaurants, transit, and neighborhood amenities, 282 Valley Street offers investors immediate cash flow today with substantial long-term upside in one of San Francisco's strongest multifamily submarkets.
ⓘ Source: listings_history table (triggers on properties + properties_extension) + one-shot
backfill from property_details.listing_events for pre-trigger history.
Climate risk First Street
- Flood 1/10 Low FEMA zone X (unshaded) · 0% chance over 30 yrs
- Wildfire 1/10 Low
- Heat 2/10 Low 8 d/yr ≥78°F today · 19 d/yr by 30 yrs out
- Wind 1/10 Low
- Air quality 7/10 Severe 13 unhealthy d/yr today · 13 by 30 yrs out
Nearby sold comps map
Loading sold comps map…
Walkable amenities ~0.75 mi
Loading nearby amenities…
Taxation est. · year 1
- Rental income
- $343,536
- − Mortgage interest
- −$194,934
- − Property taxes
- −$52,200
- − Insurance
- −$17,400
- − Repairs & maintenance
- −$27,483
- − Management
- −$27,483
- − Depreciation
- −$101,236
- Taxable loss
- −$77,200
- Est. tax savings @ 24.0%
- +$18,528
- After-tax cash flow
- $1,328/yr
For passive investors: Depreciation is non-cash, so a rental often shows a tax loss while cash-flowing — sheltering income. Rental losses are passive: they offset passive income freely, and up to $25,000/yr can offset ordinary (W-2) income if you actively participate and your MAGI is under $100k (phasing out to $0 by $150k); unused losses carry forward. On sale, claimed depreciation is recaptured at up to 25%, and gains may owe capital-gains tax (a 1031 exchange can defer both). Figures are a year-1 estimate at your 24.0% rate — not tax advice; consult a CPA.
Condition & rehab AI · 12 photos
This 6-unit apartment building in Noe Valley, San Francisco, is in good condition with minimal repairs needed. It offers a great investment opportunity with a strong CAP rate and potential for further rent growth.
Value-add opportunities
- Both Paint exterior — Fresh paint enhances curb appeal and property value.
- Both Clean windows — Clean windows improve natural light and property value.
- Both Update flooring — Fresh hardwood flooring enhances the aesthetic and value of the property.
- Both Update kitchen appliances — Modern appliances improve functionality and appeal to potential buyers/renters.
- Both Paint interior walls — Fresh paint enhances the aesthetic and value of the property.
- Both Update bathrooms — Modern bathrooms improve functionality and appeal to potential buyers/renters.
- Both Landscaping — A well-maintained landscape enhances curb appeal and property value.
Renovation cost estimate screening
Value-add ROI direction
- Both Paint exterior — Fresh paint enhances curb appeal and property value. ↑
- Both Clean windows — Clean windows improve natural light and property value. ↑
- Both Update flooring — Fresh hardwood flooring enhances the aesthetic and value of the property. ↑
- Both Update kitchen appliances — Modern appliances improve functionality and appeal to potential buyers/renters. ↑
- Both Paint interior walls — Fresh paint enhances the aesthetic and value of the property. ↑
- Both Update bathrooms — Modern bathrooms improve functionality and appeal to potential buyers/renters. ↑
- Both Landscaping — A well-maintained landscape enhances curb appeal and property value. ↑
ⓘ Cost ranges are severity-bucket heuristics (US national rule-of-thumb). Get contractor quotes + a written scope before underwriting a rehab budget.
Schools (NCES district)
- District
- San Francisco Unified
- NCES district ID
- 0634410
- Math proficiency
- 50% ▬ 0.00%
- Reading proficiency
- 56% ▲ 1.00%
- Median HH income
- $81,249
- Composite
- 50.14/100
- National rank
- #4088
- State rank
- #322 of 1400 in CA
Livability — San Francisco
- Score
- 76/100
- State rank
- #90
- US rank
- #3143
Category grades
Schools grade is shown separately in the Schools card above.
Census & demographics
- Census place
- San Francisco, CA
- County
- San Francisco County · 827,552 people
- City population
- 827,552
- Metro
- San Francisco-Oakland-Berkeley, CA
- Population (ZIP)
- 28,504
- Household income
- $199,211
- Rent vs Own
- Severe rent burden
- 865.0
Population outlook (San Francisco County) Hauer SSP2
- Today (2025)
- 1,030,936 people
- By 2030
- 1,110,409 · +7.7%
- By 2040
- 1,270,010 · +23.2%
- By 2050
- 1,435,001 · +39.2%
- By 2075
- 1,779,074 · +72.6%
- By 2100
- 1,966,767 · +90.8%
Race, ethnicity, and origin ACS 2023
- Neighborhood character
- Diverse neighborhood (Simpson 0.66)
- Race & ethnicity
- White 51% Asian 23% Hispanic / Latino 13% Two or more races 13% Black 4%
- Hispanic origin (detail)
- Mexican 6%
- Common ancestry
- Lithuanian 4% Italian 4% Scotch-Irish 3%
- Foreign-born
- 25% · China, Canada, South Korea
- Languages at home
- 72% English-only · Chinese 8% Spanish 8% Other Indo-European 4%
Political lean MEDSL · San Francisco
- 2024 margin
- Solid D (+64.8) · D 80.3% · R 15.5% · Other 4.1%
- 2008→2024 swing
- -5.7pp toward R · 2008: 70.5pp · 2024: 64.8pp
- All cycles
- 2024: D+64.8 2020: D+72.5 2016: D+76.1 2012: D+70.2 2008: D+70.5
Not yet ingested
- Civics
- —
Market trends
- HPI YoY
- ▼ -1249.94%
- Current HPI
- 268.447
- Rent YoY
- ▲ 14.12%
- Metro
- San Francisco-Oakland-Berkeley, CA
- State GDP YoY
- ▲ 3.21%
- F500 in state
- 116
Industry mix (Fortune 500 HQ in CA)
| Industry | F500 HQs | Revenue |
|---|---|---|
| Technology | 27 | $1,492B |
|
||
| Financial Services | 3 | $174B |
|
||
| Retail | 3 | $44B |
|
||
| Insurance | 3 | $26B |
|
||
| Media / Entertainment | 2 | $115B |
|
||
| Pharmaceuticals / Biotech | 2 | $62B |
|
||
Price history
+0.0% since first listed2 events — show timeline
- 2026-05-26 Listed $3,480,000 MLSListings
- 2026-05-26 Listed $3,480,000 bridgeMLS, Bay East AOR, or Contra Costa AOR
Cash-flow waterfall
monthlySold comps — $/sqft
last 12 mo · ≤1 miLoading sold comps…