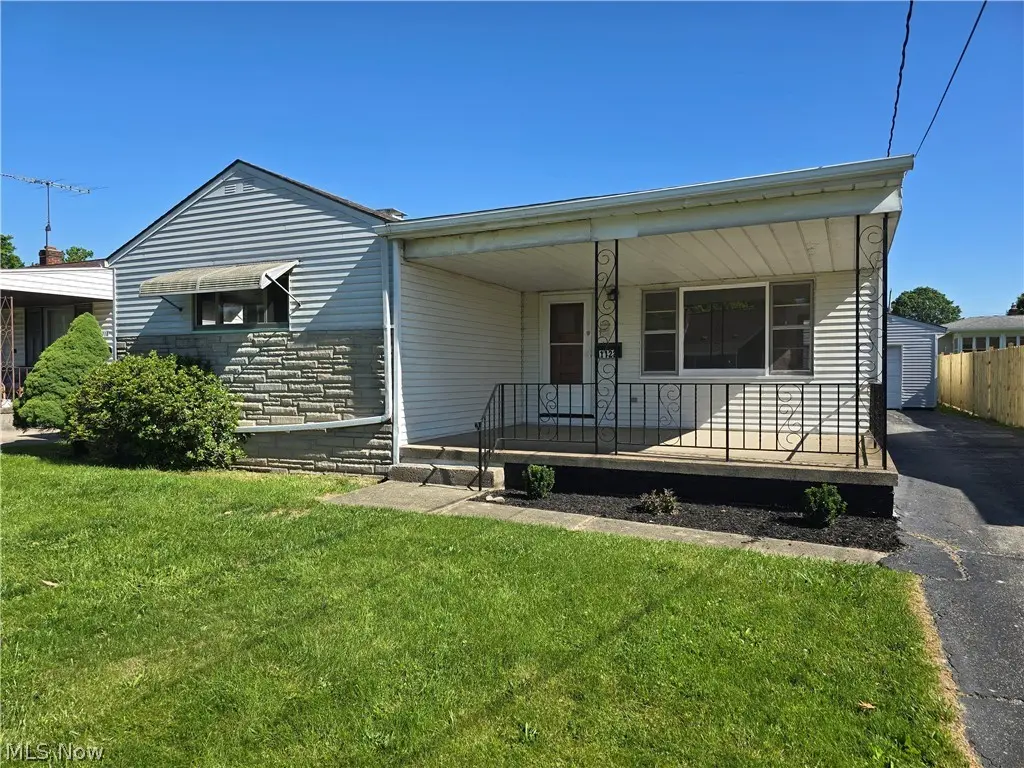
1122 Detroit Ave · Youngstown, OH
Flood risk 1/10 · Minimal
- FEMA flood zone
- X (unshaded)
- Chance of flooding over 30 yrs
- 0.0%
- Est. flood insurance / yr
- $473 – $860
Fire risk 1/10 · Minimal
- Est. fire insurance / yr
- $713 – $1,323
Heat risk 3/10 · Minor
- Hot days now (above 97°F)
- 7 days/yr
- Hot days in 30 yrs
- 17 days/yr
Wind risk 1/10 · Minimal
- Chance of severe wind over 30 yrs
- —
Air-quality risk 3/10 · Minor
- Unhealthy air days now
- 1 days/yr
- Unhealthy air days in 30 yrs
- 4 days/yr
Risk factors via First Street. Map © Google.
Why this score? — see what drove the C- grade
The composite is a weighted blend of 9 inputs, each scored 0–100. Each bar is that input's sub-score; the figure is the points it added to the 100-point composite (weight × sub-score).
- Cash flow +23.6/30.0
- DSCR +7.6/10.0
- Appreciation +5.9/10.0
- 1% rule +4.9/10.0
- Livability +4.0/5.0
- Rent growth +2.5/5.0
- Condition / age +2.5/5.0
- Schools +0.9/10.0
- ARV discount +0.0/15.0
$125,000
🖨 Deal sheet 📄 Offer letter ✓ Due diligence
Listing remarks
Move in ready home on the city's Southside. This three-bedroom ranch features a spacious eat in kitchen. Hardwood floors extend from the living room into all three bedrooms. Fully repainted basement ready to make into added living space. The roof is approximately 6 years old. Relax on the front porch, or head to the backyard and enjoy the detached garage, which features a fantastic, covered patio extension for summer BBQs, outdoor dining, and entertaining rain or shine.
Key facts
- Eat in kitchen
- Hardwood floors
- Detached garage
Tags
Property features AI
Exterior
- Parking: Detached garage and driveway (1 garage space)
- Utilities: Public water service; Public sewer service
- Home design: Single-story home
- Construction: Aluminum siding; Asphalt roof; Home warranty included; Built year from public records
- Exterior features: Public water; Public sewer
Interior
- Kitchen: Eat-in kitchen with ceramic tile flooring (18 x 9)
- Bedrooms: Three main-level bedrooms; Bedroom with wood flooring (9 x 9); Bedroom with wood flooring (11 x 9); Third bedroom/room with wood flooring (13 x 11)
- Flooring: Wood flooring in main living areas and bedrooms; Ceramic tile in kitchen and bathroom
- Bathrooms: One full bathroom (main level) with ceramic tile flooring
- Heating & cooling: Forced-air gas heating
- Interior features: Unfinished basement
Neighborhood map
What this means for you Summary
Snapshot
- This is a 3-bed/1.0-bath single-family listed at $125k.
Deal economics
- At list price, monthly cash flow is $236 ($3k/yr) — positive.
- The deal already cash-flows at list — no discount required.
- To meet the 1% rule (rent ≥ 1% of price), the offer needs to be $124k (1.0% below list).
- Recommended offer: $124k (1.0% below list) — sets the bar for 1% rule.
- Cap rate 8.6% vs local median 7.0% in Youngstown — meaningfully above typical; check what's discounted (condition, days-on-market, listing class) to confirm the premium yield is real.
Location & tenants
- Location reads 81/100 on livability (#99 in OH, #1,506 nationally) — a professional / high-income tenant draw. Strengths: amenities A+, commute A+, cost of living A+; Watch: crime F, employment F.
- Youngstown City (urban): math 8% / reading 17% proficiency, ranked #649 of 656 in OH (top 99%) — low school quality limits family demand, transient renter base, plan for 1-2y turnover; 88% free/reduced lunch — lower-income household profile, screen leases tightly.
- Market conditions: 45 active listings in the ZIP; 8 comparable units currently listed for rent nearby; rentals at typical pace (median 21d on market — plan ~3-4 weeks tenant-placement turnaround); lower-income renter base — watch delinquency; 147 units permitted in Mahoning County in 2024 (0 in 5+ unit buildings).
- At $1,237/mo this rent would consume 48% of the median local household income ($31k/yr) (locally 566% of renters already pay >50% of income on rent) — very limited rent-growth headroom before tenants either downsize or default.
Forward outlook
- In year one you build about $3k of equity ($864 loan paydown + $2k appreciation (1.8% local appreciation)).
- Mahoning County population projected at -14% by 2050 — secular population decline; favor cash flow + early exit over multi-decade hold.
- At projected returns (1.8% appreciation + 3.0% rent growth), your $35k cash investment doubles in ~6 years — after that, you're playing with house money.
- By year 10, paydown + projected appreciation supports a ~$30k cash-out refi (75% LTV) — recoverable capital for the next deal without selling this one.
Negotiation context
- Only 3 days on market — expect competitive offers; lowballing is unlikely to land.
- 4 sale attempts since 22y ago with the ask held roughly flat each time — persistent listings suggest the price (not the market) is what's stuck; bring a comps-based counter.
- Current owner paid $55k; list at $125k implies a 128% gain — meaningful room to come down on a strong offer.
Risks & watch-outs
- Watch-outs: built in 1959 — expect roof / HVAC / electrical / plumbing capex.
Questions for the listing agent
- Built in 1959 — when were the roof, HVAC, electrical panel, plumbing, and water heater last replaced?
- Is there a deadline driving the sale (1031 exchange, divorce, estate, relocation)? That informs how much negotiation room exists.
- Crime grade is F in this area — have there been break-ins, vandalism, or insurance claims at this property in the last 3 years? What carrier currently insures it and at what premium?
- What's the average days-on-market for RENTAL listings here right now (not sales)? A rising rental-DOM trend means longer vacancies and softer asking-rent achievability than the comps imply.
- What's the recent tenant-quality profile in this submarket — average credit score on applications, eviction rate, late-payment / NSF rate, and stable-employment percentage? A property-management company in the area should have these aggregated.
- How much new for-sale + rental construction is in the pipeline within 1–3 miles? Heavy new supply typically softens prices + rents 12–24 months out; constrained supply supports both.
Investment metrics
- 1% rule
- 0.99% ✗
- Cap rate
- 8.56%
- Cash-on-cash
- 8.08%
- DSCR
- 1.36
- GRM
- 8.4
CMA / ARV
- ARV (on-the-fly)
- $97,092
- Comps found
- 12
Show comp detail 12 sales within ~0.75 mi
| Address | Dist | Beds/Ba | Sqft | Sold | Price | $/sf | Match |
|---|---|---|---|---|---|---|---|
| 1146 Detroit Ave | 0.06mi | 3/2.0 | 1,042 (-0%) | 12mo | $115,360 | $111 | 83 |
| 1321 Detroit Ave | 0.12mi | 3/2.0 | 1,001 (-4%) | 2mo | $60,000 | $60 | 82 |
| 2692 Taft Ave | 0.49mi | 3/1.0 | 990 (-5%) | 3mo | $30,000 | $30 | 66 |
| 3222 Sheridan Rd | 0.66mi | 3/1.0 | 1,008 (-3%) | 6mo | $110,000 | $109 | 59 |
| 1641 Medford Ave | 0.75mi | 3/1.0 | 1,040 (-0%) | 10mo | $115,500 | $111 | 56 |
| 2804 Jean St | 0.36mi | 4/1.5 (+1) | 924 (-12%) | 4mo | $85,500 | $93 | 54 |
| 1562 Medford Ave | 0.65mi | 3/1.0 | 1,170 (+12%) | 3mo | $129,156 | $110 | 47 |
| 808 Marmion Ave | 0.54mi | 2/1.5 (-1) | 928 (-11%) | 4mo | $96,600 | $104 | 46 |
| 3332 Sheridan Rd | 0.59mi | 2/1.0 (-1) | 924 (-12%) | 3mo | $56,005 | $61 | 46 |
| 1646 Everett Ave | 0.64mi | 4/1.0 (+1) | 1,152 (+10%) | 3mo | $100,000 | $87 | 45 |
| 834 Compton Ln | 0.73mi | 3/1.5 | 888 (-15%) | 5mo | $83,000 | $93 | 35 |
| 603 E Indianola Ave | 0.74mi | 4/2.0 (+1) | 1,196 (+15%) | 8mo | $45,000 | $38 | 25 |
Match score weights: distance 35% · size 25% · config 20% · recency 20%. Top-matched comps best support the ARV.
Projected returns pro-forma
1.78% appreciation · 3.0% rent growth · sell at horizon
- IRR
- 11.9%
- Equity multiple
- 1.63×
- Total profit
- $22,118
- Equity at exit
- $47,800
- IRR
- 14.8%
- Equity multiple
- 2.94×
- Total profit
- $67,973
- Equity at exit
- $67,695
Cash invested: $35,000 (down + closing). Projections, not guarantees.
Landlord ↔ Tenant lean methodology
- Overall (STATE)
- 73 Landlord-Friendly
- State Ohio
- 73 Landlord-Friendly · R+6
- County
- — inherits STATE
- City
- — inherits STATE
ZIP-level market 44502
- Home prices YoY
- 0.7%
- Active inventory
- 45
- Price-to-rent
- 8.4×
Monthly cashflow live
- Estimated rent
- $1,237 high interval (Pro) →
- Mortgage (P&I)
- −$656
- Tax from tax record
- −$34 /mo · $407/yr
- Insurance
- −$52
- HOA
- −$0
- Vacancy / Maint / Mgmt
- −$260
- Net cashflow
- $236
Break-even live
UW: 25.0% down · 7.5% · 30yr · 1.5% tax · 5.0% vac · 8.0% maint · 8.0% mgmt
Financing live
Cash to close
- Down payment
- $31,250
- Closing costs
- $3,750
- Reserves months
- —
- Total cash needed
- —
Loan-product check · same deal, 3 products live
Conventional
25% down · 7.5% · 30yr
- Down + closing
- —
- Monthly P&I
- —
- Monthly cashflow
- —
- DSCR
- —
- Eligible?
- —
Personal DTI + credit; lowest rate.
DSCR
20% down · 8.5% · 30yr
- Down + closing
- —
- Monthly P&I
- —
- Monthly cashflow
- —
- DSCR
- —
- Eligible?
- —
No personal income docs; deal must DSCR.
Hard money
10% down · 12.0% · 12mo
- Down + closing
- —
- Monthly P&I
- —
- Monthly cashflow
- —
- DSCR
- —
- Eligible?
- —
Short-term bridge; refi at stabilization.
Rent comps 8 comps
| Address | Beds | Baths | Sqft | Rent | $/sqft | DOM | Units | Dist |
|---|---|---|---|---|---|---|---|---|
| 3446 Ambert Ave Youngstown, OH | 4.0 | 1.0 | 1100 | $1,250 | $1.14 | 13d | 1 | 0.48mi |
| 1803 Pointview Ave Youngstown, OH | 2.0 | 1.0 | 950 | $1,000 | $1.05 | 43d | 1 | 0.64mi |
| 512 E Philadelphia Ave Unit 1 Youngstown, OH | 2.0 | 1.0 | 1200 | $899 | $0.75 | 20d | 1 | 0.70mi |
| 1914 S Heights Ave Youngstown, OH | 3.0 | 1.0 | 1115 | $1,950 | $1.75 | 43d | 1 | 0.74mi |
| 236 Hilton Ave Youngstown, OH | 4.0 | 1.5 | 1488 | $1,195 | $0.80 | 20d | 1 | 0.97mi |
| 610 Elm St Struthers, OH | 3.0 | 1.0 | 1050 | $1,500 | $1.43 | 13d | 1 | 1.26mi |
| 2523 E Midlothian Blvd Apt 5 Struthers, OH | 2.0 | 1.0 | 750 | $800 | $1.07 | 13d | 1 | 1.31mi |
| 4322 Southern Blvd Youngstown, OH | 2.0 | 1.0 | 1000 | $875 | $0.88 | 13d | 1 | 1.50mi |
Listing history 4 events
-
2026-06-09status $125,000 Pending 3 DOM
-
2026-06-08days on market $125,000 Active 3 DOM
-
2026-06-07remarks 474-char remark
-
2026-06-07$125,000 Active 2 DOM
ⓘ Source: listings_history table (triggers on properties + properties_extension) + one-shot
backfill from property_details.listing_events for pre-trigger history.
Tax reassessment forecast OH · Partial reset (capped growth)
- Current annual tax
- $407 · $34/mo
- Projected year-2 tax
- $1,179 · $98/mo
- Expected delta
- +$771/yr (+$64/mo · 189.5%)
ⓘ Screening estimate from a state-policy table — verify with the county assessor before closing.
Climate risk First Street
- Flood 1/10 Low FEMA zone X (unshaded) · 0% chance over 30 yrs
- Wildfire 1/10 Low
- Heat 3/10 Moderate 7 d/yr ≥97°F today · 17 d/yr by 30 yrs out
- Wind 1/10 Low
- Air quality 3/10 Moderate 1 unhealthy d/yr today · 4 by 30 yrs out
Nearby sold comps map
Loading sold comps map…
Walkable amenities ~0.75 mi
Loading nearby amenities…
Taxation est. · year 1
- Rental income
- $14,845
- − Mortgage interest
- −$7,002
- − Property taxes
- −$407
- − Insurance
- −$625
- − Repairs & maintenance
- −$1,188
- − Management
- −$1,188
- − Depreciation
- −$3,636
- Taxable income
- $800
- Est. tax owed @ 24.0%
- −$192
- After-tax cash flow
- $2,638/yr
For passive investors: Depreciation is non-cash, so a rental often shows a tax loss while cash-flowing — sheltering income. Rental losses are passive: they offset passive income freely, and up to $25,000/yr can offset ordinary (W-2) income if you actively participate and your MAGI is under $100k (phasing out to $0 by $150k); unused losses carry forward. On sale, claimed depreciation is recaptured at up to 25%, and gains may owe capital-gains tax (a 1031 exchange can defer both). Figures are a year-1 estimate at your 24.0% rate — not tax advice; consult a CPA.
Schools (NCES district)
- District
- Youngstown City
- NCES district ID
- 3904516
- Math proficiency
- 8% ▼ -15.00%
- Reading proficiency
- 17% ▼ -10.00%
- Median HH income
- $25,257
- Composite
- 9.29/100
- National rank
- #9858
- State rank
- #649 of 656 in OH
Livability — Youngstown
- Score
- 81/100
- State rank
- #99
- US rank
- #1506
Category grades
Schools grade is shown separately in the Schools card above.
Census & demographics
- Census place
- Youngstown, OH
- County
- Mahoning County · 84,956 people
- City population
- 28,503
- Metro
- Youngstown-Warren-Boardman, OH-PA
- Population (ZIP)
- 9,594
- Household income
- $31,170
- Rent vs Own
- Severe rent burden
- 566.0
Population outlook (Mahoning County) Hauer SSP2
- Today (2025)
- 223,932 people
- By 2030
- 218,387 · -2.5%
- By 2040
- 205,367 · -8.3%
- By 2050
- 193,606 · -13.5%
- By 2075
- 173,694 · -22.4%
- By 2100
- 151,147 · -32.5%
Race, ethnicity, and origin ACS 2023
- Neighborhood character
- Diverse neighborhood (Simpson 0.67)
- Race & ethnicity
- White 44% Black 35% Two or more races 12% Hispanic / Latino 11%
- Hispanic origin (detail)
- Mexican 1% Puerto Rican 9%
- Common ancestry
- Romanian 2% Serbian 1% Iranian 1%
- Foreign-born
- 4% · Canada
- Languages at home
- 91% English-only · Spanish 6% Other Indo-European 1% Arabic 1%
Political lean MEDSL · Mahoning
- 2024 margin
- Lean R (+9.4) · D 44.9% · R 54.4%
- 2008→2024 swing
- -36.1pp toward R · 2008: 26.6pp · 2024: -9.4pp
- All cycles
- 2024: R+9.4 2020: R+1.9 2016: D+3.0 2012: D+27.7 2008: D+26.6
Not yet ingested
- Civics
- —
Market trends
- HPI YoY
- ▲ 1.78%
- Current HPI
- 246.2163
- Rent YoY
- —
- Metro
- Youngstown-Warren-Boardman, OH-PA
- State GDP YoY
- ▲ 1.98%
- F500 in state
- 48
Industry mix (Fortune 500 HQ in OH)
| Industry | F500 HQs | Revenue |
|---|---|---|
| Insurance | 3 | $145B |
|
||
| Industrial Machinery | 3 | $49B |
|
||
| Financial Services | 3 | $24B |
|
||
| Consumer Goods | 2 | $93B |
|
||
| Aerospace / Defense | 2 | $47B |
|
||
| Utilities | 2 | $33B |
|
||
Price history
+108.7% since first listed8 events — show timeline
- 2026-06-05 Listed $125,000 MLSNOW
- 2013-08-26 Listing Removed — MLSNOW
- 2013-03-25 Listed $54,900 MLSNOW
- 2006-02-07 Sold (Public Records) $54,900 Public Records
- 2005-09-25 Listing Removed — MLSNOW
- 2004-09-25 Listed $57,000 MLSNOW
- 2004-09-24 Listing Removed — MLSNOW
- 2004-06-24 Listed $59,900 MLSNOW
Property tax history
+3.8%/yrLatest (2025): $407 · -11.8% YoY. Source: county tax records.
Cash-flow waterfall
monthlySold comps — $/sqft
last 12 mo · ≤1 miLoading sold comps…