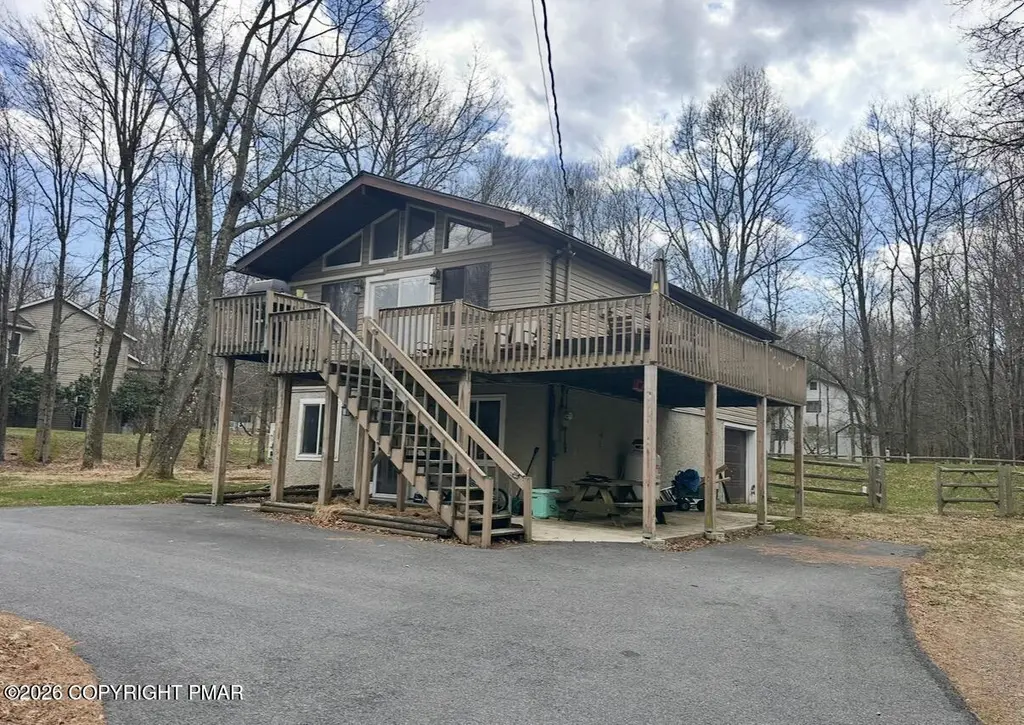
711 S Old Stage Rd · Towamensing Trails, PA
Flood risk 1/10 · Minimal
- FEMA flood zone
- X (unshaded)
- Chance of flooding over 30 yrs
- 0.0%
- Est. flood insurance / yr
- $507 – $1,088
Fire risk 3/10 · Minor
- Est. fire insurance / yr
- $511 – $949
Heat risk 2/10 · Minimal
- Hot days now (above 90°F)
- 7 days/yr
- Hot days in 30 yrs
- 15 days/yr
Wind risk 4/10 · Minor
- Chance of severe wind over 30 yrs
- 8.0%
Air-quality risk 2/10 · Minimal
- Unhealthy air days now
- 1 days/yr
- Unhealthy air days in 30 yrs
- 2 days/yr
Risk factors via First Street. Map © Google.
Why this score? — see what drove the D grade
The composite is a weighted blend of 9 inputs, each scored 0–100. Each bar is that input's sub-score; the figure is the points it added to the 100-point composite (weight × sub-score).
- ARV discount +15.0/15.0
- Cash flow +8.1/30.0
- Appreciation +3.6/10.0
- Schools +3.1/10.0
- Livability +3.1/5.0
- Rent growth +2.5/5.0
- Condition / age +2.5/5.0
- 1% rule +2.1/10.0
- DSCR +2.1/10.0
$255,000
🖨 Deal sheet 📄 Offer letter ✓ Due diligence
Listing remarks
Welcome to 711 Old Stage Road, a 4 bedroom, 2 bath raised ranch located in the highly desirable Towamensing Trails community. Just about a half mile from the lake, beach, and clubhouse, this home offers convenient access to all the best amenities in the Poconos. The interior features vaulted ceilings, hardwood floors, a well-appointed kitchen with stainless steel appliances, and a spacious family room with a propane fireplace. Step outside to a large wraparound upper deck and an expansive lower-level patio, ideal for entertaining or enjoying the mountain air. The property also offers plenty of outdoor space for games, gatherings, or evenings by the fire.
Key facts
- 0.48 acre lot
- Garage
- Community pool
Property features AI
Finance
- Other: Directions: From 903 S, left on Old Stage Road. Home will be on the right just past Penn Forest Trail.
- HOA & community: Homeowners association with clubhouse, playground, and pool; Annual association fee of $451 (about $37.58/month); Association fee includes trash service
Exterior
- Parking: 5 total parking spaces (1-car garage plus 4 open spaces); Private maintained paved road access
- Security: Smoke detectors
- Utilities: Water from well; Mound septic or septic tank
- Home design: Single-family house; 2 stories; No common walls; Residential zoning; Located in Towamensing Trails subdivision
- Construction: Vinyl siding
- Exterior features: Deck; Back yard fencing; Asphalt/fiberglass roof
Interior
- Kitchen: Electric range; Refrigerator; Dishwasher; Microwave; Stainless steel appliances
- Bedrooms: Total rooms: 9
- Flooring: Carpet; Hardwood; Laminate; Slate; Stone
- Bathrooms: 2 full bathrooms
- Heating & cooling: Electric heating; Ceiling fans
- Interior features: Cathedral ceilings; Double-pane windows; Unfurnished; Fireplace in family room
- Laundry & utility: Dryer included; Washer hookup; Electric dryer hookup; Water heater
Neighborhood map
What this means for you Summary
Snapshot
- This is a 2-bed/1.0-bath single-family listed at $255k.
Deal economics
- At list price, monthly cash flow is $-248 ($-3k/yr) — negative.
- To cash-flow at today's rent, offer at most $211k (17.2% below list).
- To meet the 1% rule (rent ≥ 1% of price), the offer needs to be $180k (29.3% below list).
- Recommended offer: $180k (29.3% below list) — sets the bar for 1% rule.
- Cap rate 5.1% vs local median 3.8% in Towamensing Trails — top-decile yield for the area; either an underpriced asset or a hidden risk that comps aren't pricing in. Stress-test before assuming the spread holds.
Location & tenants
- Location reads 62/100 on livability (#1,361 in PA) — a middle-class / working-renter tenant base. Strengths: crime A+, cost of living A+, housing B+; Watch: health & safety D, amenities F, commute F.
- Jim Thorpe Area SD (rural): math 25% / reading 47% proficiency, ranked #394 of 539 in PA (top 73%) — families likely to look elsewhere, expect single-tenant / working-renter base with shorter leases.
- Market conditions: 453 active listings in the ZIP; 180 units permitted in Carbon County in 2024 (10 in 5+ unit buildings).
Forward outlook
- Local home prices are declining (-2.9%/yr); year-one equity from $2k of loan paydown is wiped out by about $7k of value loss. Plan a longer hold.
- Carbon County population projected at -18% by 2050 — secular population decline; favor cash flow + early exit over multi-decade hold.
Negotiation context
- Only 5 days on market — expect competitive offers; lowballing is unlikely to land.
- 10 sale attempts since 17y ago with the ask held roughly flat each time — persistent listings suggest the price (not the market) is what's stuck; bring a comps-based counter.
- Current owner paid $159k; list at $255k implies a 60% gain — meaningful room to come down on a strong offer.
Questions for the listing agent
- What do current leases actually rent for vs. the listed asking? Can we see a recent rent roll and the last 12 months of T-12 income?
- Built in 1977 — when were the roof, HVAC, electrical panel, plumbing, and water heater last replaced?
- What does the HOA fee cover, when was the last increase, and are there any pending special assessments or reserve-fund shortfalls?
- Is there a deadline driving the sale (1031 exchange, divorce, estate, relocation)? That informs how much negotiation room exists.
- The area grade is low — what's the realistic commute time and amenity access for the typical tenant pool here? Any planned neighborhood developments (good or bad) we should know about?
- What's the average days-on-market for RENTAL listings here right now (not sales)? A rising rental-DOM trend means longer vacancies and softer asking-rent achievability than the comps imply.
- What's the recent tenant-quality profile in this submarket — average credit score on applications, eviction rate, late-payment / NSF rate, and stable-employment percentage? A property-management company in the area should have these aggregated.
- How much new for-sale + rental construction is in the pipeline within 1–3 miles? Heavy new supply typically softens prices + rents 12–24 months out; constrained supply supports both.
Investment metrics
- 1% rule
- 0.71% ✗
- Cap rate
- 5.12%
- Cash-on-cash
- -4.18%
- DSCR
- 0.81
- GRM
- 11.8
CMA / ARV
- ARV (median comp)
- $351,484
- List price
- $255,000
- Delta
- -27.45%
- Verdict
- UNDERPRICED
- Comps
- 20 within 1.0 mi
Show comp detail 9 sales within ~0.75 mi
| Address | Dist | Beds/Ba | Sqft | Sold | Price | $/sf | Match |
|---|---|---|---|---|---|---|---|
| 37 Wylie Cir | 0.14mi | 3/2.0 (+1) | 1,008 (+5%) | 1mo | $238,145 | $236 | 76 |
| 90 Masters Trl | 0.52mi | 2/1.0 | 960 (0%) | 10mo | $176,000 | $183 | 67 |
| 114 Maccauley Rd | 0.60mi | 3/1.0 (+1) | 960 (0%) | 2mo | $229,000 | $239 | 65 |
| 11 Mckinley Ln | 0.39mi | 3/2.0 (+1) | 960 (0%) | 18mo | $260,000 | $271 | 58 |
| 21 Horace Way | 0.53mi | 3/1.0 (+1) | 960 (0%) | 17mo | $250,000 | $260 | 56 |
| 9 Dobson Mews | 0.51mi | 3/1.0 (+1) | 960 (0%) | 19mo | $219,500 | $229 | 55 |
| 159 Penn Forest Trl | 0.33mi | 3/1.0 (+1) | 1,095 (+14%) | 6mo | $210,000 | $192 | 51 |
| 44 Hunt Trl | 0.48mi | 3/2.0 (+1) | 1,056 (+10%) | 14mo | $220,000 | $208 | 40 |
| 49 Parker Trl | 0.74mi | 2/2.0 | 1,010 (+5%) | 18mo | $128,625 | $127 | 37 |
Match score weights: distance 35% · size 25% · config 20% · recency 20%. Top-matched comps best support the ARV.
Projected returns pro-forma
-2.89% appreciation · 3.0% rent growth · sell at horizon
- IRR
- -22.5%
- Equity multiple
- 0.22×
- Total profit
- $-55,963
- Equity at exit
- $39,307
- IRR
- -16.8%
- Equity multiple
- 0.04×
- Total profit
- $-68,188
- Equity at exit
- $24,262
Cash invested: $71,400 (down + closing). Projections, not guarantees.
Landlord ↔ Tenant lean methodology
- Overall (STATE)
- 62 Landlord-Friendly
- State Pennsylvania
- 62 Landlord-Friendly · EVEN
- County
- — inherits STATE
- City
- — inherits STATE
ZIP-level market 18210
- Home prices YoY
- -1.4%
- Active inventory
- 453
- Price-to-rent
- 11.8×
Monthly cashflow live
- Estimated rent
- $1,804 medium interval (Pro) →
- Mortgage (P&I)
- −$1,337
- Tax from tax record
- −$192 /mo · $2,305/yr
- Insurance
- −$106
- HOA
- −$38
- Vacancy / Maint / Mgmt
- −$379
- Net cashflow
- $-248
Break-even live
UW: 25.0% down · 7.5% · 30yr · 1.5% tax · 5.0% vac · 8.0% maint · 8.0% mgmt
Financing live
Cash to close
- Down payment
- $63,750
- Closing costs
- $7,650
- Reserves months
- —
- Total cash needed
- —
Loan-product check · same deal, 3 products live
Conventional
25% down · 7.5% · 30yr
- Down + closing
- —
- Monthly P&I
- —
- Monthly cashflow
- —
- DSCR
- —
- Eligible?
- —
Personal DTI + credit; lowest rate.
DSCR
20% down · 8.5% · 30yr
- Down + closing
- —
- Monthly P&I
- —
- Monthly cashflow
- —
- DSCR
- —
- Eligible?
- —
No personal income docs; deal must DSCR.
Hard money
10% down · 12.0% · 12mo
- Down + closing
- —
- Monthly P&I
- —
- Monthly cashflow
- —
- DSCR
- —
- Eligible?
- —
Short-term bridge; refi at stabilization.
HOA detail
- Monthly dues
- $38 · $456/yr
Listing history 16 events
-
2026-05-04status Pending 662-char remark
-
2026-04-28$255,000 Active 662-char remark
-
2025-05-09$260,000 Active
-
2025-05-09$260,000 Active
-
2019-06-26soldstatus $159,000
-
2019-06-21soldstatus $159,000
-
2019-06-21soldstatus $159,000
-
2018-08-24$164,500
-
2018-08-23$164,500
-
2012-04-13soldstatus $84,000
-
2012-02-08$89,900
-
2011-05-31$95,000
-
2011-04-06$109,900
-
2009-03-24$133,000
-
2009-01-26$145,000
-
1998-06-25soldstatus $50,000
ⓘ Source: listings_history table (triggers on properties + properties_extension) + one-shot
backfill from property_details.listing_events for pre-trigger history.
Tax reassessment forecast PA · Partial reset (capped growth)
- Current annual tax
- $2,305 · $192/mo
- Projected year-2 tax
- $3,167 · $264/mo
- Expected delta
- +$862/yr (+$72/mo · 37.4%)
ⓘ Screening estimate from a state-policy table — verify with the county assessor before closing.
Climate risk First Street
- Flood 1/10 Low FEMA zone X (unshaded) · 0% chance over 30 yrs
- Wildfire 3/10 Moderate
- Heat 2/10 Low 7 d/yr ≥90°F today · 15 d/yr by 30 yrs out
- Wind 4/10 Moderate 8% chance of damaging wind over 30 yrs
- Air quality 2/10 Low 1 unhealthy d/yr today · 2 by 30 yrs out
Nearby sold comps map
Loading sold comps map…
Walkable amenities ~0.75 mi
Loading nearby amenities…
Taxation est. · year 1
- Rental income
- $21,648
- − Mortgage interest
- −$14,284
- − Property taxes
- −$2,305
- − Insurance
- −$1,275
- − Repairs & maintenance
- −$1,732
- − Management
- −$1,732
- − HOA
- −$456
- − Depreciation
- −$7,418
- Taxable loss
- −$7,554
- Est. tax savings @ 24.0%
- +$1,813
- After-tax cash flow
- $-1,168/yr
For passive investors: Depreciation is non-cash, so a rental often shows a tax loss while cash-flowing — sheltering income. Rental losses are passive: they offset passive income freely, and up to $25,000/yr can offset ordinary (W-2) income if you actively participate and your MAGI is under $100k (phasing out to $0 by $150k); unused losses carry forward. On sale, claimed depreciation is recaptured at up to 25%, and gains may owe capital-gains tax (a 1031 exchange can defer both). Figures are a year-1 estimate at your 24.0% rate — not tax advice; consult a CPA.
Schools (NCES district)
- District
- Jim Thorpe Area SD
- NCES district ID
- 4212540
- Math proficiency
- 25% ▼ -12.00%
- Reading proficiency
- 47% ▼ -11.00%
- Median HH income
- $53,476
- Composite
- 31.42/100
- National rank
- #5988
- State rank
- #394 of 539 in PA
Livability — Towamensing Trails
- Score
- 62/100
- State rank
- #1361
- US rank
- #16977
Category grades
Schools grade is shown separately in the Schools card above.
Census & demographics
- Census place
- Towamensing Trails, PA
- City population
- 7,879
- Population (ZIP)
- 7,879
Population outlook (Carbon County) Hauer SSP2
- Today (2025)
- 61,643 people
- By 2030
- 59,840 · -2.9%
- By 2040
- 55,413 · -10.1%
- By 2050
- 50,843 · -17.5%
- By 2075
- 43,326 · -29.7%
- By 2100
- 37,126 · -39.8%
Race, ethnicity, and origin ACS 2023
- Neighborhood character
- Predominantly White (69%)
- Race & ethnicity
- White 69% Hispanic / Latino 22% Two or more races 11% Black 6% Native American 1% Asian 1%
- Hispanic origin (detail)
- Puerto Rican 12% Cuban 2% Dominican 1%
- Common ancestry
- Romanian 8% Russian 4% Iranian 2%
- Foreign-born
- 12% · Canada
- Languages at home
- 81% English-only · Spanish 10% Russian/Polish/Slavic 7% Other Indo-European 1%
Political lean MEDSL · Carbon
- 2024 margin
- Solid R (+34.8) · D 32.2% · R 67.0%
- 2008→2024 swing
- -36.7pp toward R · 2008: 1.9pp · 2024: -34.8pp
- All cycles
- 2024: R+34.8 2020: R+32.0 2016: R+34.1 2012: R+6.9 2008: D+1.9
Not yet ingested
- Civics
- —
Market trends
- HPI YoY
- ▼ -2.89%
- Current HPI
- 203.8099
- Rent YoY
- —
- Metro
- —
- State GDP YoY
- ▲ 1.68%
- F500 in state
- 34
Industry mix (Fortune 500 HQ in PA)
| Industry | F500 HQs | Revenue |
|---|---|---|
| Healthcare | 2 | $309B |
|
||
| Insurance | 2 | $27B |
|
||
| Telecommunications / Media | 1 | $124B |
|
||
| Industrial Distribution | 1 | $22B |
|
||
| Financial Services | 1 | $20B |
|
||
| Chemicals / Materials | 1 | $18B |
|
||
Price history
+410.0% since first listed16 events — show timeline
- 2026-05-04 Pending — PMAR
- 2026-04-28 Listed $255,000 PMAR
- 2025-05-09 Listed $260,000 GLVRMLS
- 2025-05-09 Listed $260,000 PMAR
- 2019-06-26 Sold (Public Records) $159,000 Public Records
- 2019-06-21 Sold (MLS) $159,000 PMAR
- 2019-06-21 Sold (MLS) $159,000 GLVRMLS
- 2018-08-24 Listed $164,500 GLVRMLS
- 2018-08-23 Listed $164,500 PMAR
- 2012-04-13 Sold (MLS) $84,000 PMAR
- 2012-02-08 Listed $89,900 PMAR
- 2011-05-31 Listed $95,000 PMAR
- 2011-04-06 Listed $109,900 PMAR
- 2009-03-24 Listed $133,000 PMAR
- 2009-01-26 Listed $145,000 PMAR
- 1998-06-25 Sold (Public Records) $50,000 Public Records
Property tax history
+1.7%/yrLatest (2026): $2,305 · +5.4% YoY. Source: county tax records.
Cash-flow waterfall
monthlySold comps — $/sqft
last 12 mo · ≤1 miLoading sold comps…