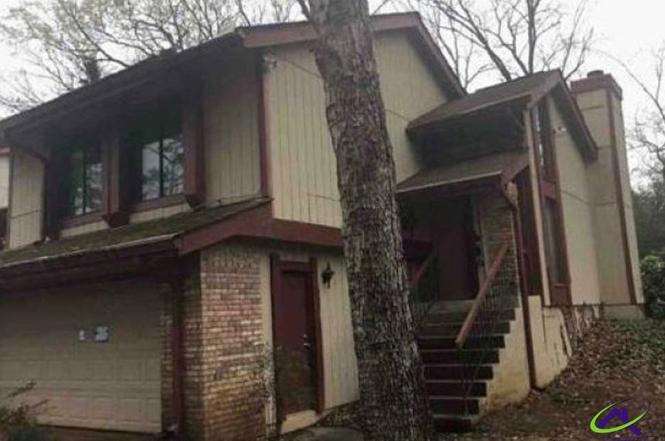
1159 Village Main St · Stone Mountain, GA
Flood risk No data
- FEMA flood zone
- —
- Chance of flooding over 30 yrs
- —
- Est. flood insurance / yr
- —
Fire risk No data
- Est. fire insurance / yr
- —
Heat risk No data
- Hot days now (above threshold)
- —
- Hot days in 30 yrs
- —
Wind risk No data
- Chance of severe wind over 30 yrs
- —
Air-quality risk No data
- Unhealthy air days now
- —
- Unhealthy air days in 30 yrs
- —
Risk factors via First Street. Map © Google.
Why this score? — see what drove the B- grade
The composite is a weighted blend of 9 inputs, each scored 0–100. Each bar is that input's sub-score; the figure is the points it added to the 100-point composite (weight × sub-score).
- Cash flow +30.0/30.0
- 1% rule +10.0/10.0
- DSCR +10.0/10.0
- ARV discount +7.5/15.0
- Livability +4.0/5.0
- Rent growth +3.4/5.0
- Condition / age +2.5/5.0
- Schools +2.1/10.0
- Appreciation +0.0/10.0
$105,600
🖨 Deal sheet (PDF) 📄 Offer letter ✓ Due diligence
Listing remarks
Offers to be placed on Xome.com. Interior inspections are not available, do not trespass! Forward all inquiries and questions to Xome Customer Service . NO REPRESENTATION TO VALIDITY OF INFORMATION IS MADE, BUYER TO VERIFY ALL INFORMATION WHERIN.
Key facts
- 1,306 sq ft lot
- 2 garage spots
- Built 1974
Property features AI
Exterior
- Parking: 2 total parking spaces; 2 covered parking spaces; 2-car garage
- Utilities: Sewer: Unknown
- Home design: Single-family residence; Residential property
- Construction: Slab foundation; Above-grade finished area: 1,607 (square feet)
- Exterior features: No pool
Interior
- Bathrooms: Two full bathrooms; One half bathroom
- Heating & cooling: Has heating (see remarks)
- Interior features: Fireplace (1)
Neighborhood map
What this means for you Summary
Snapshot
- This is a 3-bed/2.5-bath single-family listed at $106k.
Deal economics
- At list price, monthly cash flow is $717 ($9k/yr) — positive.
- The deal already cash-flows at list — no discount required.
- Meets the 1% rule at list price ($2k rent vs $106k).
- Cap rate 14.4% vs local median 5.1% in Stone Mountain — top-decile yield for the area; either an underpriced asset or a hidden risk that comps aren't pricing in. Stress-test before assuming the spread holds.
Location & tenants
- Location reads 79/100 on livability (#11 in GA, #1,977 nationally) — a middle-class / working-renter tenant base. Strengths: commute A+, cost of living A+, housing A+; Watch: employment D+, schools F, crime F.
- Dekalb County (suburban): math 19% / reading 28% proficiency, ranked #125 of 174 in GA (top 72%) — low school quality limits family demand, transient renter base, plan for 1-2y turnover; 68% free/reduced lunch — lower-income household profile, screen leases tightly.
- Market conditions: Rents rising (+3.7%/yr); 215 active listings in the ZIP; 40 comparable units currently listed for rent nearby; rentals at typical pace (median 16d on market — plan ~3-4 weeks tenant-placement turnaround); 1,240 units permitted in DeKalb County in 2024 (385 in 5+ unit buildings).
- This rent runs 31% of the median local income ($70k/yr) — at the standard rent-burdened threshold; future hikes will face affordability resistance.
Forward outlook
- Local home prices are declining (-3.0%/yr); year-one equity from $730 of loan paydown is wiped out by about $3k of value loss. Plan a longer hold.
- DeKalb County population projected at +28% by 2050 — long-run rental-demand tailwind backs the buy-and-hold thesis.
- At projected returns (-3.0% appreciation + 3.7% rent growth), your $30k cash investment doubles in ~5 years — after that, you're playing with house money.
Negotiation context
- Only 2 days on market — expect competitive offers; lowballing is unlikely to land.
- 4 sale attempts since 4y ago with the ask held roughly flat each time — persistent listings suggest the price (not the market) is what's stuck; bring a comps-based counter.
Questions for the listing agent
- Built in 1974 — when were the roof, HVAC, electrical panel, plumbing, and water heater last replaced?
- Is there a deadline driving the sale (1031 exchange, divorce, estate, relocation)? That informs how much negotiation room exists.
- Schools are F-rated, which usually means shorter tenancies and higher turnover. Who's the typical renter profile here, and what's been the actual vacancy rate?
- Crime grade is F in this area — have there been break-ins, vandalism, or insurance claims at this property in the last 3 years? What carrier currently insures it and at what premium?
- What's the average days-on-market for RENTAL listings here right now (not sales)? A rising rental-DOM trend means longer vacancies and softer asking-rent achievability than the comps imply.
- What's the recent tenant-quality profile in this submarket — average credit score on applications, eviction rate, late-payment / NSF rate, and stable-employment percentage? A property-management company in the area should have these aggregated.
- How much new for-sale + rental construction is in the pipeline within 1–3 miles? Heavy new supply typically softens prices + rents 12–24 months out; constrained supply supports both.
Investment metrics
- 1% rule
- 1.73% ✓
- Cap rate
- 14.44%
- Cash-on-cash
- 29.11%
- DSCR
- 2.30
- GRM
- 4.8
CMA / ARV
- ARV (on-the-fly)
- $306,937
- Comps found
- 11
Show comp detail 11 sales within ~0.75 mi
| Address | Dist | Beds/Ba | Sqft | Sold | Price | $/sf | Match |
|---|---|---|---|---|---|---|---|
| 1115 Third St | 0.10mi | 3/2.5 | 1,749 (+9%) | 13mo | $360,000 | $206 | 70 |
| 5261 Poplar Springs Rd | 0.21mi | 3/1.0 | 1,443 (-10%) | 2mo | $240,000 | $166 | 65 |
| 1187 Silver Hill Rd | 0.46mi | 3/2.0 | 1,700 (+6%) | 7mo | $325,000 | $191 | 61 |
| 912 Third St | 0.50mi | 3/2.5 | 1,541 (-4%) | 12mo | $251,000 | $163 | 60 |
| 5257 Hearthstone St | 0.62mi | 3/2.5 | 1,736 (+8%) | 6mo | $359,000 | $207 | 53 |
| 5169 Central Dr | 0.35mi | 3/2.0 | 1,428 (-11%) | 14mo | $325,000 | $228 | 52 |
| 884 Third St | 0.56mi | 3/2.5 | 1,424 (-11%) | 4mo | $255,000 | $179 | 52 |
| 5201 Skyline Dr | 0.54mi | 3/2.0 | 1,758 (+9%) | 10mo | $285,000 | $162 | 48 |
| 1048 Ferndale St | 0.48mi | 2/2.0 (-1) | 1,416 (-12%) | 6mo | $273,000 | $193 | 46 |
| 835 Ridge Ave | 0.63mi | 3/2.5 | 1,414 (-12%) | 9mo | $225,000 | $159 | 43 |
| 5154 Central Dr | 0.39mi | 4/1.5 (+1) | 1,386 (-14%) | 11mo | $450,000 | $325 | 41 |
Match score weights: distance 35% · size 25% · config 20% · recency 20%. Top-matched comps best support the ARV.
Projected returns pro-forma
-3.0% appreciation · 3.72% rent growth · sell at horizon
- IRR
- 24.3%
- Equity multiple
- 2.01×
- Total profit
- $29,936
- Equity at exit
- $15,745
- IRR
- 32.6%
- Equity multiple
- 4.06×
- Total profit
- $90,570
- Equity at exit
- $9,130
Cash invested: $29,568 (down + closing). Projections, not guarantees.
Landlord ↔ Tenant lean methodology
- Overall (STATE)
- 90 Strongly Landlord-Friendly
- State Georgia
- 90 Strongly Landlord-Friendly · R+3
- County
- — inherits STATE
- City
- — inherits STATE
ZIP-level market 30088
- Rents YoY
- 3.7%
- Active inventory
- 215
- Price-to-rent
- 4.8×
Monthly cashflow live
- Estimated rent
- $1,832 high interval (Pro) →
- Mortgage (P&I)
- −$554
- Tax est. 1.5%
- −$132 /mo · $1,584/yr
- Insurance
- −$44
- HOA
- −$0
- Vacancy / Maint / Mgmt
- −$385
- Net cashflow
- $717
Break-even live
Sensitivity live
| Price | -10% $790 | -5% $754 | +0% $717 | +5% $681 | +10% $644 |
|---|---|---|---|---|---|
| Rent | -10% $573 | -5% $645 | +0% $717 | +5% $790 | +10% $862 |
| Rate | -1.0pp $770 | -0.5pp $744 | base $717 | +0.5pp $690 | +1.0pp $662 |
UW: 25.0% down · 7.5% · 30yr · 1.5% tax · 5.0% vac · 8.0% maint · 8.0% mgmt
Financing live
Cash to close
- Down payment
- $26,400
- Closing costs
- $3,168
- Reserves months
- —
- Total cash needed
- —
Loan-product check · same deal, 3 products live
Conventional
25% down · 7.5% · 30yr
- Down + closing
- —
- Monthly P&I
- —
- Monthly cashflow
- —
- DSCR
- —
- Eligible?
- —
Personal DTI + credit; lowest rate.
DSCR
20% down · 8.5% · 30yr
- Down + closing
- —
- Monthly P&I
- —
- Monthly cashflow
- —
- DSCR
- —
- Eligible?
- —
No personal income docs; deal must DSCR.
Hard money
10% down · 12.0% · 12mo
- Down + closing
- —
- Monthly P&I
- —
- Monthly cashflow
- —
- DSCR
- —
- Eligible?
- —
Short-term bridge; refi at stabilization.
Rent comps 40 comps
| Address | Beds | Baths | Sqft | Rent | $/sqft | DOM | Units | Dist |
|---|---|---|---|---|---|---|---|---|
| 1047 Ridge Ave Stone Mountain, GA | 3.0 | 1.0 | 1402 | $2,150 | $1.53 | 25d | 1 | 0.18mi |
| 1150 Rankin St Stone Mountain, GA | 2.0 | 2.5 | 1495 | $1,850 | $1.24 | 25d | 1 | 0.24mi |
| 1150 Rankin St Stone Mountain, GA | 2.0–3.0 | 2.5 | 1437 | $1,850 | $1.29 | 44d | 2 | 0.25mi |
| 1248 Park Blvd Stone Mountain, GA | 3.0 | 2.0 | 1350 | $1,880 | $1.39 | 44d | 1 | 0.42mi |
| 1313 Stone Mill Way Stone Mountain, GA | 1.0–4.0 | 1.0–2.5 | 1004 | $1,633 | $1.63 | 16d | 12 | 0.57mi |
| 5100 W Mountain St Stone Mountain, GA | 1.0–3.0 | 1.0–2.0 | 1150 | $1,484 | $1.29 | 4d | 11 | 0.65mi |
| 967 Pine Roc Dr Stone Mountain, GA | 3.0 | 2.0 | 1206 | $1,900 | $1.58 | 11d | 1 | 0.68mi |
| 5030 W Mountain St Stone Mountain, GA | 2.0 | 1.0 | 1175 | $1,199 | $1.02 | 44d | 1 | 0.73mi |
| 1900 Tree Mountain Pkwy Stone Mountain, GA | 1.0–2.0 | 1.0–2.5 | 1118 | $1,200 | $1.07 | 0d | 25 | 0.73mi |
| 1310 Wood Bend Dr Stone Mountain, GA | 1.0–2.0 | 1.0–2.0 | 909 | $1,500 | $1.65 | 0d | 76 | 0.75mi |
| 4996 Sheila Ln Stone Mountain, GA | 4.0 | 2.0 | 1450 | $1,875 | $1.29 | 0d | 1 | 0.79mi |
| 768 Fourth St Stone Mountain, GA | 3.0 | 2.0 | 1200 | $2,100 | $1.75 | 5d | 1 | 0.87mi |
| 4959 Demere Ct Stone Mountain, GA | 3.0 | 2.0 | 1695 | $2,000 | $1.18 | 13d | 1 | 0.87mi |
| 4923 Sheila Ln Stone Mountain, GA | 3.0 | 2.0 | 1266 | $1,200 | $0.95 | 44d | 1 | 0.96mi |
| 4900 Central Dr Stone Mountain, GA | 1.0–3.0 | 1.0–2.0 | 1100 | $1,725 | $1.57 | 0d | 15 | 0.99mi |
| 779 Pepperwood Trl Stone Mountain, GA | 3.0 | 2.0 | 1458 | $1,980 | $1.36 | 0d | 1 | 1.02mi |
| 697 Pepperwood Trl Stone Mountain, GA | 3.0 | 2.0 | 1576 | $1,650 | $1.05 | 44d | 1 | 1.05mi |
| 5025 Brittany Dr Stone Mountain, GA | 3.0 | 2.5 | 1484 | $1,845 | $1.24 | 13d | 1 | 1.08mi |
| 1075 N Hairston Rd Stone Mountain, GA | 1.0–3.0 | 1.0–2.0 | 992 | $1,540 | $1.55 | 5d | 12 | 1.10mi |
| 5280 Ridge Forest Dr Stone Mountain, GA | 2.0 | 2.5 | 1170 | $1,325 | $1.13 | 44d | 1 | 1.16mi |
| 1073 Thornwoode Ln Stone Mountain, GA | 3.0 | 2.5 | 1235 | $697 | $0.56 | 22d | 1 | 1.17mi |
| 5353 Ridgemere Ct Stone Mountain, GA | 3.0 | 2.5 | 1160 | $1,465 | $1.26 | 5d | 1 | 1.21mi |
| 5351 Ridgemere Ct Stone Mountain, GA | 3.0 | 2.5 | 1160 | $1,465 | $1.26 | 5d | 1 | 1.21mi |
| 6097 Memorial Dr Stone Mountain, GA | 1.0–3.0 | 1.0–2.0 | 1045 | $1,657 | $1.59 | 0d | 10 | 1.26mi |
| 1173 N Hairston Rd Stone Mountain, GA | 2.0 | 1.0–2.0 | 1161 | $1,426 | $1.23 | 2d | 30 | 1.27mi |
| 1 Chatfield Dr Stone Mountain, GA | 1.0–3.0 | 1.0–2.5 | 1060 | $1,565 | $1.48 | 3d | 20 | 1.27mi |
| 4840 Hairston Park Sq Stone Mountain, GA | 3.0 | 2.5 | 1560 | $1,795 | $1.15 | 3d | 1 | 1.33mi |
| 4840 Hairston Park Sq Stone Mountain, GA | 3.0 | 2.5 | 1560 | $1,845 | $1.18 | 44d | 1 | 1.33mi |
| 5370 Zachary Dr Stone Mountain, GA | 4.0 | 2.0 | 1556 | $1,150 | $0.74 | 25d | 1 | 1.34mi |
| 4832 Hairston Park Sq Stone Mountain, GA | 3.0 | 2.5 | 1560 | $1,800 | $1.15 | 21d | 1 | 1.34mi |
| 1311 Old Countryside Cir Stone Mountain, GA | 3.0 | 2.5 | 1381 | $2,061 | $1.49 | 0d | 1 | 1.36mi |
| 5509 Stonehaven Way Stone Mountain, GA | 4.0 | 3.0 | 1635 | $1,899 | $1.16 | 22d | 1 | 1.40mi |
| 1297 Old Countryside Cir E Stone Mountain, GA | 3.0 | 2.5 | 1392 | $1,875 | $1.35 | 0d | 1 | 1.40mi |
| 1059 Mariners Dr Stone Mountain, GA | 2.0 | 1.5 | 1328 | $1,600 | $1.20 | 44d | 1 | 1.40mi |
| 1259 Old Countryside Cir Stone Mountain, GA | 3.0 | 2.0 | 1309 | $1,795 | $1.37 | 44d | 1 | 1.40mi |
| 5290 Stonebush Ter Unit A Stone Mountain, GA | 2.0 | 2.5 | 1200 | $1,450 | $1.21 | 19d | 1 | 1.40mi |
| 1010 Mariners Ct Stone Mountain, GA | 3.0 | 2.0 | 1739 | $1,475 | $0.85 | 44d | 1 | 1.40mi |
| 1305 Old Countryside Cir W Stone Mountain, GA | 3.0 | 2.0 | 1132 | $1,719 | $1.52 | 17d | 1 | 1.45mi |
| 4757 Fellswood Dr Stone Mountain, GA | 3.0 | 2.0 | 1665 | $1,900 | $1.14 | 0d | 1 | 1.45mi |
| 827 San Miguel Dr Stone Mountain, GA | 3.0 | 2.0 | 1272 | $1,550 | $1.22 | 17d | 1 | 1.46mi |
Listing history 3 events
-
2026-06-18days on market $105,600 Active 2 DOM
-
2026-06-17remarks 246-char remark
-
2026-06-17$105,600 Active 1 DOM
ⓘ Source: listings_history table (triggers on properties + properties_extension) + one-shot
backfill from property_details.listing_events for pre-trigger history.
Nearby sold comps map
Loading sold comps map…
Walkable amenities ~0.75 mi
Loading nearby amenities…
Taxation est. · year 1
- Rental income
- $21,981
- − Mortgage interest
- −$5,915
- − Property taxes
- −$1,584
- − Insurance
- −$528
- − Repairs & maintenance
- −$1,758
- − Management
- −$1,758
- − Depreciation
- −$3,072
- Taxable income
- $7,364
- Est. tax owed @ 24.0%
- −$1,767
- After-tax cash flow
- $6,840/yr
For passive investors: Depreciation is non-cash, so a rental often shows a tax loss while cash-flowing — sheltering income. Rental losses are passive: they offset passive income freely, and up to $25,000/yr can offset ordinary (W-2) income if you actively participate and your MAGI is under $100k (phasing out to $0 by $150k); unused losses carry forward. On sale, claimed depreciation is recaptured at up to 25%, and gains may owe capital-gains tax (a 1031 exchange can defer both). Figures are a year-1 estimate at your 24.0% rate — not tax advice; consult a CPA.
Schools (NCES district)
- District
- Dekalb County
- NCES district ID
- 1301740
- Math proficiency
- 19% ▼ -12.00%
- Reading proficiency
- 28% ▼ -7.00%
- Median HH income
- $51,448
- Composite
- 20.92/100
- National rank
- #8482
- State rank
- #125 of 174 in GA
Livability — Stone Mountain
- Score
- 79/100
- State rank
- #11
- US rank
- #1977
Category grades
Schools grade is shown separately in the Schools card above.
Census & demographics
- Census place
- Stone Mountain, GA
- County
- Dekalb County · 782,738 people
- City population
- 130,941
- Metro
- Atlanta-Sandy Springs-Alpharetta, GA
- Population (ZIP)
- 29,240
- Household income
- $70,325
- Rent vs Own
- Severe rent burden
- 1106.0
Population outlook (DeKalb County) Hauer SSP2
- Today (2025)
- 839,977 people
- By 2030
- 891,768 · +6.2%
- By 2040
- 988,894 · +17.7%
- By 2050
- 1,074,583 · +27.9%
- By 2075
- 1,245,026 · +48.2%
- By 2100
- 1,303,135 · +55.1%
Race, ethnicity, and origin ACS 2023
- Neighborhood character
- Predominantly Black (84%)
- Race & ethnicity
- Black 84% White 5% Hispanic / Latino 5% Two or more races 5%
- Common ancestry
- Swedish 1% Russian 1%
- Foreign-born
- 11% · Canada
- Languages at home
- 90% English-only · Spanish 4% French/Haitian/Cajun 1% Other Indo-European 1%
Political lean MEDSL · DeKalb
- 2024 margin
- Solid D (+64.8) · D 81.9% · R 17.1% · Other 1.0%
- 2008→2024 swing
- +6.1pp toward D · 2008: 58.6pp · 2024: 64.8pp
- All cycles
- 2024: D+64.8 2020: D+67.4 2016: D+64.8 2012: D+56.8 2008: D+58.6
Not yet ingested
- Civics
- —
Market trends
- HPI YoY
- ▼ -169.92%
- Current HPI
- 206.5421
- Rent YoY
- ▲ 3.72%
- Metro
- Atlanta-Sandy Springs-Alpharetta, GA
- State GDP YoY
- ▲ 2.66%
- F500 in state
- 28
Industry mix (Fortune 500 HQ in GA)
| Industry | F500 HQs | Revenue |
|---|---|---|
| Paper / Packaging | 2 | $29B |
|
||
| Retail | 1 | $160B |
|
||
| Transportation / Logistics | 1 | $91B |
|
||
| Airlines | 1 | $62B |
|
||
| Consumer Goods | 1 | $47B |
|
||
| Utilities | 1 | $25B |
|
||
Price history
-36.4% since first listed12 events — show timeline
- 2026-06-16 Listed $105,600 CGMLS
- 2025-12-31 Listing Removed — GAMLS
- 2025-12-31 Listing Removed — FMLS
- 2025-10-06 Price Changed $169,000 GAMLS
- 2025-10-06 Price Changed $169,000 FMLS
- 2025-08-29 Price Changed $175,000 GAMLS
- 2025-08-29 Price Changed $175,000 FMLS
- 2025-07-09 Listed $185,000 GAMLS
- 2025-07-09 Listed $185,000 FMLS
- 2023-01-27 Sold (MLS) $175,000 GAMLS
- 2022-12-27 Pending — GAMLS
- 2022-12-19 Listed $166,000 GAMLS
Cash-flow waterfall
monthlySold comps — $/sqft
last 12 mo · ≤1 miLoading sold comps…