223 Imperial Ave · Salton Sea Beach, CA
Flood risk 1/10 · Minimal
- FEMA flood zone
- X (unshaded)
- Chance of flooding over 30 yrs
- 0.0%
- Est. flood insurance / yr
- $507 – $1,088
Fire risk 4/10 · Minor
- Est. fire insurance / yr
- $659 – $1,223
Heat risk 10/10 · Severe
- Hot days now (above 114°F)
- 4 days/yr
- Hot days in 30 yrs
- 12 days/yr
Wind risk 1/10 · Minimal
- Chance of severe wind over 30 yrs
- —
Air-quality risk 2/10 · Minimal
- Unhealthy air days now
- 2 days/yr
- Unhealthy air days in 30 yrs
- 2 days/yr
Risk factors via First Street. Map © Google.
Why this score? — see what drove the B- grade
The composite is a weighted blend of 9 inputs, each scored 0–100. Each bar is that input's sub-score; the figure is the points it added to the 100-point composite (weight × sub-score).
- Cash flow +29.9/30.0
- DSCR +10.0/10.0
- Appreciation +10.0/10.0
- 1% rule +7.4/10.0
- Rent growth +2.5/5.0
- Condition / age +2.5/5.0
- Livability +2.4/5.0
- Schools +1.5/10.0
- ARV discount +0.0/15.0
$260,000
🖨 Deal sheet 📄 Offer letter ✓ Due diligence
Listing remarks MLS
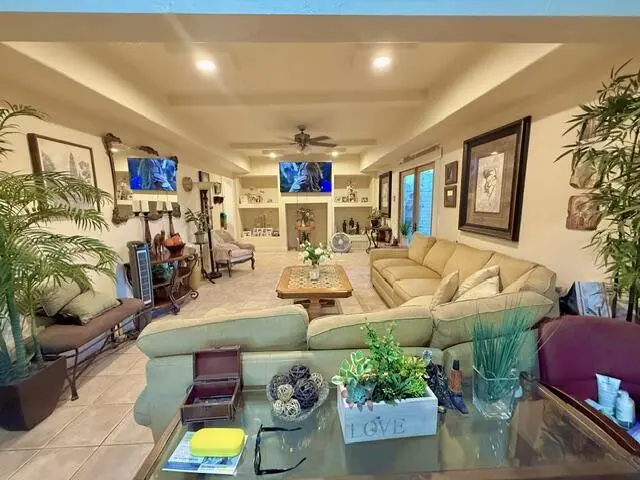
All-Cash Buyers Only - Perfect for retirement or affordable living with very monthly payment and expenses. A 3 bedroom 2 bathroom converted home on it's own land. No land lease! Approximately 1,124sf with a large den/family room with a one car garage and a two car carport. Cinder block wall instead of wood or chain-link fence with adjoining palm trees. There is a in ground pool that has not been used by owner. Block and a half from Salton Sea and just a little over 1,000ft from water front. Nearby Salvation Mountain, Mudpots, Imperial Sand Dunes, Dos Palmas Spring Oasis, State Park Oasis and the Date Farms offer plenty of relaxing activity options. Joshua Tree National Forest, Palm Springs, World’s Largest Dinosaur Museum and Palm Canyon/Anza Borrego State Park are all within easy commuting distance. Call and come see this place today.
Key facts
- Enclosed carport
- Large family room
- Mini-split system
Tags
Property features AI
Finance
- Other: Short-term rental status unknown; Will not consider lease
- Financial info: Cash and private financing available; Standard sale type
- HOA & community: No monthly association fee
Exterior
- Parking: Attached carport; Attached garage (2 spaces); One carport space; Driveway parking; Covered parking; Side-by-side parking; On-street parking; Total of 8 parking spaces; Three uncovered/assigned spaces; RV parking — buyer to verify dimensions
- Security: Sprinklers present; Other security/safety features
- Utilities: Water: other; Sewer: septic tank; PUD: no
- Home design: Single-family detached home; One story
- Construction: Built in year listed as other; Detached construction
- Exterior features: Sprinkler system; Irrigation not present in some areas; Corner lot location (directions indicate corner home)
Interior
- Kitchen: Refrigerator included; Stove included
- Flooring: Tile; Other flooring
- Bathrooms: One full bathroom
- Heating & cooling: Propane gas heating; Ceiling fan(s); Wall/window air conditioning units; Other heating and cooling types
- Interior features: Unfurnished; Property sold as-is
- Laundry & utility: Propane equipment
Neighborhood map
What this means for you Summary
Snapshot
- This is a 2-bed/1.0-bath single-family listed at $260k.
Deal economics
- At list price, monthly cash flow is $963 ($12k/yr) — positive.
- The deal already cash-flows at list — no discount required.
- Meets the 1% rule at list price ($3k rent vs $260k).
- Recommended offer: $256k (1.5% below list) — sets the bar for market timing.
Location & tenants
- Location reads 48/100 on livability (#1,190 in CA) — a working-class tenant base; expect higher turnover. Strengths: cost of living A+, employment B, housing B; Watch: schools F, crime F, amenities F.
- Coachella Valley Unified (rural): math 12% / reading 23% proficiency, ranked #481 of 517 in CA (top 93%) — low school quality limits family demand, transient renter base, plan for 1-2y turnover; 79% free/reduced lunch — lower-income household profile, screen leases tightly.
- Market conditions: 492 active listings in the ZIP; 1 comparable units currently listed for rent nearby; 271 units permitted in Imperial County in 2024 (112 in 5+ unit buildings).
Forward outlook
- In year one you build about $28k of equity ($2k loan paydown + $26k appreciation (10.0% local appreciation)).
- Imperial County population projected at +7% by 2050 — modest demand growth; plan on rents tracking national, not racing it.
- At projected returns (10.0% appreciation + 3.0% rent growth), your $73k cash investment doubles in ~2 years — after that, you're playing with house money.
- By year 2, paydown + projected appreciation supports a ~$45k cash-out refi (75% LTV) — recoverable capital for the next deal without selling this one.
Negotiation context
- It's been on market 29 days — a 2% lower offer ($256k) is reasonable based on typical stale-listing flexibility.
- 3 sale attempts since 22y ago with the ask held roughly flat each time — persistent listings suggest the price (not the market) is what's stuck; bring a comps-based counter.
- Current owner paid $100k; list at $260k implies a 160% gain — meaningful room to come down on a strong offer.
Risks & watch-outs
- Climate carrying-cost: extreme-heat days projected 4→12/yr by 2055 (HVAC capex compounding) — expect insurance premiums to compound above CPI over the hold.
Questions for the listing agent
- Built in 1975 — when were the roof, HVAC, electrical panel, plumbing, and water heater last replaced?
- Is there a deadline driving the sale (1031 exchange, divorce, estate, relocation)? That informs how much negotiation room exists.
- Schools are F-rated, which usually means shorter tenancies and higher turnover. Who's the typical renter profile here, and what's been the actual vacancy rate?
- Crime grade is F in this area — have there been break-ins, vandalism, or insurance claims at this property in the last 3 years? What carrier currently insures it and at what premium?
- What's the average days-on-market for RENTAL listings here right now (not sales)? A rising rental-DOM trend means longer vacancies and softer asking-rent achievability than the comps imply.
- What's the recent tenant-quality profile in this submarket — average credit score on applications, eviction rate, late-payment / NSF rate, and stable-employment percentage? A property-management company in the area should have these aggregated.
- How much new for-sale + rental construction is in the pipeline within 1–3 miles? Heavy new supply typically softens prices + rents 12–24 months out; constrained supply supports both.
Investment metrics
- 1% rule
- 1.24% ✓
- Cap rate
- 10.74%
- Cash-on-cash
- 15.87%
- DSCR
- 1.71
- GRM
- 6.7
CMA / ARV
- ARV (on-the-fly)
- $186,584
- Comps found
- 1
Show comp detail 1 sale within ~0.75 mi
| Address | Dist | Beds/Ba | Sqft | Sold | Price | $/sf | Match |
|---|---|---|---|---|---|---|---|
| 3441 Niland Ave | 0.21mi | 2/2.0 | 996 (-11%) | 10mo | $165,357 | $166 | 59 |
Match score weights: distance 35% · size 25% · config 20% · recency 20%. Top-matched comps best support the ARV.
Projected returns pro-forma
10.0% appreciation · 3.0% rent growth · sell at horizon
- IRR
- 36.0%
- Equity multiple
- 3.79×
- Total profit
- $202,837
- Equity at exit
- $234,229
- IRR
- 31.0%
- Equity multiple
- 8.54×
- Total profit
- $548,956
- Equity at exit
- $505,123
Cash invested: $72,800 (down + closing). Projections, not guarantees.
Landlord ↔ Tenant lean methodology
- Overall (STATE)
- 18 Strongly Tenant-Friendly
- State California
- 18 Strongly Tenant-Friendly · D+13
- County
- — inherits STATE
- City
- — inherits STATE
ZIP-level market 92274
- Home prices YoY
- 31.9%
- Active inventory
- 492
- Price-to-rent
- 6.7×
Monthly cashflow live
- Estimated rent
- $3,235 medium interval (Pro) →
- Mortgage (P&I)
- −$1,363
- Tax from tax record
- −$121 /mo · $1,455/yr
- Insurance
- −$108
- HOA
- −$0
- Vacancy / Maint / Mgmt
- −$679
- Net cashflow
- $963
Break-even live
UW: 25.0% down · 7.5% · 30yr · 1.5% tax · 5.0% vac · 8.0% maint · 8.0% mgmt
Financing live
Cash to close
- Down payment
- $65,000
- Closing costs
- $7,800
- Reserves months
- —
- Total cash needed
- —
Loan-product check · same deal, 3 products live
Conventional
25% down · 7.5% · 30yr
- Down + closing
- —
- Monthly P&I
- —
- Monthly cashflow
- —
- DSCR
- —
- Eligible?
- —
Personal DTI + credit; lowest rate.
DSCR
20% down · 8.5% · 30yr
- Down + closing
- —
- Monthly P&I
- —
- Monthly cashflow
- —
- DSCR
- —
- Eligible?
- —
No personal income docs; deal must DSCR.
Hard money
10% down · 12.0% · 12mo
- Down + closing
- —
- Monthly P&I
- —
- Monthly cashflow
- —
- DSCR
- —
- Eligible?
- —
Short-term bridge; refi at stabilization.
Rent comps 1 comps
| Address | Beds | Baths | Sqft | Rent | $/sqft | DOM | Units | Dist |
|---|---|---|---|---|---|---|---|---|
| Block 17 Apartments Salton Sea Beach, CA | 1.0–2.0 | 1.0–2.0 | 941 | $3,235 | $3.44 | 1d | 17 | 0.10mi |
Listing history 19 events
-
2026-06-18days on market $260,000 Active 29 DOM
-
2026-06-17days on market $260,000 Active 28 DOM
-
2026-06-16days on market $260,000 Active 27 DOM
-
2026-06-15days on market $260,000 Active 26 DOM
-
2026-06-13days on market $260,000 Active 24 DOM
-
2026-06-13days on market $260,000 Active 23 DOM
-
2026-06-09days on market $260,000 Active 20 DOM
-
2026-06-08days on market $260,000 Active 19 DOM
-
2026-06-07days on market $260,000 Active 18 DOM
-
2026-06-04days on market $260,000 Active 15 DOM
-
2026-06-03days on market $260,000 Active 14 DOM
-
2026-06-02days on market $260,000 Active 13 DOM
-
2026-06-01days on market $260,000 Active 12 DOM
-
2026-05-31days on market $260,000 Active 11 DOM
-
2026-05-19$260,000 Active
-
2021-05-10soldstatus $100,000 853-char remark
Show marketing remark (853 chars)
All-Cash Buyers Only - Perfect for retirement or affordable living with very monthly payment and expenses. A 3 bedroom 2 bathroom converted home on it's own land. No land lease! Approximately 1,124sf with a large den/family room with a one car garage and a two car carport. Cinder block wall instead of wood or chain-link fence with adjoining palm trees. There is a in ground pool that has not been used by owner. Block and a half from Salton Sea and just a little over 1,000ft from water front. Nearby Salvation Mountain, Mudpots, Imperial Sand Dunes, Dos Palmas Spring Oasis, State Park Oasis and the Date Farms offer plenty of relaxing activity options. Joshua Tree National Forest, Palm Springs, World’s Largest Dinosaur Museum and Palm Canyon/Anza Borrego State Park are all within easy commuting distance. Call and come see this place today.
-
2020-08-18$95,000 853-char remark
Show marketing remark (853 chars)
All-Cash Buyers Only - Perfect for retirement or affordable living with very monthly payment and expenses. A 3 bedroom 2 bathroom converted home on it's own land. No land lease! Approximately 1,124sf with a large den/family room with a one car garage and a two car carport. Cinder block wall instead of wood or chain-link fence with adjoining palm trees. There is a in ground pool that has not been used by owner. Block and a half from Salton Sea and just a little over 1,000ft from water front. Nearby Salvation Mountain, Mudpots, Imperial Sand Dunes, Dos Palmas Spring Oasis, State Park Oasis and the Date Farms offer plenty of relaxing activity options. Joshua Tree National Forest, Palm Springs, World’s Largest Dinosaur Museum and Palm Canyon/Anza Borrego State Park are all within easy commuting distance. Call and come see this place today.
-
2005-05-01historical
-
2004-12-07$79,000
ⓘ Source: listings_history table (triggers on properties + properties_extension) + one-shot
backfill from property_details.listing_events for pre-trigger history.
Tax reassessment forecast CA · Resets to sale price
- Current annual tax
- $1,455 · $121/mo
- Projected year-2 tax
- $1,976 · $165/mo
- Expected delta
- +$521/yr (+$43/mo · 35.8%)
ⓘ Screening estimate from a state-policy table — verify with the county assessor before closing.
Climate risk First Street
- Flood 1/10 Low FEMA zone X (unshaded) · 0% chance over 30 yrs
- Wildfire 4/10 Moderate
- Heat 10/10 Extreme 4 d/yr ≥114°F today · 12 d/yr by 30 yrs out
- Wind 1/10 Low
- Air quality 2/10 Low 2 unhealthy d/yr today · 2 by 30 yrs out
Nearby sold comps map
Loading sold comps map…
Walkable amenities ~0.75 mi
Loading nearby amenities…
Taxation est. · year 1
- Rental income
- $38,820
- − Mortgage interest
- −$14,564
- − Property taxes
- −$1,455
- − Insurance
- −$1,300
- − Repairs & maintenance
- −$3,106
- − Management
- −$3,106
- − Depreciation
- −$7,564
- Taxable income
- $7,727
- Est. tax owed @ 24.0%
- −$1,854
- After-tax cash flow
- $9,697/yr
For passive investors: Depreciation is non-cash, so a rental often shows a tax loss while cash-flowing — sheltering income. Rental losses are passive: they offset passive income freely, and up to $25,000/yr can offset ordinary (W-2) income if you actively participate and your MAGI is under $100k (phasing out to $0 by $150k); unused losses carry forward. On sale, claimed depreciation is recaptured at up to 25%, and gains may owe capital-gains tax (a 1031 exchange can defer both). Figures are a year-1 estimate at your 24.0% rate — not tax advice; consult a CPA.
Schools (NCES district)
- District
- Coachella Valley Unified
- NCES district ID
- 0609070
- Math proficiency
- 12% ▼ -8.00%
- Reading proficiency
- 23% ▼ -6.00%
- Median HH income
- $37,683
- Composite
- 14.62/100
- National rank
- #9408
- State rank
- #481 of 517 in CA
Livability — Salton Sea Beach
- Score
- 48/100
- State rank
- #1190
- US rank
- #26026
Category grades
Schools grade is shown separately in the Schools card above.
Census & demographics
- Census place
- Salton Sea Beach, CA
- Population (ZIP)
- 17,909
Population outlook (Imperial County) Hauer SSP2
- Today (2025)
- 186,713 people
- By 2030
- 190,022 · +1.8%
- By 2040
- 195,993 · +5.0%
- By 2050
- 199,534 · +6.9%
- By 2075
- 216,878 · +16.2%
- By 2100
- 352,705 · +88.9%
Race, ethnicity, and origin ACS 2023
- Neighborhood character
- Predominantly Hispanic (88%)
- Race & ethnicity
- Hispanic / Latino 88% Two or more races 49% White 10%
- Hispanic origin (detail)
- Mexican 87%
- Common ancestry
- Italian 1% Portuguese 1%
- Foreign-born
- 42% · Canada
- Languages at home
- 24% English-only · Spanish 76%
Political lean MEDSL · Imperial
- 2024 margin
- Toss-up / Even · D 48.3% · R 49.1% · Other 2.6%
- 2008→2024 swing
- -27.0pp toward R · 2008: 26.2pp · 2024: -0.9pp
- All cycles
- 2024: R+0.9 2020: D+24.4 2016: D+41.1 2012: D+28.8 2008: D+26.2
Not yet ingested
- Civics
- —
Market trends
- HPI YoY
- ▲ 179.97%
- Current HPI
- 744.8454
- Rent YoY
- —
- Metro
- —
- State GDP YoY
- ▲ 3.21%
- F500 in state
- 116
Industry mix (Fortune 500 HQ in CA)
| Industry | F500 HQs | Revenue |
|---|---|---|
| Technology | 27 | $1,492B |
|
||
| Financial Services | 3 | $174B |
|
||
| Retail | 3 | $44B |
|
||
| Insurance | 3 | $26B |
|
||
| Media / Entertainment | 2 | $115B |
|
||
| Pharmaceuticals / Biotech | 2 | $62B |
|
||
Price history
+229.1% since first listed5 events — show timeline
- 2026-05-19 Listed $260,000 GPSMLS
- 2021-05-10 Sold (MLS) $100,000 CRMLS
- 2020-08-18 Listed $95,000 CRMLS
- 2005-05-01 Listing Removed — CRMLS
- 2004-12-07 Listed $79,000 CRMLS
Property tax history
+14.5%/yrLatest (2025): $1,455 · +1.9% YoY. Source: county tax records.
Cash-flow waterfall
monthlySold comps — $/sqft
last 12 mo · ≤1 miLoading sold comps…