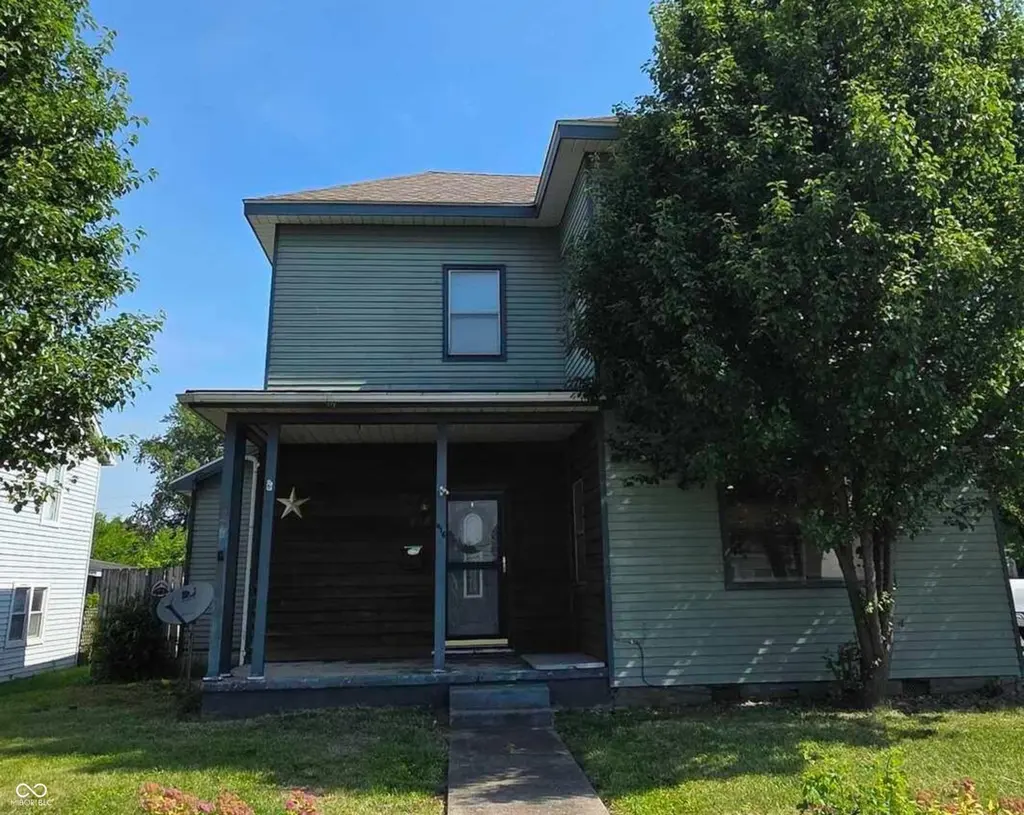
416 E Main St · Greentown, IN
Flood risk 1/10 · Minimal
- FEMA flood zone
- X (unshaded)
- Chance of flooding over 30 yrs
- 0.0%
- Est. flood insurance / yr
- $473 – $860
Fire risk 3/10 · Minor
- Est. fire insurance / yr
- $717 – $1,331
Heat risk 3/10 · Minor
- Hot days now (above 100°F)
- 7 days/yr
- Hot days in 30 yrs
- 17 days/yr
Wind risk 2/10 · Minimal
- Chance of severe wind over 30 yrs
- —
Air-quality risk 3/10 · Minor
- Unhealthy air days now
- 1 days/yr
- Unhealthy air days in 30 yrs
- 3 days/yr
Risk factors via First Street. Map © Google.
Why this score? — see what drove the B+ grade
The composite is a weighted blend of 9 inputs, each scored 0–100. Each bar is that input's sub-score; the figure is the points it added to the 100-point composite (weight × sub-score).
- Cash flow +30.0/30.0
- ARV discount +15.0/15.0
- DSCR +10.0/10.0
- 1% rule +9.3/10.0
- Schools +3.8/10.0
- Livability +3.4/5.0
- Rent growth +2.5/5.0
- Condition / age +2.5/5.0
- Appreciation +0.0/10.0
$105,000
🖨 Deal sheet 📄 Offer letter ✓ Due diligence
Listing remarks MLS
The heart of Greentown offers this 3 bedroom 1.5 bath home waiting on new owners. Now is perfect time to enjoy the above ground pool with many decks for those hot summer days for entertaining. Beautiful and peaceful landscaping adds to the tranquility of the backyard. The covered front porch offers a perfect place to enjoy a cup of coffee in the morning. The homes main level offers an eat in kitchen with patio doors leading to an outside area perfect for grilling, a good size laundry room with storage cabinets, full bath, living area and another room that could be used as a bedroom or an additional family room/game room. Upper level offers 2 large bedrooms and a room that would be perfect for an office or nursery (Does not have a closet). There is a ½ bath on the upper level that would need a shower installed. Some work has been done but home does need your finishing ideas to bring life to this home full of character. Eastern Schools. Home is being sold in as in condition. Cash or Conventional offers only. Home does need work but has a lot of potential. Updates are: Roof 5 years, W/ H 4 years, electrical 7 yrs, main bath 9 yrs.
Key facts
- 0.26 acre lot
- 2 garage spots
- Built 1850
Property features AI
Exterior
- Parking: Detached 2-car garage
- Utilities: Public water; Municipal sewer connected; Solid waste service available
- Home design: Single-family residence; Two levels
- Construction: Wood siding; Block foundation
- Exterior features: Approximately 0.26-acre lot (about 1/4–1/2 acre)
Interior
- Kitchen: No appliances included
- Bedrooms: Four bedrooms total — two on the main level and two on the upper level; Bedroom sizes include 14 x 12 and multiple 12 x 10 rooms
- Bathrooms: Two full bathrooms — one on the main level and one on the upper level
- Heating & cooling: Forced air heating; Central air conditioning
- Interior features: Attic access; Basement present
- Laundry & utility: No specific laundry appliances listed
Neighborhood map
What this means for you Summary
Snapshot
- This is a 3-bed/1.5-bath single-family listed at $105k.
Deal economics
- At list price, monthly cash flow is $508 ($6k/yr) — positive.
- The deal already cash-flows at list — no discount required.
- Meets the 1% rule at list price ($2k rent vs $105k).
- Cap rate 12.1% vs local median 6.0% in Greentown — top-decile yield for the area; either an underpriced asset or a hidden risk that comps aren't pricing in. Stress-test before assuming the spread holds.
Location & tenants
- Location reads 67/100 on livability (#243 in IN) — a middle-class / working-renter tenant base. Strengths: crime A+, cost of living A+, housing A+; Watch: amenities F, commute F, health & safety D-.
- Eastern Howard School Corporation (town): math 40% / reading 47% proficiency, ranked #100 of 301 in IN (top 33%) — families likely to look elsewhere, expect single-tenant / working-renter base with shorter leases.
- Zoned schools: Eastern Elementary School (math 50% / reading 39%, grade F, #379 of 994 statewide, top 41%, 770 students, 45% FRL); Eastern High School (math 42% / reading 82%, grade B-, #41 of 369 statewide, top 12%, 467 students, 42% FRL) — zoned schools average 43% FRL vs 24% district-wide (19 pts higher); higher-poverty schools than district average — tighter screening recommended.
- Market conditions: 30 active listings in the ZIP; 1 comparable units currently listed for rent nearby; 194 units permitted in Howard County in 2024 (0 in 5+ unit buildings).
Forward outlook
- Local home prices are declining (-3.0%/yr); year-one equity from $726 of loan paydown is wiped out by about $3k of value loss. Plan a longer hold.
- Howard County population projected at -11% by 2050 — secular population decline; favor cash flow + early exit over multi-decade hold.
- At projected returns (-3.0% appreciation + 3.0% rent growth), your $29k cash investment doubles in ~6 years — after that, you're playing with house money.
Negotiation context
- Only 12 days on market — expect competitive offers; lowballing is unlikely to land.
- 3 sale attempts since 5y ago with the ask held roughly flat each time — persistent listings suggest the price (not the market) is what's stuck; bring a comps-based counter.
- Current owner paid $70k; list at $105k implies a 50% gain — meaningful room to come down on a strong offer.
Risks & watch-outs
- Watch-outs: built in 1850 — expect roof / HVAC / electrical / plumbing capex.
Questions for the listing agent
- Built in 1850 — when were the roof, HVAC, electrical panel, plumbing, and water heater last replaced?
- Is there a deadline driving the sale (1031 exchange, divorce, estate, relocation)? That informs how much negotiation room exists.
- What's the average days-on-market for RENTAL listings here right now (not sales)? A rising rental-DOM trend means longer vacancies and softer asking-rent achievability than the comps imply.
- What's the recent tenant-quality profile in this submarket — average credit score on applications, eviction rate, late-payment / NSF rate, and stable-employment percentage? A property-management company in the area should have these aggregated.
- How much new for-sale + rental construction is in the pipeline within 1–3 miles? Heavy new supply typically softens prices + rents 12–24 months out; constrained supply supports both.
Investment metrics
- 1% rule
- 1.43% ✓
- Cap rate
- 12.10%
- Cash-on-cash
- 20.75%
- DSCR
- 1.92
- GRM
- 5.8
CMA / ARV
- ARV (on-the-fly)
- $205,500
- Comps found
- 12
Show comp detail 12 sales within ~0.75 mi
| Address | Dist | Beds/Ba | Sqft | Sold | Price | $/sf | Match |
|---|---|---|---|---|---|---|---|
| 316 S Howard St | 0.24mi | 3/2.0 | 1,461 (-3%) | 0mo | $222,500 | $152 | 82 |
| 227 Holiday Ln | 0.25mi | 3/2.0 | 1,450 (-3%) | 1mo | $190,000 | $131 | 80 |
| 315 E Payton St | 0.27mi | 3/2.0 | 1,476 (-2%) | 8mo | $135,000 | $91 | 76 |
| 329 W Grant St | 0.43mi | 3/2.0 | 1,466 (-2%) | 7mo | $201,000 | $137 | 69 |
| 317 Harrison Ct | 0.51mi | 3/2.0 | 1,474 (-2%) | 4mo | $249,900 | $170 | 68 |
| 1122 Blue Jay Dr | 0.45mi | 3/2.0 | 1,372 (-8%) | 2mo | $190,000 | $138 | 61 |
| 605 S Maple St | 0.44mi | 3/2.0 | 1,592 (+6%) | 8mo | $200,000 | $126 | 60 |
| 324 N Meridian St | 0.27mi | 3/2.0 | 1,320 (-12%) | 10mo | $187,000 | $142 | 57 |
| 128 W High St | 0.44mi | 3/1.0 | 1,352 (-10%) | 6mo | $100,000 | $74 | 56 |
| 509 S Meridian St | 0.48mi | 3/2.0 | 1,320 (-12%) | 8mo | $150,000 | $114 | 49 |
| 601 S Maple St | 0.41mi | 4/2.5 (+1) | 1,656 (+10%) | 8mo | $270,000 | $163 | 48 |
| 220 W Main St | 0.34mi | 2/1.0 (-1) | 1,292 (-14%) | 11mo | $125,000 | $97 | 45 |
Match score weights: distance 35% · size 25% · config 20% · recency 20%. Top-matched comps best support the ARV.
Projected returns pro-forma
-3.0% appreciation · 3.0% rent growth · sell at horizon
- IRR
- 13.1%
- Equity multiple
- 1.52×
- Total profit
- $15,364
- Equity at exit
- $15,656
- IRR
- 22.0%
- Equity multiple
- 2.87×
- Total profit
- $55,049
- Equity at exit
- $9,078
Cash invested: $29,400 (down + closing). Projections, not guarantees.
Landlord ↔ Tenant lean methodology
- Overall (STATE)
- 90 Strongly Landlord-Friendly
- State Indiana
- 90 Strongly Landlord-Friendly · R+11
- County
- — inherits STATE
- City
- — inherits STATE
ZIP-level market 46936
- Home prices YoY
- -24.1%
- Active inventory
- 30
- Price-to-rent
- 5.8×
Monthly cashflow live
- Estimated rent
- $1,500 medium interval (Pro) →
- Mortgage (P&I)
- −$551
- Tax from tax record
- −$82 /mo · $986/yr
- Insurance
- −$44
- HOA
- −$0
- Vacancy / Maint / Mgmt
- −$315
- Net cashflow
- $508
Break-even live
UW: 25.0% down · 7.5% · 30yr · 1.5% tax · 5.0% vac · 8.0% maint · 8.0% mgmt
Financing live
Cash to close
- Down payment
- $26,250
- Closing costs
- $3,150
- Reserves months
- —
- Total cash needed
- —
Loan-product check · same deal, 3 products live
Conventional
25% down · 7.5% · 30yr
- Down + closing
- —
- Monthly P&I
- —
- Monthly cashflow
- —
- DSCR
- —
- Eligible?
- —
Personal DTI + credit; lowest rate.
DSCR
20% down · 8.5% · 30yr
- Down + closing
- —
- Monthly P&I
- —
- Monthly cashflow
- —
- DSCR
- —
- Eligible?
- —
No personal income docs; deal must DSCR.
Hard money
10% down · 12.0% · 12mo
- Down + closing
- —
- Monthly P&I
- —
- Monthly cashflow
- —
- DSCR
- —
- Eligible?
- —
Short-term bridge; refi at stabilization.
Rent comps 1 comps
| Address | Beds | Baths | Sqft | Rent | $/sqft | DOM | Units | Dist |
|---|---|---|---|---|---|---|---|---|
| 623 W Main St Greentown, IN | 3.0 | 2.0 | 1656 | $1,500 | $0.91 | 44d | 1 | 0.70mi |
Listing history 11 events
-
2026-06-19days on market $105,000 Active 12 DOM
-
2026-06-18days on market $105,000 Active 11 DOM
-
2026-06-17days on market $105,000 Active 10 DOM
-
2026-06-16days on market $105,000 Active 9 DOM
-
2026-06-15days on market $105,000 Active 8 DOM
-
2026-06-14days on market $105,000 Active 6 DOM
-
2026-06-13days on market $105,000 Active 5 DOM
-
2026-06-10days on market $105,000 Active 3 DOM
-
2026-06-09days on market $105,000 Active 2 DOM
-
2026-06-08remarks 521-char remark
-
2026-06-08$105,000 Active 1 DOM
ⓘ Source: listings_history table (triggers on properties + properties_extension) + one-shot
backfill from property_details.listing_events for pre-trigger history.
Tax reassessment forecast IN · Partial reset (capped growth)
- Current annual tax
- $986 · $82/mo
- Projected year-2 tax
- $986 · $82/mo
- Expected delta
- $0/yr ($0/mo · 0.0%)
ⓘ Screening estimate from a state-policy table — verify with the county assessor before closing.
Climate risk First Street
- Flood 1/10 Low FEMA zone X (unshaded) · 0% chance over 30 yrs
- Wildfire 3/10 Moderate
- Heat 3/10 Moderate 7 d/yr ≥100°F today · 17 d/yr by 30 yrs out
- Wind 2/10 Low
- Air quality 3/10 Moderate 1 unhealthy d/yr today · 3 by 30 yrs out
Nearby sold comps map
Loading sold comps map…
Walkable amenities ~0.75 mi
Loading nearby amenities…
Taxation est. · year 1
- Rental income
- $18,000
- − Mortgage interest
- −$5,882
- − Property taxes
- −$986
- − Insurance
- −$525
- − Repairs & maintenance
- −$1,440
- − Management
- −$1,440
- − Depreciation
- −$3,055
- Taxable income
- $4,673
- Est. tax owed @ 24.0%
- −$1,122
- After-tax cash flow
- $4,980/yr
For passive investors: Depreciation is non-cash, so a rental often shows a tax loss while cash-flowing — sheltering income. Rental losses are passive: they offset passive income freely, and up to $25,000/yr can offset ordinary (W-2) income if you actively participate and your MAGI is under $100k (phasing out to $0 by $150k); unused losses carry forward. On sale, claimed depreciation is recaptured at up to 25%, and gains may owe capital-gains tax (a 1031 exchange can defer both). Figures are a year-1 estimate at your 24.0% rate — not tax advice; consult a CPA.
Schools (NCES district)
- District
- Eastern Howard School Corporation
- NCES district ID
- 1803150
- Math proficiency
- 40% ▼ -6.00%
- Reading proficiency
- 47% ▼ -2.00%
- Median HH income
- $58,636
- Composite
- 38.2/100
- National rank
- #4255
- State rank
- #100 of 301 in IN
Livability — Greentown
- Score
- 67/100
- State rank
- #243
- US rank
- #10353
Category grades
Schools grade is shown separately in the Schools card above.
Census & demographics
- Census place
- Greentown, IN
- Population (ZIP)
- 5,956
Population outlook (Howard County) Hauer SSP2
- Today (2025)
- 81,522 people
- By 2030
- 80,104 · -1.7%
- By 2040
- 76,708 · -5.9%
- By 2050
- 72,880 · -10.6%
- By 2075
- 64,016 · -21.5%
- By 2100
- 51,705 · -36.6%
Race, ethnicity, and origin ACS 2023
- Neighborhood character
- Predominantly White (92%)
- Race & ethnicity
- White 92% Hispanic / Latino 4% Two or more races 3% Black 1%
- Common ancestry
- Italian 3% Portuguese 2% Slovak 1%
- Foreign-born
- 1%
Political lean MEDSL · Howard
- 2024 margin
- Solid R (+35.3) · D 31.4% · R 66.7% · Other 1.8%
- 2008→2024 swing
- -29.1pp toward R · 2008: -6.2pp · 2024: -35.3pp
- All cycles
- 2024: R+35.3 2020: R+32.4 2016: R+33.9 2012: R+14.3 2008: R+6.2
Not yet ingested
- Civics
- —
Market trends
- HPI YoY
- ▼ -66.91%
- Current HPI
- 211.2334
- Rent YoY
- —
- Metro
- —
- State GDP YoY
- ▲ 2.90%
- F500 in state
- 18
Industry mix (Fortune 500 HQ in IN)
| Industry | F500 HQs | Revenue |
|---|---|---|
| Industrial Machinery | 2 | $37B |
|
||
| Healthcare | 1 | $177B |
|
||
| Pharmaceuticals | 1 | $45B |
|
||
| Metals / Steel | 1 | $18B |
|
||
| Agriculture | 1 | $17B |
|
||
| Packaging | 1 | $12B |
|
||
Price history
+7.1% since first listed8 events — show timeline
- 2026-06-07 Listed $105,000 MIBOR as Distributed by MLS Grid
- 2025-09-03 Sold (Public Records) $70,000 Public Records
- 2022-07-26 Sold (MLS) $65,000 IRMLS
- 2022-07-21 Pending — IRMLS
- 2022-07-10 Contingent — IRMLS
- 2022-06-20 Price Changed $79,900 IRMLS
- 2022-05-21 Listed $86,000 IRMLS
- 2021-07-09 Listed $98,000 IRMLS
Property tax history
+3.6%/yrLatest (2024): $986 · -6.1% YoY. Source: county tax records.
Cash-flow waterfall
monthlySold comps — $/sqft
last 12 mo · ≤1 miLoading sold comps…