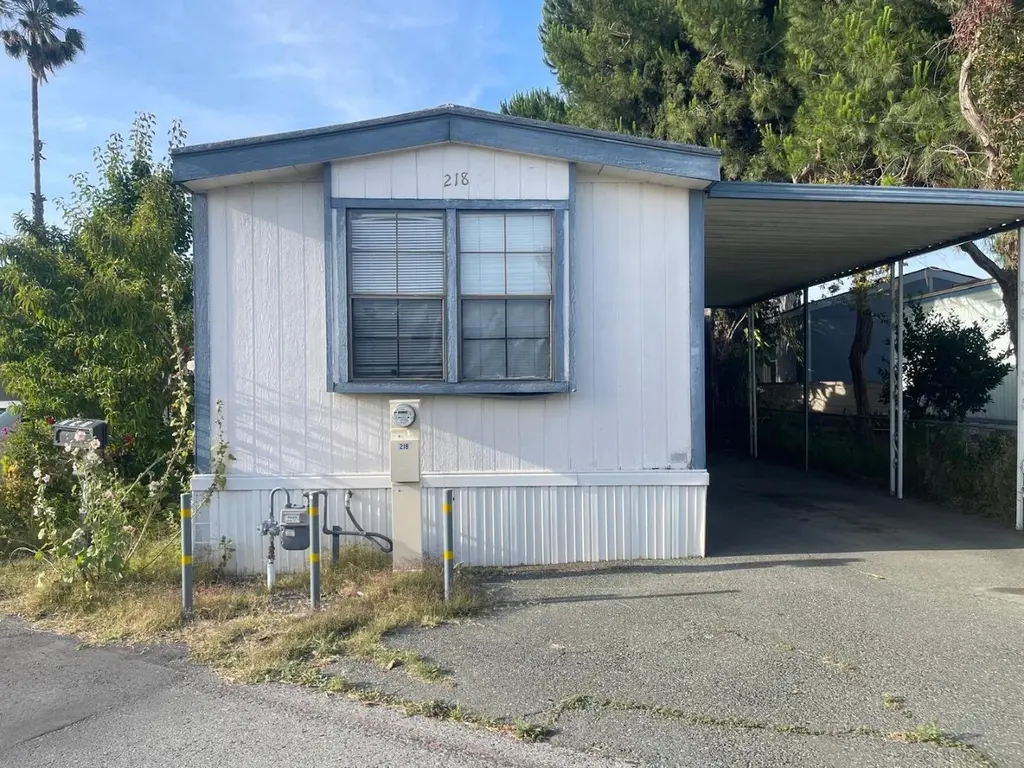
411 Lewis Rd #218 · San Jose, CA
Flood risk 1/10 · Minimal
- FEMA flood zone
- D
- Chance of flooding over 30 yrs
- 0.0%
- Est. flood insurance / yr
- $544 – $1,084
Fire risk 1/10 · Minimal
- Est. fire insurance / yr
- $659 – $1,223
Heat risk 5/10 · Moderate
- Hot days now (above 95°F)
- 7 days/yr
- Hot days in 30 yrs
- 14 days/yr
Wind risk 1/10 · Minimal
- Chance of severe wind over 30 yrs
- —
Air-quality risk 9/10 · Severe
- Unhealthy air days now
- 19 days/yr
- Unhealthy air days in 30 yrs
- 19 days/yr
Risk factors via First Street. Map © Google.
Why this score? — see what drove the B+ grade
The composite is a weighted blend of 9 inputs, each scored 0–100. Each bar is that input's sub-score; the figure is the points it added to the 100-point composite (weight × sub-score).
- Cash flow +30.0/30.0
- ARV discount +15.0/15.0
- 1% rule +10.0/10.0
- DSCR +10.0/10.0
- Schools +5.5/10.0
- Livability +3.9/5.0
- Rent growth +2.8/5.0
- Condition / age +2.5/5.0
- Appreciation +0.0/10.0
$169,000
🖨 Deal sheet 📄 Offer letter ✓ Due diligence
Listing remarks MLS
Wao what a great starter home with a price to sell just need tender loving care. Come and see the potential this mobile home has to offer. Ready for the right person to bring it up to their design of choice. This Home offers 2 bed 1.5 bath with a sft of apx 624 must see.
Key facts
- Built 1988
- Listed 15 days
Property features AI
Finance
- Other: Living area reported as 624; Section 1 serial number 0993360569
- HOA & community: Clubhouse; Community pool
Exterior
- Parking: Carport; Assigned parking space #218 (space rent $1,345)
- Utilities: Public water; Private sewer; Public utilities
- Home design: Property primary ID 745625
- Exterior features: Roof described as 'Other (See Remarks)'; Leased land (park home site); Pet restrictions (number limits)
Interior
- Bedrooms: 2 bedrooms
- Bathrooms: 1 full bath; 1 half bath
- Heating & cooling: Heating: Other (see remarks)
- Interior features: Dining area; Heating described as 'Other (See Remarks)'
Neighborhood map
What this means for you Summary
Snapshot
- This is a 2-bed/1.5-bath manufactured listed at $169k.
Deal economics
- At list price, monthly cash flow is $1k ($14k/yr) — positive.
- The deal already cash-flows at list — no discount required.
- Meets the 1% rule at list price ($3k rent vs $169k).
- Recommended offer: $166k (1.5% below list) — sets the bar for market timing.
- Cap rate 14.7% vs local median 1.6% in San Jose — top-decile yield for the area; either an underpriced asset or a hidden risk that comps aren't pricing in. Stress-test before assuming the spread holds.
Location & tenants
- Location reads 78/100 on livability (#68 in CA, #2,559 nationally) — a middle-class / working-renter tenant base. Strengths: amenities A+, commute A+, employment A+; Watch: crime F, cost of living F.
- East Side Union High (urban): math 53% / reading 70% proficiency, ranked #69 of 517 in CA (top 13%) — acceptable for families but not a draw, mixed tenant base, ~2y average lease.
- Market conditions: Rents rising (+1.0%/yr); 65 active listings in the ZIP; 3 comparable units currently listed for rent nearby; rentals leasing fast (median 2d on market — plan ~1-2 weeks tenant-placement turnaround); solid renter incomes; 3,838 units permitted in Santa Clara County in 2024 (1,886 in 5+ unit buildings).
- This rent runs 35% of the median local income ($101k/yr) — at the standard rent-burdened threshold; future hikes will face affordability resistance.
Forward outlook
- Local home prices are declining (-3.0%/yr); year-one equity from $1k of loan paydown is wiped out by about $5k of value loss. Plan a longer hold.
- Santa Clara County population projected at +24% by 2050 — long-run rental-demand tailwind backs the buy-and-hold thesis.
- At projected returns (-3.0% appreciation + 1.0% rent growth), your $47k cash investment doubles in ~5 years — after that, you're playing with house money.
Negotiation context
- It's been on market 15 days — a 2% lower offer ($166k) is reasonable based on typical stale-listing flexibility.
- 2 sale attempts with the ask held roughly flat each time — persistent listings suggest the price (not the market) is what's stuck; bring a comps-based counter.
Risks & watch-outs
- Climate carrying-cost: extreme-heat days projected 7→14/yr by 2055 (HVAC capex compounding) — expect insurance premiums to compound above CPI over the hold.
Questions for the listing agent
- Is there a deadline driving the sale (1031 exchange, divorce, estate, relocation)? That informs how much negotiation room exists.
- Crime grade is F in this area — have there been break-ins, vandalism, or insurance claims at this property in the last 3 years? What carrier currently insures it and at what premium?
- What's the average days-on-market for RENTAL listings here right now (not sales)? A rising rental-DOM trend means longer vacancies and softer asking-rent achievability than the comps imply.
- What's the recent tenant-quality profile in this submarket — average credit score on applications, eviction rate, late-payment / NSF rate, and stable-employment percentage? A property-management company in the area should have these aggregated.
- How much new for-sale + rental construction is in the pipeline within 1–3 miles? Heavy new supply typically softens prices + rents 12–24 months out; constrained supply supports both.
Investment metrics
- 1% rule
- 1.76% ✓
- Cap rate
- 14.72%
- Cash-on-cash
- 30.09%
- DSCR
- 2.34
- GRM
- 4.7
CMA / ARV
- ARV (on-the-fly)
- $203,424
- Comps found
- 6
Show comp detail 6 sales within ~0.75 mi
| Address | Dist | Beds/Ba | Sqft | Sold | Price | $/sf | Match |
|---|---|---|---|---|---|---|---|
| 411 Lewis Rd #200 | 0.19mi | 2/1.0 | 570 (-9%) | 3mo | $197,000 | $346 | 72 |
| 2855 Senter Rd #63 | 0.30mi | 3/2.0 (+1) | 600 (-4%) | 1mo | $230,000 | $383 | 72 |
| 411 Lewis Rd #175 | 0.19mi | 2/2.0 | 636 (+2%) | 23mo | $191,000 | $300 | 66 |
| 411 Lewis Rd #299 | 0.00mi | 2/1.0 | 552 (-12%) | 16mo | $180,000 | $326 | 65 |
| 2855 Senter #95 | 0.30mi | 2/1.0 | 672 (+8%) | 8mo | $190,000 | $283 | 65 |
| 2580 Senter Rd #569 | 0.74mi | 1/1.0 (-1) | 552 (-12%) | 10mo | $170,000 | $308 | 30 |
Match score weights: distance 35% · size 25% · config 20% · recency 20%. Top-matched comps best support the ARV.
Projected returns pro-forma
-3.0% appreciation · 1.0% rent growth · sell at horizon
- IRR
- 22.4%
- Equity multiple
- 1.90×
- Total profit
- $42,355
- Equity at exit
- $25,198
- IRR
- 29.1%
- Equity multiple
- 3.35×
- Total profit
- $111,200
- Equity at exit
- $14,612
Cash invested: $47,320 (down + closing). Projections, not guarantees.
Landlord ↔ Tenant lean methodology
- Overall (CITY)
- 0 Strongly Tenant-Friendly
- State California
- 18 Strongly Tenant-Friendly · D+13
- County
- — inherits STATE
- City San Jose
- 0 Strongly Tenant-Friendly · D+24
ZIP-level market 95111
- Rents YoY
- 1.0%
- Active inventory
- 65
- Price-to-rent
- 4.7×
Monthly cashflow live
- Estimated rent
- $2,980 medium interval (Pro) →
- Mortgage (P&I)
- −$886
- Tax est. 1.5%
- −$211 /mo · $2,535/yr
- Insurance
- −$70
- HOA
- −$0
- Vacancy / Maint / Mgmt
- −$626
- Net cashflow
- $1,187
Break-even live
UW: 25.0% down · 7.5% · 30yr · 1.5% tax · 5.0% vac · 8.0% maint · 8.0% mgmt
Financing live
Cash to close
- Down payment
- $42,250
- Closing costs
- $5,070
- Reserves months
- —
- Total cash needed
- —
Loan-product check · same deal, 3 products live
Conventional
25% down · 7.5% · 30yr
- Down + closing
- —
- Monthly P&I
- —
- Monthly cashflow
- —
- DSCR
- —
- Eligible?
- —
Personal DTI + credit; lowest rate.
DSCR
20% down · 8.5% · 30yr
- Down + closing
- —
- Monthly P&I
- —
- Monthly cashflow
- —
- DSCR
- —
- Eligible?
- —
No personal income docs; deal must DSCR.
Hard money
10% down · 12.0% · 12mo
- Down + closing
- —
- Monthly P&I
- —
- Monthly cashflow
- —
- DSCR
- —
- Eligible?
- —
Short-term bridge; refi at stabilization.
Rent comps 3 comps
| Address | Beds | Baths | Sqft | Rent | $/sqft | DOM | Units | Dist |
|---|---|---|---|---|---|---|---|---|
| 2898 Villa Monterey San Jose, CA | 1.0–2.0 | 1.0 | 650 | $2,780 | $4.28 | 14d | 1 | 0.14mi |
| 200 Lewis Rd San Jose, CA | 1.0–3.0 | 1.0–2.0 | 867 | $2,551 | $2.94 | 1d | 1 | 0.31mi |
| 4300 The Woods Dr San Jose, CA | 3.0 | 1.0–3.5 | 918 | $3,484 | $3.80 | 1d | 1 | 1.34mi |
Listing history 11 events
-
2026-06-18days on market $169,000 Active 15 DOM
-
2026-06-17days on market $169,000 Active 14 DOM
-
2026-06-16days on market $169,000 Active 13 DOM
-
2026-06-15days on market $169,000 Active 12 DOM
-
2026-06-13days on market $169,000 Active 10 DOM
-
2026-06-13days on market $169,000 Active 9 DOM
-
2026-06-09days on market $169,000 Active 6 DOM
-
2026-06-08days on market $169,000 Active 5 DOM
-
2026-06-07days on market $169,000 Active 4 DOM
-
2026-06-05remarks 271-char remark
-
2026-06-05$169,000 Active 1 DOM
ⓘ Source: listings_history table (triggers on properties + properties_extension) + one-shot
backfill from property_details.listing_events for pre-trigger history.
Climate risk First Street
- Flood 1/10 Low FEMA zone D · 0% chance over 30 yrs
- Wildfire 1/10 Low
- Heat 5/10 Major 7 d/yr ≥95°F today · 14 d/yr by 30 yrs out
- Wind 1/10 Low
- Air quality 9/10 Extreme 19 unhealthy d/yr today · 19 by 30 yrs out
Nearby sold comps map
Loading sold comps map…
Walkable amenities ~0.75 mi
Loading nearby amenities…
Taxation est. · year 1
- Rental income
- $35,765
- − Mortgage interest
- −$9,467
- − Property taxes
- −$2,535
- − Insurance
- −$845
- − Repairs & maintenance
- −$2,861
- − Management
- −$2,861
- − Depreciation
- −$4,916
- Taxable income
- $12,280
- Est. tax owed @ 24.0%
- −$2,947
- After-tax cash flow
- $11,292/yr
For passive investors: Depreciation is non-cash, so a rental often shows a tax loss while cash-flowing — sheltering income. Rental losses are passive: they offset passive income freely, and up to $25,000/yr can offset ordinary (W-2) income if you actively participate and your MAGI is under $100k (phasing out to $0 by $150k); unused losses carry forward. On sale, claimed depreciation is recaptured at up to 25%, and gains may owe capital-gains tax (a 1031 exchange can defer both). Figures are a year-1 estimate at your 24.0% rate — not tax advice; consult a CPA.
Schools (NCES district)
- District
- East Side Union High
- NCES district ID
- 0611820
- Math proficiency
- 53% ▲ 12.00%
- Reading proficiency
- 70% ▲ 8.00%
- Median HH income
- $80,293
- Composite
- 55.15/100
- National rank
- #1278
- State rank
- #69 of 517 in CA
Livability — San Jose
- Score
- 78/100
- State rank
- #68
- US rank
- #2559
Category grades
Schools grade is shown separately in the Schools card above.
Census & demographics
- Census place
- San Jose, CA
- County
- Santa Clara County · 1,806,974 people
- City population
- 954,479
- Metro
- San Jose-Sunnyvale-Santa Clara, CA
- Population (ZIP)
- 57,202
- Household income
- $101,435
- Rent vs Own
- Severe rent burden
- 1808.0
Population outlook (Santa Clara County) Hauer SSP2
- Today (2025)
- 2,179,074 people
- By 2030
- 2,301,297 · +5.6%
- By 2040
- 2,528,195 · +16.0%
- By 2050
- 2,712,135 · +24.5%
- By 2075
- 2,998,701 · +37.6%
- By 2100
- 2,931,429 · +34.5%
Race, ethnicity, and origin ACS 2023
- Neighborhood character
- Diverse neighborhood (Simpson 0.60)
- Race & ethnicity
- Hispanic / Latino 51% Asian 36% Two or more races 22% White 7% Native American 2% Black 2%
- Hispanic origin (detail)
- Mexican 46%
- Foreign-born
- 45% · Canada, Vietnam, China
- Languages at home
- 27% English-only · Spanish 40% Vietnamese 24% Chinese 3%
Political lean MEDSL · Santa Clara
- 2024 margin
- Solid D (+40.0) · D 68.1% · R 28.1% · Other 3.8%
- 2008→2024 swing
- -0.9pp no change · 2008: 40.9pp · 2024: 40.0pp
- All cycles
- 2024: D+40.0 2020: D+47.4 2016: D+52.5 2012: D+42.1 2008: D+40.9
Not yet ingested
- Civics
- —
Market trends
- HPI YoY
- ▼ -1144.74%
- Current HPI
- 339.7949
- Rent YoY
- ▲ 1.00%
- Metro
- San Jose-Sunnyvale-Santa Clara, CA
- State GDP YoY
- ▲ 3.21%
- F500 in state
- 116
Industry mix (Fortune 500 HQ in CA)
| Industry | F500 HQs | Revenue |
|---|---|---|
| Technology | 27 | $1,492B |
|
||
| Financial Services | 3 | $174B |
|
||
| Retail | 3 | $44B |
|
||
| Insurance | 3 | $26B |
|
||
| Media / Entertainment | 2 | $115B |
|
||
| Pharmaceuticals / Biotech | 2 | $62B |
|
||
Price history
+0.0% since first listed2 events — show timeline
- 2026-06-03 Listed $169,000 MLSListings
- 2026-06-03 Listed $169,000 bridgeMLS, Bay East AOR, or Contra Costa AOR
Property tax history
-11.0%/yrLatest (2011): $174 · -15.1% YoY. Source: county tax records.
Cash-flow waterfall
monthlySold comps — $/sqft
last 12 mo · ≤1 miLoading sold comps…