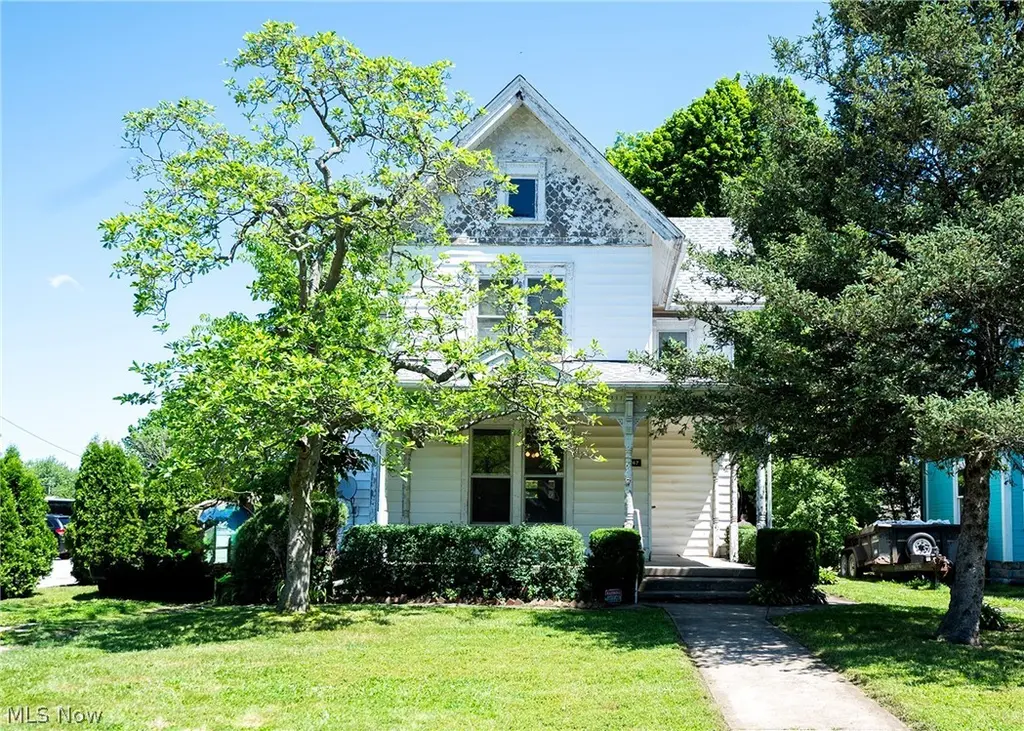
247 & 247 1/2 Ray Ave NW · New Philadelphia, OH
Flood risk 1/10 · Minimal
- FEMA flood zone
- X (unshaded)
- Chance of flooding over 30 yrs
- 0.0%
- Est. flood insurance / yr
- $473 – $860
Fire risk 3/10 · Minor
- Est. fire insurance / yr
- $713 – $1,323
Heat risk 4/10 · Minor
- Hot days now (above 98°F)
- 7 days/yr
- Hot days in 30 yrs
- 17 days/yr
Wind risk 1/10 · Minimal
- Chance of severe wind over 30 yrs
- —
Air-quality risk 2/10 · Minimal
- Unhealthy air days now
- 1 days/yr
- Unhealthy air days in 30 yrs
- 2 days/yr
Risk factors via First Street. Map © Google.
Why this score? — see what drove the C- grade
The composite is a weighted blend of 9 inputs, each scored 0–100. Each bar is that input's sub-score; the figure is the points it added to the 100-point composite (weight × sub-score).
- ARV discount +15.0/15.0
- Cash flow +14.5/30.0
- Schools +5.3/10.0
- DSCR +4.4/10.0
- 1% rule +4.0/10.0
- Livability +3.8/5.0
- Rent growth +2.5/5.0
- Condition / age +2.2/5.0
- Appreciation +0.0/10.0
$159,000
🖨 Deal sheet (PDF) 📄 Offer letter ✓ Due diligence
Listing remarks
Fantastic investment opportunity in the heart of New Philadelphia! This charming up-and-down duplex features two spacious units, each offering 2 bedrooms, 1 full bathroom, and a large eat-in kitchen and living room. Enjoy the added convenience of a first-floor laundry area for the lower unit and a dedicated upper-level laundry room. Major updates include a brand-new shingle roof installed in May 2026, complete with a transferable warranty for peace of mind. The property boasts ample on-site rear parking with easy alleyway access. Perfect for an investor looking to add a solid income producer to their portfolio or an owner-occupant looking to house-hack. Schedule your private showing today!
Key facts
- Large eat-in kitchen
- Up-and-down duplex
- 8,197 sq ft lot
Tags
Property features AI
Exterior
- Parking: Alley access; Driveway; On-street parking
- Utilities: Public water; Public sewer
- Home design: 2 stories; Shingle roof; Vinyl siding; Block foundation
- Construction: Built (year source: public records)
- Exterior features: Front porch; Shed(s); City lot; Lot approximately 50 x 164
Interior
- Kitchen: Range; Refrigerator
- Bedrooms: 2 main-level bedrooms
- Bathrooms: 2 full bathrooms; 1 main-level bathroom
- Heating & cooling: Forced air heating (gas); Window unit cooling
- Interior features: Eat-in kitchen; High ceilings; Full unfinished walk-out basement
- Laundry & utility: Washer; Dryer; Main-level laundry
Neighborhood map
What this means for you Summary
Snapshot
- This is a 4-bed/2.0-bath single-family listed at $159k. Condition is rated fair.
Deal economics
- At list price, monthly cash flow is $35 ($418/yr) — positive.
- The deal already cash-flows at list — no discount required.
- To meet the 1% rule (rent ≥ 1% of price), the offer needs to be $143k (9.8% below list).
- Recommended offer: $143k (9.8% below list) — sets the bar for 1% rule.
- Cap rate 6.6% vs local median 2.6% in New Philadelphia — top-decile yield for the area; either an underpriced asset or a hidden risk that comps aren't pricing in. Stress-test before assuming the spread holds.
Location & tenants
- Location reads 75/100 on livability (#265 in OH, #4,229 nationally) — a middle-class / working-renter tenant base. Strengths: crime A+, cost of living A+, housing A+; Watch: employment D, amenities F, commute F.
- New Philadelphia City (town): math 61% / reading 66% proficiency, ranked #248 of 656 in OH (top 38%) — acceptable for families but not a draw, mixed tenant base, ~2y average lease.
- Zoned schools: New Philadelphia High School (math 42% / reading 64%, grade C-, #338 of 781 statewide, top 43%, 744 students, 36% FRL) — zoned schools at 36% FRL track the district average.
- Market conditions: 72 active listings in the ZIP; 244 units permitted in Tuscarawas County in 2024 (0 in 5+ unit buildings).
Forward outlook
- Local home prices are declining (-3.0%/yr); year-one equity from $1k of loan paydown is wiped out by about $5k of value loss. Plan a longer hold.
- Tuscarawas County population projected to shrink 10% by 2050 — rents likely to lag national; underwrite the cash flow, not the appreciation.
Negotiation context
- It's been on market 23 days — a 2% lower offer ($157k) is reasonable based on typical stale-listing flexibility.
Risks & watch-outs
- Watch-outs: built in 1884 — expect roof / HVAC / electrical / plumbing capex.
Questions for the listing agent
- Have any recent inspections been done? Can we get a copy of the seller's disclosures and any deferred-maintenance estimates?
- Built in 1884 — when were the roof, HVAC, electrical panel, plumbing, and water heater last replaced?
- Is there a deadline driving the sale (1031 exchange, divorce, estate, relocation)? That informs how much negotiation room exists.
- Schools are B-rated — typically a magnet for longer-tenancy family renters. What's the average tenant stay here, and is there a school-zone premium baked into asking?
- What's the average days-on-market for RENTAL listings here right now (not sales)? A rising rental-DOM trend means longer vacancies and softer asking-rent achievability than the comps imply.
- What's the recent tenant-quality profile in this submarket — average credit score on applications, eviction rate, late-payment / NSF rate, and stable-employment percentage? A property-management company in the area should have these aggregated.
- How much new for-sale + rental construction is in the pipeline within 1–3 miles? Heavy new supply typically softens prices + rents 12–24 months out; constrained supply supports both.
Investment metrics
- 1% rule
- 0.90% ✗
- Cap rate
- 6.56%
- Cash-on-cash
- 0.94%
- DSCR
- 1.04
- GRM
- 9.2
CMA / ARV
- ARV (on-the-fly)
- $283,880
- Comps found
- 12
Show comp detail 12 sales within ~0.75 mi
| Address | Dist | Beds/Ba | Sqft | Sold | Price | $/sf | Match |
|---|---|---|---|---|---|---|---|
| 403 5th St NW | 0.23mi | 4/2.0 | 2,016 (+7%) | 8mo | $120,000 | $60 | 71 |
| 360 3rd St NW | 0.16mi | 4/3.0 | 1,725 (-8%) | 8mo | $259,900 | $151 | 68 |
| 419 3rd St NW | 0.22mi | 3/2.0 (-1) | 1,704 (-9%) | 7mo | $269,900 | $158 | 63 |
| 409 Kelly St NW | 0.28mi | 3/2.0 (-1) | 1,751 (-7%) | 9mo | $150,000 | $86 | 63 |
| 913 Oak St NW | 0.62mi | 3/2.0 (-1) | 1,839 (-2%) | 2mo | $315,000 | $171 | 60 |
| 916 Oak St NW | 0.63mi | 3/2.5 (-1) | 1,908 (+2%) | 4mo | $299,900 | $157 | 58 |
| 942 Maple Ave NW | 0.64mi | 3/1.5 (-1) | 1,913 (+2%) | 9mo | $187,000 | $98 | 53 |
| 859 Orchard Ave NW | 0.73mi | 3/1.5 (-1) | 1,938 (+3%) | 4mo | $255,000 | $132 | 50 |
| 470 4th St NE | 0.67mi | 4/3.0 | 1,754 (-7%) | 9mo | $265,000 | $151 | 46 |
| 919 Oak St NW | 0.64mi | 3/3.0 (-1) | 1,780 (-5%) | 8mo | $385,535 | $217 | 46 |
| 214 2nd St SE | 0.57mi | 3/1.0 (-1) | 1,648 (-12%) | 5mo | $150,000 | $91 | 40 |
| 671 Orchard Ave NW | 0.66mi | 3/1.5 (-1) | 1,608 (-14%) | 8mo | $257,000 | $160 | 31 |
Match score weights: distance 35% · size 25% · config 20% · recency 20%. Top-matched comps best support the ARV.
Projected returns pro-forma
-3.0% appreciation · 3.0% rent growth · sell at horizon
- IRR
- -14.8%
- Equity multiple
- 0.47×
- Total profit
- $-23,526
- Equity at exit
- $23,707
- IRR
- -6.1%
- Equity multiple
- 0.61×
- Total profit
- $-17,544
- Equity at exit
- $13,747
Cash invested: $44,520 (down + closing). Projections, not guarantees.
Landlord ↔ Tenant lean methodology
- Overall (STATE)
- 73 Landlord-Friendly
- State Ohio
- 73 Landlord-Friendly · R+6
- County
- — inherits STATE
- City
- — inherits STATE
ZIP-level market 44663
- Active inventory
- 72
- Price-to-rent
- 9.2×
Monthly cashflow live
- Estimated rent
- $1,435 medium interval (Pro) →
- Mortgage (P&I)
- −$834
- Tax est. 1.5%
- −$199 /mo · $2,385/yr
- Insurance
- −$66
- HOA
- −$0
- Vacancy / Maint / Mgmt
- −$301
- Net cashflow
- $35
Break-even live
Sensitivity live
| Price | -10% $145 | -5% $90 | +0% $35 | +5% $-20 | +10% $-75 |
|---|---|---|---|---|---|
| Rent | -10% $-79 | -5% $-22 | +0% $35 | +5% $91 | +10% $148 |
| Rate | -1.0pp $115 | -0.5pp $75 | base $35 | +0.5pp $-6 | +1.0pp $-48 |
UW: 25.0% down · 7.5% · 30yr · 1.5% tax · 5.0% vac · 8.0% maint · 8.0% mgmt
Financing live
Cash to close
- Down payment
- $39,750
- Closing costs
- $4,770
- Reserves months
- —
- Total cash needed
- —
Loan-product check · same deal, 3 products live
Conventional
25% down · 7.5% · 30yr
- Down + closing
- —
- Monthly P&I
- —
- Monthly cashflow
- —
- DSCR
- —
- Eligible?
- —
Personal DTI + credit; lowest rate.
DSCR
20% down · 8.5% · 30yr
- Down + closing
- —
- Monthly P&I
- —
- Monthly cashflow
- —
- DSCR
- —
- Eligible?
- —
No personal income docs; deal must DSCR.
Hard money
10% down · 12.0% · 12mo
- Down + closing
- —
- Monthly P&I
- —
- Monthly cashflow
- —
- DSCR
- —
- Eligible?
- —
Short-term bridge; refi at stabilization.
Listing history 17 events
-
2026-06-21days on market $159,000 Active 23 DOM
-
2026-06-21days on market $159,000 Active 22 DOM
-
2026-06-18days on market $159,000 Active 20 DOM
-
2026-06-17days on market $159,000 Active 19 DOM
-
2026-06-16days on market $159,000 Active 18 DOM
-
2026-06-15days on market $159,000 Active 17 DOM
-
2026-06-13days on market $159,000 Active 15 DOM
-
2026-06-12days on market $159,000 Active 14 DOM
-
2026-06-09days on market $159,000 Active 11 DOM
-
2026-06-08days on market $159,000 Active 10 DOM
-
2026-06-08days on market $159,000 Active 9 DOM
-
2026-06-07days on market $159,000 Active 8 DOM
-
2026-06-04days on market $159,000 Active 5 DOM
-
2026-06-02days on market $159,000 Active 4 DOM
-
2026-06-01days on market $159,000 Active 3 DOM
-
2026-05-31days on market $159,000 Active 2 DOM
-
2026-05-29$159,000 Active
ⓘ Source: listings_history table (triggers on properties + properties_extension) + one-shot
backfill from property_details.listing_events for pre-trigger history.
Climate risk First Street
- Flood 1/10 Low FEMA zone X (unshaded) · 0% chance over 30 yrs
- Wildfire 3/10 Moderate
- Heat 4/10 Moderate 7 d/yr ≥98°F today · 17 d/yr by 30 yrs out
- Wind 1/10 Low
- Air quality 2/10 Low 1 unhealthy d/yr today · 2 by 30 yrs out
Nearby sold comps map
Loading sold comps map…
Walkable amenities ~0.75 mi
Loading nearby amenities…
Taxation est. · year 1
- Rental income
- $17,220
- − Mortgage interest
- −$8,906
- − Property taxes
- −$2,385
- − Insurance
- −$795
- − Repairs & maintenance
- −$1,378
- − Management
- −$1,378
- − Depreciation
- −$4,625
- Taxable loss
- −$2,248
- Est. tax savings @ 24.0%
- +$539
- After-tax cash flow
- $957/yr
For passive investors: Depreciation is non-cash, so a rental often shows a tax loss while cash-flowing — sheltering income. Rental losses are passive: they offset passive income freely, and up to $25,000/yr can offset ordinary (W-2) income if you actively participate and your MAGI is under $100k (phasing out to $0 by $150k); unused losses carry forward. On sale, claimed depreciation is recaptured at up to 25%, and gains may owe capital-gains tax (a 1031 exchange can defer both). Figures are a year-1 estimate at your 24.0% rate — not tax advice; consult a CPA.
Condition & rehab AI · 13 photos
This property requires significant exterior and interior updates, including painting, flooring replacement, and landscaping maintenance, to improve its condition and value.
Repairs flagged
- Major roof — The satellite image shows a shingle roof, but the listing photo suggests a new roof was installed in May 2026, which is not visible in the satellite image.
- Major exterior siding — The exterior siding appears weathered and in need of repainting.
- Major flooring — The flooring in the kitchen and bathrooms appears dated and in need of replacement.
- Major interior walls/paint — The interior walls and paint appear dated and in need of updating.
- Major landscaping — The landscaping and fencing appear overgrown and in need of maintenance.
Value-add opportunities
- Both Painting the exterior and interior walls — Fresh paint can significantly improve the curb appeal and interior aesthetics, enhancing both resale and rental value.
- Both Landscaping and fencing maintenance — Well-maintained landscaping and fencing can improve the overall appearance and increase the property's value.
- Both Flooring replacement — Replacing dated flooring in the kitchen and bathrooms can improve the overall look and functionality of the space, enhancing both resale and rental value.
Renovation cost estimate screening
| Repair item | Severity | Est. cost |
|---|---|---|
| roof · The satellite image shows a shingle roof, but the listing photo suggests a new roof was installed in May 2026, which is not visible in the satellite image. | Major | $15,000–50,000 |
| exterior siding · The exterior siding appears weathered and in need of repainting. | Major | $15,000–50,000 |
| flooring · The flooring in the kitchen and bathrooms appears dated and in need of replacement. | Major | $15,000–50,000 |
| interior walls/paint · The interior walls and paint appear dated and in need of updating. | Major | $15,000–50,000 |
| landscaping · The landscaping and fencing appear overgrown and in need of maintenance. | Major | $15,000–50,000 |
| Total estimated repair cost · 5 items | $75,000–250,000 |
Value-add ROI direction
- Both Painting the exterior and interior walls — Fresh paint can significantly improve the curb appeal and interior aesthetics, enhancing both resale and rental value. ↑
- Both Landscaping and fencing maintenance — Well-maintained landscaping and fencing can improve the overall appearance and increase the property's value. ↑
- Both Flooring replacement — Replacing dated flooring in the kitchen and bathrooms can improve the overall look and functionality of the space, enhancing both resale and rental value. ↑
ⓘ Cost ranges are severity-bucket heuristics (US national rule-of-thumb). Get contractor quotes + a written scope before underwriting a rehab budget.
Schools (NCES district)
- District
- New Philadelphia City
- NCES district ID
- 3904448
- Math proficiency
- 61% ▼ -5.00%
- Reading proficiency
- 66% ▼ -3.00%
- Median HH income
- $42,895
- Composite
- 53.28/100
- National rank
- #1490
- State rank
- #248 of 656 in OH
Livability — New Philadelphia
- Score
- 75/100
- State rank
- #265
- US rank
- #4229
Category grades
Schools grade is shown separately in the Schools card above.
Census & demographics
- Census place
- New Philadelphia, OH
- County
- Tuscarawas · 99,287 people
- City population
- 24,732
- Population (ZIP)
- 24,732
- Household income
- $62,383
- Rent vs Own
- Severe rent burden
- 20.1
Population outlook (Tuscarawas County) Hauer SSP2
- Today (2025)
- 92,253 people
- By 2030
- 91,060 · -1.3%
- By 2040
- 87,479 · -5.2%
- By 2050
- 83,174 · -9.8%
- By 2075
- 72,000 · -22.0%
- By 2100
- 58,574 · -36.5%
Race, ethnicity, and origin ACS 2023
- Neighborhood character
- Predominantly White (88%)
- Race & ethnicity
- White 88% Hispanic / Latino 8% Two or more races 3% Asian 1%
- Hispanic origin (detail)
- Puerto Rican 5%
- Common ancestry
- Slovak 3% Serbian 2% Lithuanian 2%
- Foreign-born
- 4% · Canada
- Languages at home
- 91% English-only · Spanish 6% German/W. Germanic 1% Other Indo-European 1%
Political lean MEDSL · Tuscarawas
- 2024 margin
- Solid R (+43.3) · D 28.0% · R 71.2%
- 2008→2024 swing
- -45.7pp toward R · 2008: 2.4pp · 2024: -43.3pp
- All cycles
- 2024: R+43.3 2020: R+39.9 2016: R+35.5 2012: R+9.8 2008: D+2.4
Not yet ingested
- Civics
- —
Market trends
- HPI YoY
- ▼ -201.12%
- Current HPI
- 180.4068
- Rent YoY
- —
- Metro
- —
- State GDP YoY
- ▲ 1.98%
- F500 in state
- 48
Industry mix (Fortune 500 HQ in OH)
| Industry | F500 HQs | Revenue |
|---|---|---|
| Insurance | 3 | $145B |
|
||
| Industrial Machinery | 3 | $49B |
|
||
| Financial Services | 3 | $24B |
|
||
| Consumer Goods | 2 | $93B |
|
||
| Aerospace / Defense | 2 | $47B |
|
||
| Utilities | 2 | $33B |
|
||
Price history
1 event — show timeline
- 2026-05-29 Listed $159,000 MLSNOW
Cash-flow waterfall
monthlySold comps — $/sqft
last 12 mo · ≤1 miLoading sold comps…