1831 Fuller Rd · West Des Moines, IA
Flood risk No data
- FEMA flood zone
- —
- Chance of flooding over 30 yrs
- —
- Est. flood insurance / yr
- —
Fire risk No data
- Est. fire insurance / yr
- —
Heat risk No data
- Hot days now (above threshold)
- —
- Hot days in 30 yrs
- —
Wind risk No data
- Chance of severe wind over 30 yrs
- —
Air-quality risk No data
- Unhealthy air days now
- —
- Unhealthy air days in 30 yrs
- —
Risk factors via First Street. Map © Google.
Why this score? — see what drove the D+ grade
The composite is a weighted blend of 9 inputs, each scored 0–100. Each bar is that input's sub-score; the figure is the points it added to the 100-point composite (weight × sub-score).
- Cash flow +16.6/30.0
- ARV discount +7.5/15.0
- 1% rule +6.7/10.0
- Schools +6.0/10.0
- DSCR +5.2/10.0
- Livability +4.4/5.0
- Rent growth +2.4/5.0
- Condition / age +1.0/5.0
- Appreciation +0.0/10.0
$89,900
🖨 Deal sheet 📄 Offer letter ✓ Due diligence
Listing remarks MLS
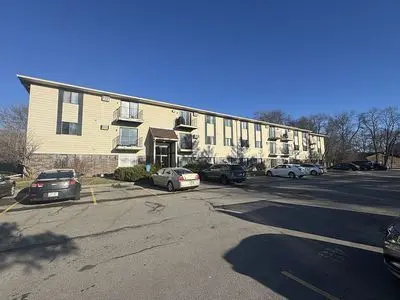
2 br condo in average condition in good location in West Des Moines.
Key facts
- Added privacy
- Corner-unit condo
- Built 1979
Tags
Neighborhood map
What this means for you Summary
Snapshot
- This is a 2-bed/1.0-bath condo listed at $90k. Condition is rated poor.
Deal economics
- At list price, monthly cash flow is $54 ($653/yr) — positive.
- The deal already cash-flows at list — no discount required.
- Meets the 1% rule at list price ($1k rent vs $90k).
- Recommended offer: $87k (3.0% below list) — sets the bar for market timing.
- Cap rate 7.0% vs local median 2.5% in West Des Moines — top-decile yield for the area; either an underpriced asset or a hidden risk that comps aren't pricing in. Stress-test before assuming the spread holds.
Location & tenants
- Location reads 87/100 on livability (#11 in IA, #336 nationally) — a professional / high-income tenant draw. Strengths: schools A+, amenities A+, cost of living A+; Watch: commute F.
- West Des Moines Community School District (urban): math 66% / reading 71% proficiency, ranked #133 of 289 in IA (top 46%) — acceptable for families but not a draw, mixed tenant base, ~2y average lease.
- Market conditions: Rents soft (-0.2%/yr); 294 active listings in the ZIP; 3 comparable units currently listed for rent nearby; rentals lingering (median 44d on market — plan ~5-8 weeks vacancy on turnover, expect pricing pressure); 67% of comp listings sitting > 30 days — soft ceiling on asking rent; solid renter incomes; 2,953 units permitted in Polk County in 2024 (540 in 5+ unit buildings).
- This rent is only 15% of the median local income ($86k/yr) — well below the 30% rent-burden line; pricing power to push rent on renewal without tenant pushback.
Forward outlook
- Local home prices are declining (-3.0%/yr); year-one equity from $622 of loan paydown is wiped out by about $3k of value loss. Plan a longer hold.
- Polk County population projected at +37% by 2050 — long-run rental-demand tailwind backs the buy-and-hold thesis.
Negotiation context
- It's been on market 37 days — a 3% lower offer ($87k) is reasonable based on typical stale-listing flexibility.
- 6 sale attempts since 12y ago with the ask held roughly flat each time — persistent listings suggest the price (not the market) is what's stuck; bring a comps-based counter.
- Current owner paid $38k; list at $90k implies a 138% gain — meaningful room to come down on a strong offer.
Questions for the listing agent
- It's been on market 37 days. Have you received any prior offers? Is the seller open to a 3% concession, seller financing, or rate buy-down credit?
- Have any recent inspections been done? Can we get a copy of the seller's disclosures and any deferred-maintenance estimates?
- Built in 1979 — when were the roof, HVAC, electrical panel, plumbing, and water heater last replaced?
- What does the HOA fee cover, when was the last increase, and are there any pending special assessments or reserve-fund shortfalls?
- Any open or pending special assessments — roof, HVAC, plumbing, elevator, façade? What's the per-unit balance and payoff schedule, and is the seller paying it off at close or rolling it to the buyer?
- Is there a deadline driving the sale (1031 exchange, divorce, estate, relocation)? That informs how much negotiation room exists.
- Schools are A-rated — typically a magnet for longer-tenancy family renters. What's the average tenant stay here, and is there a school-zone premium baked into asking?
- The area grade is low — what's the realistic commute time and amenity access for the typical tenant pool here? Any planned neighborhood developments (good or bad) we should know about?
- What's the average days-on-market for RENTAL listings here right now (not sales)? A rising rental-DOM trend means longer vacancies and softer asking-rent achievability than the comps imply.
- What's the recent tenant-quality profile in this submarket — average credit score on applications, eviction rate, late-payment / NSF rate, and stable-employment percentage? A property-management company in the area should have these aggregated.
- How much new apartment / multifamily construction is in the pipeline within 1–3 miles? Heavy new supply (>2% of stock underway) typically softens rents 12–24 months out; light construction supports rent growth.
Investment metrics
- 1% rule
- 1.17% ✓
- Cap rate
- 7.02%
- Cash-on-cash
- 2.59%
- DSCR
- 1.12
- GRM
- 7.1
CMA / ARV
No comps found within radius.
Projected returns pro-forma
-3.0% appreciation · 0.0% rent growth · sell at horizon
- IRR
- -16.3%
- Equity multiple
- 0.44×
- Total profit
- $-14,071
- Equity at exit
- $13,404
- IRR
- -16.5%
- Equity multiple
- 0.24×
- Total profit
- $-19,247
- Equity at exit
- $7,773
Cash invested: $25,172 (down + closing). Projections, not guarantees.
Landlord ↔ Tenant lean methodology
- Overall (STATE)
- 83 Strongly Landlord-Friendly
- State Iowa
- 83 Strongly Landlord-Friendly · R+6
- County
- — inherits STATE
- City
- — inherits STATE
ZIP-level market 50265
- Rents YoY
- -0.2%
- Active inventory
- 294
- Price-to-rent
- 7.1×
Monthly cashflow live
- Estimated rent
- $1,052 medium interval (Pro) →
- Mortgage (P&I)
- −$471
- Tax est. 1.5%
- −$112 /mo · $1,348/yr
- Insurance
- −$37
- HOA est. from 3 same-building comps
- −$155
- Vacancy / Maint / Mgmt
- −$221
- Net cashflow
- $54
Break-even live
UW: 25.0% down · 7.5% · 30yr · 1.5% tax · 5.0% vac · 8.0% maint · 8.0% mgmt
Financing live
Cash to close
- Down payment
- $22,475
- Closing costs
- $2,697
- Reserves months
- —
- Total cash needed
- —
Loan-product check · same deal, 3 products live
Conventional
25% down · 7.5% · 30yr
- Down + closing
- —
- Monthly P&I
- —
- Monthly cashflow
- —
- DSCR
- —
- Eligible?
- —
Personal DTI + credit; lowest rate.
DSCR
20% down · 8.5% · 30yr
- Down + closing
- —
- Monthly P&I
- —
- Monthly cashflow
- —
- DSCR
- —
- Eligible?
- —
No personal income docs; deal must DSCR.
Hard money
10% down · 12.0% · 12mo
- Down + closing
- —
- Monthly P&I
- —
- Monthly cashflow
- —
- DSCR
- —
- Eligible?
- —
Short-term bridge; refi at stabilization.
Rent comps 3 comps
| Address | Beds | Baths | Sqft | Rent | $/sqft | DOM | Units | Dist |
|---|---|---|---|---|---|---|---|---|
| 1831 Fuller Rd #3 West Des Moines, IA | 2.0 | 1.0 | 740 | $995 | $1.34 | 21d | 1 | 0.01mi |
| 2120 Grand Ave Unit 2168-19 West Des Moines, IA | 1.0 | 1.0 | 650 | $895 | $1.38 | 43d | 1 | 0.22mi |
| 2210 EP True Pkwy West Des Moines, IA | 1.0–3.0 | 1.0–2.0 | 843 | $973 | $1.15 | 43d | 17 | 0.68mi |
HOA detail condo
- Monthly dues
- $0 · $0/yr
- Assessments
- None detected in remarks — confirm with the listing agent.
Listing history 25 events
-
2026-06-18days on market $89,900 Active 37 DOM
-
2026-06-17days on market $89,900 Active 36 DOM
-
2026-06-16days on market $89,900 Active 35 DOM
-
2026-06-15days on market $89,900 Active 34 DOM
-
2026-06-14days on market $89,900 Active 32 DOM
-
2026-06-10days on market $89,900 Active 29 DOM
-
2026-06-09days on market $89,900 Active 28 DOM
-
2026-06-08days on market $89,900 Active 27 DOM
-
2026-06-07days on market $89,900 Active 26 DOM
-
2026-06-03days on market $89,900 Active 22 DOM
-
2026-06-02days on market $89,900 Active 21 DOM
-
2026-06-01days on market $89,900 Active 20 DOM
-
2026-05-31days on market $89,900 Active 19 DOM
-
2026-05-31days on market $89,900 Active 18 DOM
-
2026-05-12$89,900 Active 870-char remark
-
2025-02-20historical $895
-
2025-02-04$895
-
2025-01-03historical $895
-
2024-09-10$895
-
2024-06-26historical $900
-
2024-03-26$900
-
2016-03-10soldstatus $37,799 68-char remark
Show marketing remark (68 chars)
2 br condo in average condition in good location in West Des Moines.
-
2015-09-23$42,500 68-char remark
Show marketing remark (68 chars)
2 br condo in average condition in good location in West Des Moines.
-
2014-09-02soldstatus $50,000
Show marketing remark (529 chars)
Own this WDM condo, cheaper than rent. 2 bedroom end unit located on the 2nd floor with a secured entrance with intercom. Kitchen boast plenty of cabinet space, new dishwasher and breakfast bar opens to the living room with sliders to the patio fit for a gas grill. Master bedroom with new carpet, full bath with newer wainscoting, additional 2nd bedroom and linen closet. All electric baseboard heat, fresh paint in many of the rooms, newer water heater and ceiling fans. Within walking distance of Raccoon River walking trails.
-
2014-04-10$51,500
Show marketing remark (529 chars)
Own this WDM condo, cheaper than rent. 2 bedroom end unit located on the 2nd floor with a secured entrance with intercom. Kitchen boast plenty of cabinet space, new dishwasher and breakfast bar opens to the living room with sliders to the patio fit for a gas grill. Master bedroom with new carpet, full bath with newer wainscoting, additional 2nd bedroom and linen closet. All electric baseboard heat, fresh paint in many of the rooms, newer water heater and ceiling fans. Within walking distance of Raccoon River walking trails.
ⓘ Source: listings_history table (triggers on properties + properties_extension) + one-shot
backfill from property_details.listing_events for pre-trigger history.
Nearby sold comps map
Loading sold comps map…
Walkable amenities ~0.75 mi
Loading nearby amenities…
Taxation est. · year 1
- Rental income
- $12,618
- − Mortgage interest
- −$5,036
- − Property taxes
- −$1,348
- − Insurance
- −$450
- − Repairs & maintenance
- −$1,009
- − Management
- −$1,009
- − HOA
- −$1,860
- − Depreciation
- −$2,615
- Taxable loss
- −$710
- Est. tax savings @ 24.0%
- +$170
- After-tax cash flow
- $823/yr
For passive investors: Depreciation is non-cash, so a rental often shows a tax loss while cash-flowing — sheltering income. Rental losses are passive: they offset passive income freely, and up to $25,000/yr can offset ordinary (W-2) income if you actively participate and your MAGI is under $100k (phasing out to $0 by $150k); unused losses carry forward. On sale, claimed depreciation is recaptured at up to 25%, and gains may owe capital-gains tax (a 1031 exchange can defer both). Figures are a year-1 estimate at your 24.0% rate — not tax advice; consult a CPA.
Condition & rehab AI · 1 photo
This corner-unit condo in Garden Ridge Condominiums requires extensive repairs and updates to bring it up to current standards, significantly impacting its resale and rental value.
Repairs flagged
- Major exterior siding — Significant wear and tear
- Major roof — No visible damage, but age is implied
- Major interior walls/paint — No visible interior, but age is implied
- Major bathrooms — No visible bathrooms, but age is implied
- Major kitchen — No visible kitchen, but age is implied
- Major systems — No visible systems, but age is implied
Value-add opportunities
- Resale exterior siding repair — Fresh siding enhances curb appeal
- Resale roof replacement — New roof improves property value
- Resale interior paint — Fresh paint makes interior look new
- Rental bathroom updates — Modern bathrooms attract renters
- Rental kitchen updates — Upgraded kitchen appeals to renters
- Both system upgrades — Modern systems improve comfort and energy efficiency
Renovation cost estimate screening
| Repair item | Severity | Est. cost |
|---|---|---|
| exterior siding · Significant wear and tear | Major | $15,000–50,000 |
| roof · No visible damage, but age is implied | Major | $15,000–50,000 |
| interior walls/paint · No visible interior, but age is implied | Major | $15,000–50,000 |
| bathrooms · No visible bathrooms, but age is implied | Major | $15,000–50,000 |
| kitchen · No visible kitchen, but age is implied | Major | $15,000–50,000 |
| systems · No visible systems, but age is implied | Major | $15,000–50,000 |
| Total estimated repair cost · 6 items | $90,000–300,000 |
Value-add ROI direction
- Resale exterior siding repair — Fresh siding enhances curb appeal ↑
- Resale roof replacement — New roof improves property value ↑
- Resale interior paint — Fresh paint makes interior look new ↑
- Rental bathroom updates — Modern bathrooms attract renters ↑
- Rental kitchen updates — Upgraded kitchen appeals to renters ↑
- Both system upgrades — Modern systems improve comfort and energy efficiency ↑
ⓘ Cost ranges are severity-bucket heuristics (US national rule-of-thumb). Get contractor quotes + a written scope before underwriting a rehab budget.
Schools (NCES district)
- District
- West Des Moines Community School District
- NCES district ID
- 1930930
- Math proficiency
- 66% ▼ -9.00%
- Reading proficiency
- 71% ▬ 0.00%
- Median HH income
- $69,043
- Composite
- 59.93/100
- National rank
- #878
- State rank
- #133 of 289 in IA
Livability — West Des Moines
- Score
- 87/100
- State rank
- #11
- US rank
- #336
Category grades
Schools grade is shown separately in the Schools card above.
Census & demographics
- Census place
- West Des Moines, IA
- County
- Polk County · 453,298 people
- City population
- 71,011
- Metro
- Des Moines-West Des Moines, IA
- Population (ZIP)
- 33,488
- Household income
- $85,915
- Rent vs Own
- Severe rent burden
- 741.0
Population outlook (Polk County) Hauer SSP2
- Today (2025)
- 548,042 people
- By 2030
- 588,557 · +7.4%
- By 2040
- 670,629 · +22.4%
- By 2050
- 752,830 · +37.4%
- By 2075
- 955,069 · +74.3%
- By 2100
- 1,115,436 · +103.5%
Race, ethnicity, and origin ACS 2023
- Neighborhood character
- Predominantly White (77%)
- Race & ethnicity
- White 77% Hispanic / Latino 7% Two or more races 7% Asian 6% Black 4%
- Hispanic origin (detail)
- Mexican 5%
- Common ancestry
- Portuguese 4% Italian 3% Iranian 2%
- Foreign-born
- 10% · Canada, Vietnam, South Korea
- Languages at home
- 87% English-only · Spanish 5% Other Asian/Pacific 2% Chinese 1%
Political lean MEDSL · Polk
- 2024 margin
- D (+10.9) · D 54.8% · R 43.9% · Other 1.3%
- 2008→2024 swing
- -3.7pp toward R · 2008: 14.6pp · 2024: 10.9pp
- All cycles
- 2024: D+10.9 2020: D+15.2 2016: D+11.5 2012: D+14.2 2008: D+14.6
Not yet ingested
- Civics
- —
Market trends
- HPI YoY
- ▼ -206.46%
- Current HPI
- 220.1776
- Rent YoY
- ▼ -0.21%
- Metro
- Des Moines-West Des Moines, IA
- State GDP YoY
- ▲ 2.48%
- F500 in state
- 4
Industry mix (Fortune 500 HQ in IA)
| Industry | F500 HQs | Revenue |
|---|---|---|
| Financial Services | 1 | $16B |
|
||
| Retail / Convenience | 1 | $15B |
|
||
Price history
+74.6% since first listed11 events — show timeline
- 2026-05-12 Listed $89,900 FSBO.com
- 2025-02-20 Rental Removed $895 RENT.
- 2025-02-04 Listed for Rent $895 RENT.
- 2025-01-03 Rental Removed $895 RENT.
- 2024-09-10 Listed for Rent $895 RENT.
- 2024-06-26 Rental Removed $900 RENT.
- 2024-03-26 Listed for Rent $900 RENT.
- 2016-03-10 Sold (MLS) $37,799 CIBOR
- 2015-09-23 Listed $42,500 CIBOR
- 2014-09-02 Sold (MLS) $50,000 DMMLS
- 2014-04-10 Listed $51,500 DMMLS
Cash-flow waterfall
monthlySold comps — $/sqft
last 12 mo · ≤1 miLoading sold comps…