320 Reds Pt · South Toledo Bend, TX
Flood risk No data
- FEMA flood zone
- —
- Chance of flooding over 30 yrs
- —
- Est. flood insurance / yr
- —
Fire risk No data
- Est. fire insurance / yr
- —
Heat risk No data
- Hot days now (above threshold)
- —
- Hot days in 30 yrs
- —
Wind risk No data
- Chance of severe wind over 30 yrs
- —
Air-quality risk No data
- Unhealthy air days now
- —
- Unhealthy air days in 30 yrs
- —
Risk factors via First Street. Map © Google.
Why this score? — see what drove the C- grade
The composite is a weighted blend of 9 inputs, each scored 0–100. Each bar is that input's sub-score; the figure is the points it added to the 100-point composite (weight × sub-score).
- Cash flow +22.4/30.0
- DSCR +7.2/10.0
- ARV discount +6.9/15.0
- 1% rule +4.7/10.0
- Schools +2.7/10.0
- Livability +2.7/5.0
- Rent growth +2.5/5.0
- Condition / age +2.5/5.0
- Appreciation +0.0/10.0
$149,000
🖨 Deal sheet 📄 Offer letter ✓ Due diligence
Listing remarks
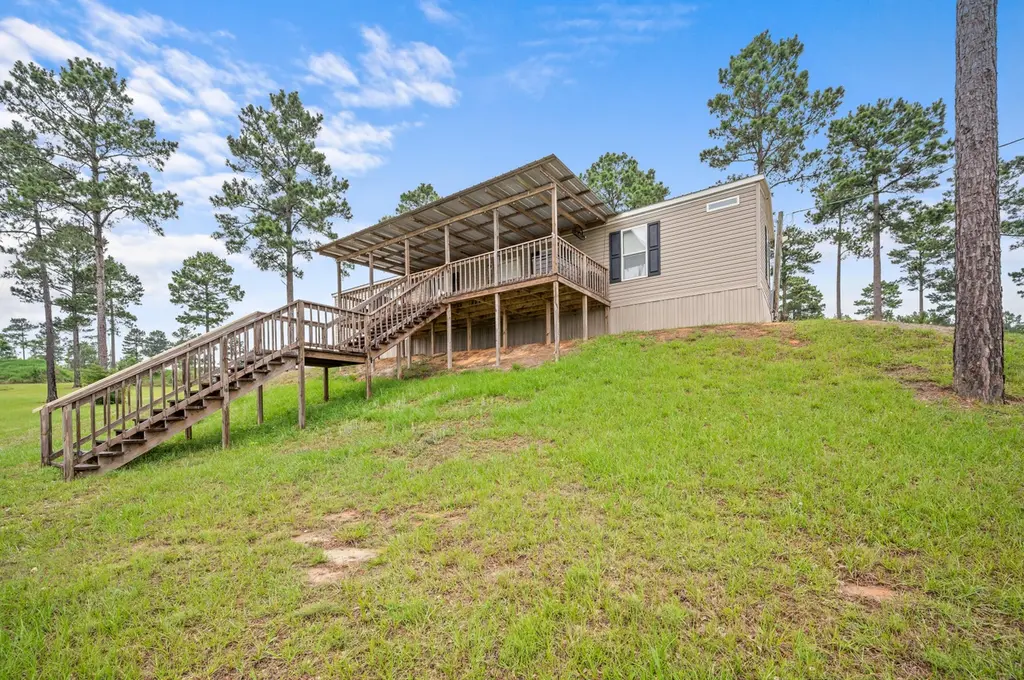
Escape to the peaceful charm of Toledo Bend with this beautifully maintained 2-bedroom, 2-bath home, just over 4 years old and situated on a little over half an acre. Offering peaceful water views and a relaxing atmosphere, this property is the perfect opportunity for a weekend getaway, fishing retreat, investment property, or full-time lake living. With a functional layout, comfortable living spaces, and plenty of outdoor room to unwind, this property offers both comfort and convenience in a highly desirable area near Toledo Bend. Whether you're searching for a private escape, a camp for fishing weekends, or potential Airbnb income, this property checks all the boxes for easy, low-maintena
Key facts
- Lake living
- Water views
- Outdoor room
Tags
Property features AI
Finance
- Other: Approximately 0.55 acre lot; Zoned residential; Directions: Hwy 171 N to Hwy 111 turn left. Continue onto Hwy 392 at stop sign. Right onto Hwy 191. Left onto Pleasure Point Road, right on Reds Point. Sign posted.
Exterior
- Home design: Single-story manufactured home; Residential property
- Construction: Vinyl siding; Composition roof; Built on a single story
- Exterior features: Front porch
Interior
- Bedrooms: 2 full bathrooms
- Bathrooms: 2 full bathrooms
- Heating & cooling: Central heating; Central air
- Interior features: Central heating; Central air; 6 total rooms
Neighborhood map
What this means for you Summary
Snapshot
- This is a 2-bed/2.0-bath manufactured listed at $149k.
Deal economics
- At list price, monthly cash flow is $249 ($3k/yr) — positive.
- The deal already cash-flows at list — no discount required.
- To meet the 1% rule (rent ≥ 1% of price), the offer needs to be $144k (3.4% below list).
- Recommended offer: $144k (3.4% below list) — sets the bar for 1% rule.
- Cap rate 8.3% vs local median 2.4% in South Toledo Bend — top-decile yield for the area; either an underpriced asset or a hidden risk that comps aren't pricing in. Stress-test before assuming the spread holds.
Location & tenants
- Location reads 53/100 on livability (#1,431 in TX) — a working-class tenant base; expect higher turnover. Strengths: cost of living A+, crime A; Watch: health & safety C-, housing D, schools F.
- Sabine Parish (rural): math 27% / reading 39% proficiency, ranked #40 of 98 in LA (top 41%) — families likely to look elsewhere, expect single-tenant / working-renter base with shorter leases; 64% free/reduced lunch — lower-income household profile, screen leases tightly.
- Market conditions: 49 units permitted in Sabine Parish in 2024 (0 in 5+ unit buildings).
Forward outlook
- Local home prices are declining (-3.0%/yr); year-one equity from $1k of loan paydown is wiped out by about $4k of value loss. Plan a longer hold.
- Sabine County population projected to shrink 7% by 2050 — rents likely to lag national; underwrite the cash flow, not the appreciation.
Negotiation context
- It's been on market 40 days — a 3% lower offer ($145k) is reasonable based on typical stale-listing flexibility.
Questions for the listing agent
- It's been on market 40 days. Have you received any prior offers? Is the seller open to a 3% concession, seller financing, or rate buy-down credit?
- Is there a deadline driving the sale (1031 exchange, divorce, estate, relocation)? That informs how much negotiation room exists.
- Schools are F-rated, which usually means shorter tenancies and higher turnover. Who's the typical renter profile here, and what's been the actual vacancy rate?
- What's the average days-on-market for RENTAL listings here right now (not sales)? A rising rental-DOM trend means longer vacancies and softer asking-rent achievability than the comps imply.
- What's the recent tenant-quality profile in this submarket — average credit score on applications, eviction rate, late-payment / NSF rate, and stable-employment percentage? A property-management company in the area should have these aggregated.
- How much new for-sale + rental construction is in the pipeline within 1–3 miles? Heavy new supply typically softens prices + rents 12–24 months out; constrained supply supports both.
Investment metrics
- 1% rule
- 0.97% ✗
- Cap rate
- 8.30%
- Cash-on-cash
- 7.15%
- DSCR
- 1.32
- GRM
- 8.6
CMA / ARV
- ARV (median comp)
- $147,000
- List price
- $149,000
- Delta
- 1.36%
- Verdict
- FAIR
- Comps
- 1 within 2.0 mi
Projected returns pro-forma
-3.0% appreciation · 3.0% rent growth · sell at horizon
- IRR
- -5.4%
- Equity multiple
- 0.80×
- Total profit
- $-8,377
- Equity at exit
- $22,216
- IRR
- 4.2%
- Equity multiple
- 1.31×
- Total profit
- $12,828
- Equity at exit
- $12,883
Cash invested: $41,720 (down + closing). Projections, not guarantees.
Landlord ↔ Tenant lean methodology
- Overall (STATE)
- 87 Strongly Landlord-Friendly
- State Texas
- 87 Strongly Landlord-Friendly · R+5
- County
- — inherits STATE
- City
- — inherits STATE
ZIP-level market 71429
- Home prices YoY
- -29.9%
- Price-to-rent
- 8.6×
Monthly cashflow live
- Estimated rent
- $1,439 medium interval (Pro) →
- Mortgage (P&I)
- −$781
- Tax from tax record
- −$45 /mo · $535/yr
- Insurance
- −$62
- HOA
- −$0
- Vacancy / Maint / Mgmt
- −$302
- Net cashflow
- $249
Break-even live
UW: 25.0% down · 7.5% · 30yr · 1.5% tax · 5.0% vac · 8.0% maint · 8.0% mgmt
Financing live
Cash to close
- Down payment
- $37,250
- Closing costs
- $4,470
- Reserves months
- —
- Total cash needed
- —
Loan-product check · same deal, 3 products live
Conventional
25% down · 7.5% · 30yr
- Down + closing
- —
- Monthly P&I
- —
- Monthly cashflow
- —
- DSCR
- —
- Eligible?
- —
Personal DTI + credit; lowest rate.
DSCR
20% down · 8.5% · 30yr
- Down + closing
- —
- Monthly P&I
- —
- Monthly cashflow
- —
- DSCR
- —
- Eligible?
- —
No personal income docs; deal must DSCR.
Hard money
10% down · 12.0% · 12mo
- Down + closing
- —
- Monthly P&I
- —
- Monthly cashflow
- —
- DSCR
- —
- Eligible?
- —
Short-term bridge; refi at stabilization.
Listing history 18 events
-
2026-06-19days on market $149,000 Active 40 DOM
-
2026-06-18days on market $149,000 Active 39 DOM
-
2026-06-17days on market $149,000 Active 38 DOM
-
2026-06-16days on market $149,000 Active 37 DOM
-
2026-06-15days on market $149,000 Active 36 DOM
-
2026-06-14days on market $149,000 Active 34 DOM
-
2026-06-12days on market $149,000 Active 33 DOM
-
2026-06-09days on market $149,000 Active 30 DOM
-
2026-06-09price $149,000 Active 29 DOM
-
2026-06-08days on market $159,000 Active 29 DOM
-
2026-06-07days on market $159,000 Active 28 DOM
-
2026-06-07days on market $159,000 Active 27 DOM
-
2026-06-04days on market $159,000 Active 24 DOM
-
2026-06-02days on market $159,000 Active 23 DOM
-
2026-06-01days on market $159,000 Active 22 DOM
-
2026-05-31days on market $159,000 Active 21 DOM
-
2026-05-31days on market $159,000 Active 20 DOM
-
2026-05-11$159,000 Active 741-char remark
ⓘ Source: listings_history table (triggers on properties + properties_extension) + one-shot
backfill from property_details.listing_events for pre-trigger history.
Tax reassessment forecast TX · Resets to sale price
- Current annual tax
- $535 · $45/mo
- Projected year-2 tax
- $2,727 · $227/mo
- Expected delta
- +$2,192/yr (+$183/mo · 409.6%)
ⓘ Screening estimate from a state-policy table — verify with the county assessor before closing.
Nearby sold comps map
Loading sold comps map…
Walkable amenities ~0.75 mi
Loading nearby amenities…
Taxation est. · year 1
- Rental income
- $17,265
- − Mortgage interest
- −$8,346
- − Property taxes
- −$535
- − Insurance
- −$745
- − Repairs & maintenance
- −$1,381
- − Management
- −$1,381
- − Depreciation
- −$4,335
- Taxable income
- $542
- Est. tax owed @ 24.0%
- −$130
- After-tax cash flow
- $2,853/yr
For passive investors: Depreciation is non-cash, so a rental often shows a tax loss while cash-flowing — sheltering income. Rental losses are passive: they offset passive income freely, and up to $25,000/yr can offset ordinary (W-2) income if you actively participate and your MAGI is under $100k (phasing out to $0 by $150k); unused losses carry forward. On sale, claimed depreciation is recaptured at up to 25%, and gains may owe capital-gains tax (a 1031 exchange can defer both). Figures are a year-1 estimate at your 24.0% rate — not tax advice; consult a CPA.
Schools (NCES district)
- District
- Sabine Parish
- NCES district ID
- 2201380
- Math proficiency
- 27% ▼ -38.00%
- Reading proficiency
- 39% ▼ -35.00%
- Median HH income
- $37,017
- Composite
- 27.41/100
- National rank
- #6970
- State rank
- #40 of 98 in LA
Livability — South Toledo Bend
- Score
- 53/100
- State rank
- #1431
- US rank
- #24460
Category grades
Schools grade is shown separately in the Schools card above.
Census & demographics
- Population (ZIP)
- 3,101
Population outlook (Sabine County) Hauer SSP2
- Today (2025)
- 23,820 people
- By 2030
- 23,505 · -1.3%
- By 2040
- 22,885 · -3.9%
- By 2050
- 22,235 · -6.7%
- By 2075
- 20,257 · -15.0%
- By 2100
- 17,348 · -27.2%
Race, ethnicity, and origin ACS 2023
- Neighborhood character
- Predominantly White (88%)
- Race & ethnicity
- White 88% Black 7% Hispanic / Latino 2%
- Common ancestry
- Lithuanian 4% Slovak 1% Iranian 1%
- Foreign-born
- 1%
- Languages at home
- 99% English-only · Spanish 1%
Political lean MEDSL · Sabine
- 2024 margin
- Solid R (+70.1) · D 14.6% · R 84.7%
- 2008→2024 swing
- -18.5pp toward R · 2008: -51.6pp · 2024: -70.1pp
- All cycles
- 2024: R+70.1 2020: R+66.5 2016: R+63.1 2012: R+55.1 2008: R+51.6
Not yet ingested
- Civics
- —
Market trends
- HPI YoY
- ▼ -62.68%
- Current HPI
- 146.6056
- Rent YoY
- —
- Metro
- —
- State GDP YoY
- ▲ 3.95%
- F500 in state
- 110
Industry mix (Fortune 500 HQ in TX)
| Industry | F500 HQs | Revenue |
|---|---|---|
| Energy | 16 | $1,198B |
|
||
| Technology | 5 | $198B |
|
||
| Engineering / Construction | 4 | $72B |
|
||
| Energy Services | 3 | $60B |
|
||
| Utilities | 3 | $41B |
|
||
| Healthcare | 2 | $330B |
|
||
Price history
-6.3% since first listed2 events — show timeline
- 2026-06-09 Price Changed $149,000 GFPAR
- 2026-05-11 Listed $159,000 GFPAR
Property tax history
+21.5%/yrLatest (2025): $535 · -6.2% YoY. Source: county tax records.
Cash-flow waterfall
monthlySold comps — $/sqft
last 12 mo · ≤1 miLoading sold comps…