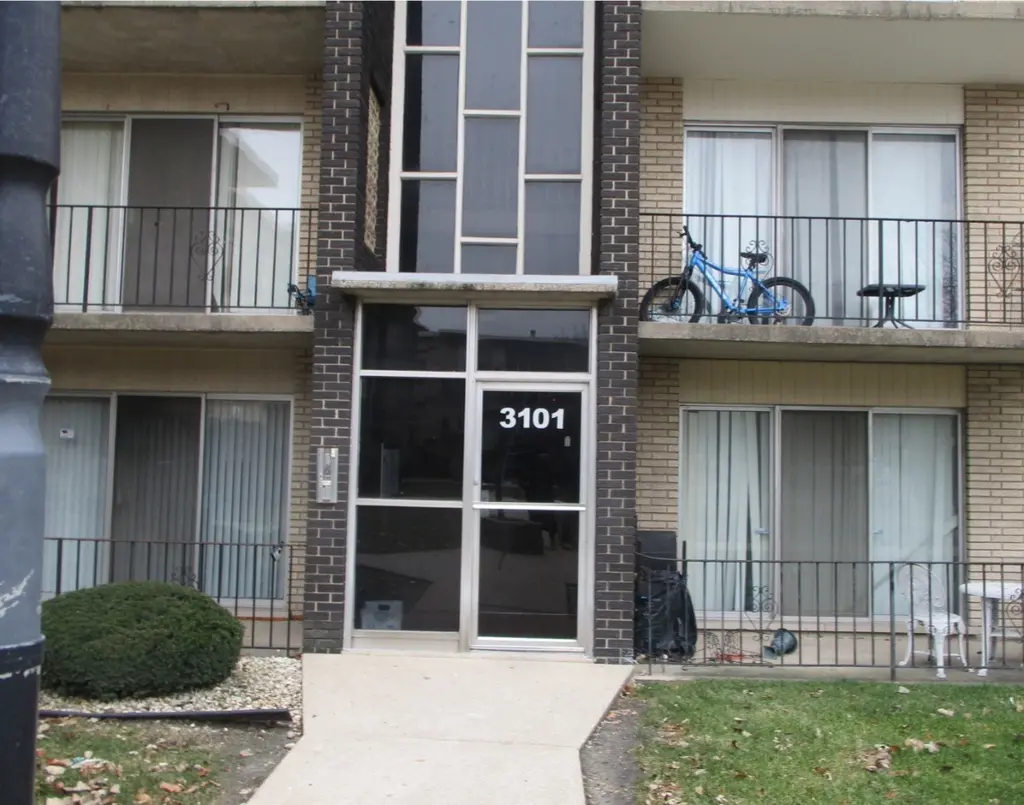
3101 Bernice Rd #4 · Lansing, IL
Flood risk 1/10 · Minimal
- FEMA flood zone
- X (unshaded)
- Chance of flooding over 30 yrs
- 0.0%
- Est. flood insurance / yr
- $507 – $1,088
Fire risk 1/10 · Minimal
- Est. fire insurance / yr
- $804 – $1,492
Heat risk 3/10 · Minor
- Hot days now (above 102°F)
- 7 days/yr
- Hot days in 30 yrs
- 15 days/yr
Wind risk 2/10 · Minimal
- Chance of severe wind over 30 yrs
- —
Air-quality risk 4/10 · Minor
- Unhealthy air days now
- 5 days/yr
- Unhealthy air days in 30 yrs
- 6 days/yr
Risk factors via First Street. Map © Google.
Why this score? — see what drove the B- grade
The composite is a weighted blend of 9 inputs, each scored 0–100. Each bar is that input's sub-score; the figure is the points it added to the 100-point composite (weight × sub-score).
- Cash flow +30.0/30.0
- 1% rule +10.0/10.0
- DSCR +10.0/10.0
- ARV discount +7.5/15.0
- Livability +3.7/5.0
- Rent growth +2.5/5.0
- Condition / age +2.5/5.0
- Schools +1.0/10.0
- Appreciation +0.0/10.0
$64,900
🖨 Deal sheet 📄 Offer letter ✓ Due diligence
Listing remarks
Great value for a 2 bedroom, 1 bath, 2nd floor condo in Bernice Terraces in Lansing! Loads of natural sunlight in this unit and kitchen has an eat-in area adjacent to it that is large enough for a kitchen table. Large balcony, laundry on-site, and heat and water included in the monthly assessment. . Close to schools, public transportation, highways, shopping, restaurants and more. Great opportunity for investors who want to rent the unit out or for owner/occupants and first time home buyers. No major repairs needed but sold As-Is. Motivated Seller. Make your appointment today!
Key facts
- Eat-in area
- Close to schools
- Large balcony
Tags
Property features AI
Finance
- Other: Unit is one of 60 in the building; Living area source is estimated; Property is not currently leased; Possession at closing
- Financial info: Special Service Area: No
- HOA & community: Monthly association fee of $277; Association fee includes heat, water, insurance, exterior maintenance, lawn care, scavenger, and snow removal; Association amenities include coin laundry and storage; On-site management is off-site (manager available Monday through Friday); Pets allowed: cats and dogs with a 25 lb size limit
Exterior
- Parking: Assigned parking (1 space)
- Security: Building has security door locks
- Utilities: Water from Lake Michigan and public supply; Public sewer; Electric with circuit breakers
- Home design: Attached single condo; Entry level 2
- Construction: Brick construction; Asphalt roof; Concrete perimeter foundation; Built 51-60 years ago; Built before 1978
- Exterior features: Common grounds
Interior
- Kitchen: Range; Refrigerator; Eating area / table space; Vinyl flooring in kitchen
- Bedrooms: Two bedrooms; Master bedroom on main level (13 x 15) with wood laminate flooring; Second bedroom on main level (12 x 11) with wood laminate flooring
- Flooring: Laminate throughout main living areas; Vinyl in kitchen
- Bathrooms: One full bathroom
- Heating & cooling: Natural gas forced air heating; Central air conditioning
- Interior features: Four total rooms; No window treatments in kitchen
- Laundry & utility: Laundry on main level in a common area
Neighborhood map
What this means for you Summary
Snapshot
- This is a 2-bed/1.0-bath condo listed at $65k.
Deal economics
- At list price, monthly cash flow is $311 ($4k/yr) — positive.
- The deal already cash-flows at list — no discount required.
- Meets the 1% rule at list price ($2k rent vs $65k).
- Cap rate 12.0% vs local median 5.8% in Lansing — top-decile yield for the area; either an underpriced asset or a hidden risk that comps aren't pricing in. Stress-test before assuming the spread holds.
Location & tenants
- Location reads 73/100 on livability (#296 in IL) — a middle-class / working-renter tenant base. Strengths: commute A+, cost of living A+, housing A+; Watch: schools D+, crime D+, health & safety D+.
- Thornton Fractional Twp Hsd 215 (suburban): math 9% / reading 13% proficiency, ranked #563 of 620 in IL (top 91%) — low school quality limits family demand, transient renter base, plan for 1-2y turnover.
- Market conditions: 132 active listings in the ZIP; 16 comparable units currently listed for rent nearby; rentals at typical pace (median 18d on market — plan ~3-4 weeks tenant-placement turnaround); solid renter incomes; 6,272 units permitted in Cook County in 2024 (4,658 in 5+ unit buildings).
Forward outlook
- Local home prices are declining (-3.0%/yr); year-one equity from $449 of loan paydown is wiped out by about $2k of value loss. Plan a longer hold.
- At projected returns (-3.0% appreciation + 3.0% rent growth), your $18k cash investment doubles in ~6 years — after that, you're playing with house money.
Negotiation context
- Only 8 days on market — expect competitive offers; lowballing is unlikely to land.
- 9 sale attempts since 18y ago with the ask held roughly flat each time — persistent listings suggest the price (not the market) is what's stuck; bring a comps-based counter.
- Current owner paid $21k; list at $65k implies a 209% gain — meaningful room to come down on a strong offer.
Risks & watch-outs
- Watch-outs: property tax is 4.6% of price.
Questions for the listing agent
- Built in 1969 — when were the roof, HVAC, electrical panel, plumbing, and water heater last replaced?
- Property tax is high relative to price — has the assessment been appealed recently, and will the sale trigger a re-assessment?
- What does the HOA fee cover, when was the last increase, and are there any pending special assessments or reserve-fund shortfalls?
- Any open or pending special assessments — roof, HVAC, plumbing, elevator, façade? What's the per-unit balance and payoff schedule, and is the seller paying it off at close or rolling it to the buyer?
- Is there a deadline driving the sale (1031 exchange, divorce, estate, relocation)? That informs how much negotiation room exists.
- Schools are D-rated, which usually means shorter tenancies and higher turnover. Who's the typical renter profile here, and what's been the actual vacancy rate?
- Crime grade is D in this area — have there been break-ins, vandalism, or insurance claims at this property in the last 3 years? What carrier currently insures it and at what premium?
- What's the average days-on-market for RENTAL listings here right now (not sales)? A rising rental-DOM trend means longer vacancies and softer asking-rent achievability than the comps imply.
- What's the recent tenant-quality profile in this submarket — average credit score on applications, eviction rate, late-payment / NSF rate, and stable-employment percentage? A property-management company in the area should have these aggregated.
- How much new apartment / multifamily construction is in the pipeline within 1–3 miles? Heavy new supply (>2% of stock underway) typically softens rents 12–24 months out; light construction supports rent growth.
Investment metrics
- 1% rule
- 2.34% ✓
- Cap rate
- 12.04%
- Cash-on-cash
- 20.51%
- DSCR
- 1.91
- GRM
- 3.6
CMA / ARV
No comps found within radius.
Projected returns pro-forma
-3.0% appreciation · 3.0% rent growth · sell at horizon
- IRR
- 13.1%
- Equity multiple
- 1.53×
- Total profit
- $9,560
- Equity at exit
- $9,677
- IRR
- 22.2%
- Equity multiple
- 2.93×
- Total profit
- $34,995
- Equity at exit
- $5,611
Cash invested: $18,172 (down + closing). Projections, not guarantees.
Landlord ↔ Tenant lean methodology
- Overall (STATE)
- 43 Moderately Tenant-Leaning
- State Illinois
- 43 Moderately Tenant-Leaning · D+7
- County
- — inherits STATE
- City
- — inherits STATE
ZIP-level market 60438
- Active inventory
- 132
- Price-to-rent
- 3.6×
Monthly cashflow live
- Estimated rent
- $1,520 high interval (Pro) →
- Mortgage (P&I)
- −$340
- Tax from tax record
- −$246 /mo · $2,954/yr
- Insurance
- −$27
- HOA
- −$277
- Vacancy / Maint / Mgmt
- −$319
- Net cashflow
- $311
Break-even live
UW: 25.0% down · 7.5% · 30yr · 1.5% tax · 5.0% vac · 8.0% maint · 8.0% mgmt
Financing live
Cash to close
- Down payment
- $16,225
- Closing costs
- $1,947
- Reserves months
- —
- Total cash needed
- —
Loan-product check · same deal, 3 products live
Conventional
25% down · 7.5% · 30yr
- Down + closing
- —
- Monthly P&I
- —
- Monthly cashflow
- —
- DSCR
- —
- Eligible?
- —
Personal DTI + credit; lowest rate.
DSCR
20% down · 8.5% · 30yr
- Down + closing
- —
- Monthly P&I
- —
- Monthly cashflow
- —
- DSCR
- —
- Eligible?
- —
No personal income docs; deal must DSCR.
Hard money
10% down · 12.0% · 12mo
- Down + closing
- —
- Monthly P&I
- —
- Monthly cashflow
- —
- DSCR
- —
- Eligible?
- —
Short-term bridge; refi at stabilization.
Rent comps 16 comps
| Address | Beds | Baths | Sqft | Rent | $/sqft | DOM | Units | Dist |
|---|---|---|---|---|---|---|---|---|
| 3069 Bernice Rd Apt 2N Lansing, IL | 3.0 | 1.0 | 950 | $1,535 | $1.62 | 21d | 1 | 0.01mi |
| 3069 Bernice Rd Apt 2S Lansing, IL | 3.0 | 1.0 | 950 | $1,535 | $1.62 | 3d | 1 | 0.02mi |
| 3023 Bernice Rd Apt 2S Lansing, IL | 3.0 | 1.0 | 1000 | $1,600 | $1.60 | 1d | 1 | 0.08mi |
| 3020 178th St Unit C1 Lansing, IL | 2.0 | 1.0 | 900 | $1,550 | $1.72 | 1d | 1 | 0.47mi |
| 3020 178th St Apt C7 Lansing, IL | 2.0 | 1.0 | 900 | $1,550 | $1.72 | 25d | 1 | 0.47mi |
| 17723 Exchange Ave Unit 17723-1N Lansing, IL | 3.0 | 2.0 | 1100 | $1,800 | $1.64 | 1d | 1 | 0.63mi |
| 3649 173rd Ct Lansing, IL | 2.0 | 2.0 | 972 | $1,357 | $1.40 | 25d | 1 | 0.79mi |
| 1539 Wentworth Ave Unit 3W Calumet City, IL | 3.0 | 1.0 | 1100 | $1,700 | $1.55 | 12d | 1 | 0.94mi |
| 2441 Indiana Ave Unit 2N Lansing, IL | 1.0 | 1.0 | 600 | $975 | $1.62 | 13d | 1 | 1.18mi |
| 2441 Indiana Ave Lansing, IL | 1.0 | 1.0 | 600 | $975 | $1.62 | 4d | 1 | 1.18mi |
| 1338 Wentworth Ave Unit 1338 Calumet City, IL | 2.0 | 1.0 | 800 | $1,430 | $1.79 | 25d | 1 | 1.31mi |
| 18335 Sherman St Unit 3 Lansing, IL | 3.0 | 1.0 | 1000 | $1,700 | $1.70 | 1d | 1 | 1.33mi |
| 17640 Rosewood Dr Unit 2A Lansing, IL | 2.0 | 1.0 | 950 | $1,475 | $1.55 | 18d | 1 | 1.37mi |
| 17754 Rosewood Dr Unit 1N Lansing, IL | 2.0 | 1.0 | 850 | $1,370 | $1.61 | 25d | 1 | 1.39mi |
| 18361 Glen Oak Ave Unit 1E Lansing, IL | 2.0 | 1.0 | 900 | $1,400 | $1.56 | 25d | 1 | 1.42mi |
| 18381 Torrence Ave Lansing, IL | 2.0 | 1.0 | 900 | $1,300 | $1.44 | 25d | 1 | 1.49mi |
HOA detail condo
- Monthly dues
- $277 · $3,324/yr
- Likely covers
- water
- Assessments
- None detected in remarks — confirm with the listing agent.
Listing history 22 events
-
2026-05-08status Pending
-
2026-05-06historical Contingent - No Showings
-
2026-04-30$64,900 Active
-
2015-09-16historical
-
2015-09-14
-
2015-01-19historical
-
2014-11-06New
-
2013-07-16historical
-
2012-05-02New
-
2012-05-01historical
-
2012-04-30historical
-
2012-02-25New
-
2011-11-25New
-
2011-02-01historical
-
2009-09-15New
-
2009-07-14soldstatus $21,000 Closed Sale
-
2009-06-05historical
-
2009-05-29$21,000
-
2009-01-26historical
-
2008-07-11
-
2006-05-08soldstatus $75,000
-
1998-08-24soldstatus $59,500
ⓘ Source: listings_history table (triggers on properties + properties_extension) + one-shot
backfill from property_details.listing_events for pre-trigger history.
Tax reassessment forecast IL · Partial reset (capped growth)
- Current annual tax
- $2,954 · $246/mo
- Projected year-2 tax
- $2,954 · $246/mo
- Expected delta
- $0/yr ($0/mo · 0.0%)
ⓘ Screening estimate from a state-policy table — verify with the county assessor before closing.
Climate risk First Street
- Flood 1/10 Low FEMA zone X (unshaded) · 0% chance over 30 yrs
- Wildfire 1/10 Low
- Heat 3/10 Moderate 7 d/yr ≥102°F today · 15 d/yr by 30 yrs out
- Wind 2/10 Low
- Air quality 4/10 Moderate 5 unhealthy d/yr today · 6 by 30 yrs out
Nearby sold comps map
Loading sold comps map…
Walkable amenities ~0.75 mi
Loading nearby amenities…
Taxation est. · year 1
- Rental income
- $18,245
- − Mortgage interest
- −$3,635
- − Property taxes
- −$2,954
- − Insurance
- −$324
- − Repairs & maintenance
- −$1,460
- − Management
- −$1,460
- − HOA
- −$3,324
- − Depreciation
- −$1,888
- Taxable income
- $3,200
- Est. tax owed @ 24.0%
- −$768
- After-tax cash flow
- $2,959/yr
For passive investors: Depreciation is non-cash, so a rental often shows a tax loss while cash-flowing — sheltering income. Rental losses are passive: they offset passive income freely, and up to $25,000/yr can offset ordinary (W-2) income if you actively participate and your MAGI is under $100k (phasing out to $0 by $150k); unused losses carry forward. On sale, claimed depreciation is recaptured at up to 25%, and gains may owe capital-gains tax (a 1031 exchange can defer both). Figures are a year-1 estimate at your 24.0% rate — not tax advice; consult a CPA.
Schools (NCES district)
- District
- Thornton Fractional Twp Hsd 215
- NCES district ID
- 1738940
- Math proficiency
- 9% ▼ -3.00%
- Reading proficiency
- 13% ▼ -3.00%
- Median HH income
- $48,207
- Composite
- 10.27/100
- National rank
- #9793
- State rank
- #563 of 620 in IL
Livability — Lansing
- Score
- 73/100
- State rank
- #296
- US rank
- #5698
Category grades
Schools grade is shown separately in the Schools card above.
Census & demographics
- Census place
- Lansing, IL
- County
- Cook County · 4,486,803 people
- City population
- 28,806
- Metro
- Chicago-Naperville-Elgin, IL-IN-WI
- Population (ZIP)
- 28,806
- Household income
- $75,681
- Rent vs Own
- Severe rent burden
- 830.0
Population outlook (Cook County) Hauer SSP2
- Today (2025)
- 5,347,519 people
- By 2030
- 5,357,703 · +0.2%
- By 2040
- 5,324,924 · -0.4%
- By 2050
- 5,230,762 · -2.2%
- By 2075
- 4,785,735 · -10.5%
- By 2100
- 4,188,836 · -21.7%
Race, ethnicity, and origin ACS 2023
- Neighborhood character
- Diverse neighborhood (Simpson 0.65)
- Race & ethnicity
- Black 51% White 25% Hispanic / Latino 18% Two or more races 7% Asian 2%
- Hispanic origin (detail)
- Mexican 15%
- Common ancestry
- Romanian 5% Iranian 3% Lithuanian 1%
- Foreign-born
- 10% · Canada
- Languages at home
- 83% English-only · Spanish 12% Vietnamese 1% French/Haitian/Cajun 1%
Political lean MEDSL · Cook
- 2024 margin
- Solid D (+42.0) · D 70.4% · R 28.4% · Other 1.2%
- 2008→2024 swing
- -11.4pp toward R · 2008: 53.4pp · 2024: 42.0pp
- All cycles
- 2024: D+42.0 2020: D+50.3 2016: D+53.0 2012: D+49.4 2008: D+53.4
Not yet ingested
- Civics
- —
Market trends
- HPI YoY
- ▼ -151.65%
- Current HPI
- 210.3398
- Rent YoY
- —
- Metro
- Chicago-Naperville-Elgin, IL-IN-WI
- State GDP YoY
- ▲ 1.59%
- F500 in state
- 60
Industry mix (Fortune 500 HQ in IL)
| Industry | F500 HQs | Revenue |
|---|---|---|
| Insurance | 4 | $201B |
|
||
| Consumer Goods | 4 | $87B |
|
||
| Industrial Machinery | 3 | $64B |
|
||
| Healthcare | 2 | $55B |
|
||
| Retail / Pharmacy | 1 | $148B |
|
||
| Agriculture / Food | 1 | $86B |
|
||
Price history
+9.1% since first listed22 events — show timeline
- 2026-05-08 Pending — MRED as Distributed by MLS Grid
- 2026-05-06 Contingent — MRED as Distributed by MLS Grid
- 2026-04-30 Listed $64,900 MRED as Distributed by MLS Grid
- 2015-09-16 Listing Removed — MRED as Distributed by MLS Grid
- 2015-09-14 Listed — MRED as Distributed by MLS Grid
- 2015-01-19 Listing Removed — MRED as Distributed by MLS Grid
- 2014-11-06 Listed — MRED as Distributed by MLS Grid
- 2013-07-16 Listing Removed — MRED as Distributed by MLS Grid
- 2012-05-02 Listed — MRED as Distributed by MLS Grid
- 2012-05-01 Listing Removed — MRED as Distributed by MLS Grid
- 2012-04-30 Listing Removed — MRED as Distributed by MLS Grid
- 2012-02-25 Listed — MRED as Distributed by MLS Grid
- 2011-11-25 Listed — MRED as Distributed by MLS Grid
- 2011-02-01 Listing Removed — MRED as Distributed by MLS Grid
- 2009-09-15 Listed — MRED as Distributed by MLS Grid
- 2009-07-14 Sold (MLS) $21,000 MRED as Distributed by MLS Grid
- 2009-06-05 Listing Removed — MRED as Distributed by MLS Grid
- 2009-05-29 Listed $21,000 MRED as Distributed by MLS Grid
- 2009-01-26 Listing Removed — MRED as Distributed by MLS Grid
- 2008-07-11 Listed — MRED as Distributed by MLS Grid
- 2006-05-08 Sold (Public Records) $75,000 Public Records
- 1998-08-24 Sold (Public Records) $59,500 Public Records
Property tax history
+5.4%/yrLatest (2023): $2,954 · +39.5% YoY. Source: county tax records.
Cash-flow waterfall
monthlySold comps — $/sqft
last 12 mo · ≤1 miLoading sold comps…