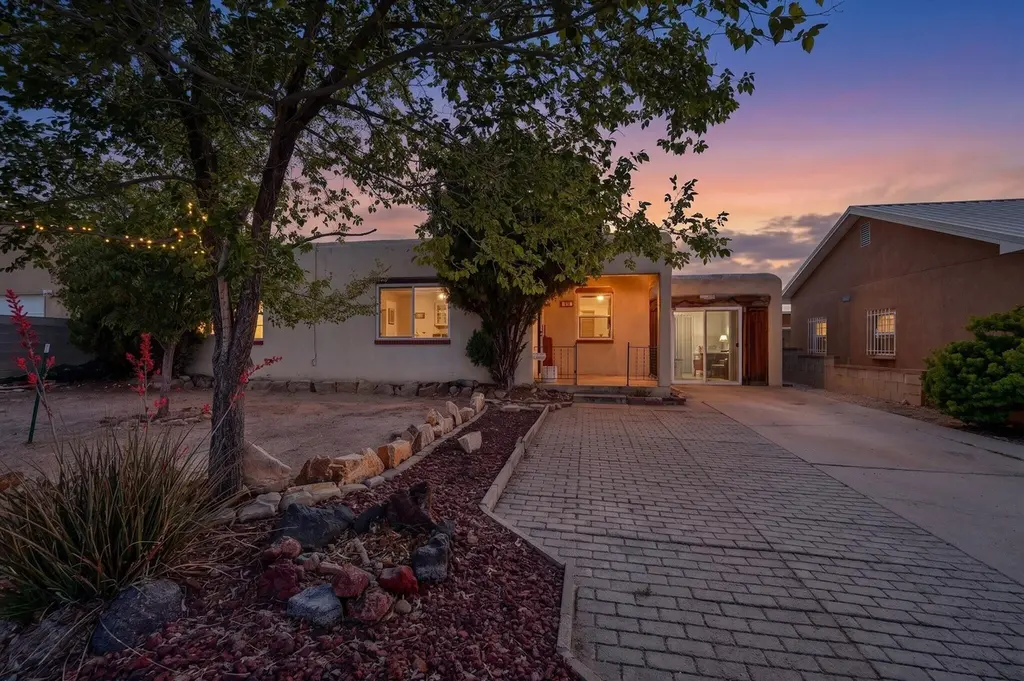
2817 Sierra Dr NE · Albuquerque, NM
Flood risk 1/10 · Minimal
- FEMA flood zone
- X (unshaded)
- Chance of flooding over 30 yrs
- 0.0%
- Est. flood insurance / yr
- $507 – $1,088
Fire risk 1/10 · Minimal
- Est. fire insurance / yr
- $706 – $1,312
Heat risk 5/10 · Moderate
- Hot days now (above 95°F)
- 7 days/yr
- Hot days in 30 yrs
- 16 days/yr
Wind risk 1/10 · Minimal
- Chance of severe wind over 30 yrs
- —
Air-quality risk 2/10 · Minimal
- Unhealthy air days now
- 1 days/yr
- Unhealthy air days in 30 yrs
- 3 days/yr
Risk factors via First Street. Map © Google.
Why this score? — see what drove the D grade
The composite is a weighted blend of 9 inputs, each scored 0–100. Each bar is that input's sub-score; the figure is the points it added to the 100-point composite (weight × sub-score).
- Cash flow +12.8/30.0
- ARV discount +7.5/15.0
- Schools +5.3/10.0
- DSCR +3.8/10.0
- Livability +3.6/5.0
- Rent growth +3.2/5.0
- 1% rule +3.0/10.0
- Condition / age +2.5/5.0
- Appreciation +0.0/10.0
$200,000
🖨 Deal sheet 📄 Offer letter ✓ Due diligence
Listing remarks
Investment opportunity. This home is being sold as part of an estate. The home is being sold AS IS. Seller will NOT provide any credits, repairs or price reductions. Buyer to verify if home qualifies for any type of financing. MULTIPLE OFFERS. Offers are being taken until Sunday, May 10th, 2026 at 5pm. A decision will be made on Monday, May 11th, 2026 before 5pm. Please make sure your offer expiration date is Monday, 11th, 2026 @ 5pm.
Key facts
- 7,187 sq ft lot
- Built 1950
- Listed 4 days
Property features AI
Exterior
- Utilities: Electricity connected; Natural gas connected; Public water; Public sewer
- Home design: Single-story; Flat roof; Stucco construction; Faces east; Resale property
- Construction: Stucco exterior; Flat roof
- Exterior features: Private yard; Shed(s), storage, and workshop; Back yard fencing; Landscaped; Planned Unit Development; Xeriscape; City street frontage; Asphalt road surface
Interior
- Kitchen: Free-standing gas range; Range hood
- Bedrooms: Primary/main level
- Flooring: Wood
- Bathrooms: One three-quarter bathroom
- Heating & cooling: Floor furnace heating; Wood stove heating; Evaporative cooling
- Interior features: Main level primary; Double pane windows, insulated windows, and single-pane windows; Wood flooring; Wood burning stove fireplace
- Laundry & utility: Washer hookup; Electric dryer hookup; Gas dryer hookup
Neighborhood map
What this means for you Summary
Snapshot
- This is a 3-bed/1.0-bath other listed at $200k.
Deal economics
- At list price, monthly cash flow is $-18 ($-219/yr) — negative.
- To cash-flow at today's rent, offer at most $197k (1.6% below list).
- To meet the 1% rule (rent ≥ 1% of price), the offer needs to be $161k (19.5% below list).
- Recommended offer: $161k (19.5% below list) — sets the bar for 1% rule.
- Cap rate 6.2% vs local median 3.7% in Albuquerque — top-decile yield for the area; either an underpriced asset or a hidden risk that comps aren't pricing in. Stress-test before assuming the spread holds.
Location & tenants
- Location reads 72/100 on livability (#13 in NM) — a middle-class / working-renter tenant base. Strengths: amenities A+, commute A+, cost of living A+; Watch: schools D-, crime F.
- Albuquerque Public Schools (urban): math 51% / reading 75% proficiency, ranked #3 of 29 in NM (top 10%) — acceptable for families but not a draw, mixed tenant base, ~2y average lease; 60% free/reduced lunch — lower-income household profile, screen leases tightly.
- Market conditions: Rents rising (+2.7%/yr); 192 active listings in the ZIP; 36 comparable units currently listed for rent nearby; rentals at typical pace (median 24d on market — plan ~3-4 weeks tenant-placement turnaround); 42% of comp listings sitting > 30 days — soft ceiling on asking rent; 1,316 units permitted in Bernalillo County in 2024 (546 in 5+ unit buildings).
Forward outlook
- Local home prices are declining (-3.0%/yr); year-one equity from $1k of loan paydown is wiped out by about $6k of value loss. Plan a longer hold.
Negotiation context
- Only 4 days on market — expect competitive offers; lowballing is unlikely to land.
Risks & watch-outs
- Watch-outs: built in 1950 — expect roof / HVAC / electrical / plumbing capex.
- Climate carrying-cost: extreme-heat days projected 7→16/yr by 2055 (HVAC capex compounding) — expect insurance premiums to compound above CPI over the hold.
Questions for the listing agent
- What do current leases actually rent for vs. the listed asking? Can we see a recent rent roll and the last 12 months of T-12 income?
- Built in 1950 — when were the roof, HVAC, electrical panel, plumbing, and water heater last replaced?
- Is there a deadline driving the sale (1031 exchange, divorce, estate, relocation)? That informs how much negotiation room exists.
- Schools are D-rated, which usually means shorter tenancies and higher turnover. Who's the typical renter profile here, and what's been the actual vacancy rate?
- Crime grade is F in this area — have there been break-ins, vandalism, or insurance claims at this property in the last 3 years? What carrier currently insures it and at what premium?
- The area grade is low — what's the realistic commute time and amenity access for the typical tenant pool here? Any planned neighborhood developments (good or bad) we should know about?
- What's the average days-on-market for RENTAL listings here right now (not sales)? A rising rental-DOM trend means longer vacancies and softer asking-rent achievability than the comps imply.
- What's the recent tenant-quality profile in this submarket — average credit score on applications, eviction rate, late-payment / NSF rate, and stable-employment percentage? A property-management company in the area should have these aggregated.
- How much new for-sale + rental construction is in the pipeline within 1–3 miles? Heavy new supply typically softens prices + rents 12–24 months out; constrained supply supports both.
Investment metrics
- 1% rule
- 0.80% ✗
- Cap rate
- 6.18%
- Cash-on-cash
- -0.39%
- DSCR
- 0.98
- GRM
- 10.4
CMA / ARV
No comps found within radius.
Projected returns pro-forma
-3.0% appreciation · 2.67% rent growth · sell at horizon
- IRR
- -17.3%
- Equity multiple
- 0.39×
- Total profit
- $-34,134
- Equity at exit
- $29,821
- IRR
- -9.9%
- Equity multiple
- 0.40×
- Total profit
- $-33,521
- Equity at exit
- $17,292
Cash invested: $56,000 (down + closing). Projections, not guarantees.
Landlord ↔ Tenant lean methodology
- Overall (STATE)
- 55 Moderately Landlord-Leaning
- State New Mexico
- 55 Moderately Landlord-Leaning · D+3
- County
- — inherits STATE
- City
- — inherits STATE
ZIP-level market 87110
- Rents YoY
- 2.7%
- Active inventory
- 192
- Price-to-rent
- 10.4×
Monthly cashflow live
- Estimated rent
- $1,610 high interval (Pro) →
- Mortgage (P&I)
- −$1,049
- Tax from tax record
- −$158 /mo · $1,895/yr
- Insurance
- −$83
- HOA
- −$0
- Vacancy / Maint / Mgmt
- −$338
- Net cashflow
- $-18
Break-even live
UW: 25.0% down · 7.5% · 30yr · 1.5% tax · 5.0% vac · 8.0% maint · 8.0% mgmt
Financing live
Cash to close
- Down payment
- $50,000
- Closing costs
- $6,000
- Reserves months
- —
- Total cash needed
- —
Loan-product check · same deal, 3 products live
Conventional
25% down · 7.5% · 30yr
- Down + closing
- —
- Monthly P&I
- —
- Monthly cashflow
- —
- DSCR
- —
- Eligible?
- —
Personal DTI + credit; lowest rate.
DSCR
20% down · 8.5% · 30yr
- Down + closing
- —
- Monthly P&I
- —
- Monthly cashflow
- —
- DSCR
- —
- Eligible?
- —
No personal income docs; deal must DSCR.
Hard money
10% down · 12.0% · 12mo
- Down + closing
- —
- Monthly P&I
- —
- Monthly cashflow
- —
- DSCR
- —
- Eligible?
- —
Short-term bridge; refi at stabilization.
Rent comps 36 comps
| Address | Beds | Baths | Sqft | Rent | $/sqft | DOM | Units | Dist |
|---|---|---|---|---|---|---|---|---|
| 2838 Aliso Dr NE Albuquerque, NM | 2.0 | 1.0 | 760 | $1,895 | $2.49 | 43d | 1 | 0.16mi |
| 3131 Adams St NE Albuquerque, NM | 1.0–2.0 | 1.0–2.0 | 991 | $1,625 | $1.64 | 3d | 10 | 0.31mi |
| 3301 Monroe St NE Unit O158 Albuquerque, NM | 2.0 | 2.5 | 1042 | $1,400 | $1.34 | 23d | 1 | 0.54mi |
| 3417 Aztec Rd NE Apt D Albuquerque, NM | 2.0 | 1.0 | 828 | $1,050 | $1.27 | 21d | 1 | 0.60mi |
| 3503 Montclaire Dr NE Albuquerque, NM | 3.0 | 2.0 | 1293 | $1,795 | $1.39 | 43d | 1 | 0.61mi |
| 3528 Tyson Pl NE Unit C Albuquerque, NM | 2.0 | 1.0 | 780 | $1,050 | $1.35 | 43d | 1 | 0.61mi |
| 4024 Comanche Rd NE Albuquerque, NM | 3.0 | 2.0 | 1390 | $1,700 | $1.22 | 14d | 1 | 0.62mi |
| 3504 Tulane Dr NE Apt D Albuquerque, NM | 2.0 | 1.0 | 786 | $1,075 | $1.37 | 3d | 1 | 0.68mi |
| 4806 Mescalero Rd NE Albuquerque, NM | 3.0 | 1.5 | 1000 | $1,750 | $1.75 | 23d | 1 | 0.71mi |
| 3400 Comanche Rd NE Albuquerque, NM | 2.0 | 1.0 | 573 | $1,218 | $2.12 | 3d | 13 | 0.75mi |
| 3901 Indian School Rd NE Albuquerque, NM | 2.0 | 1.0–2.0 | 1050 | $1,980 | $1.89 | 3d | 17 | 0.77mi |
| 4712 Palo Duro Ave NE Albuquerque, NM | 3.0 | 2.0 | 1430 | $1,850 | $1.29 | 14d | 1 | 0.78mi |
| 3600 Lafayette Dr NE Unit A Albuquerque, NM | 2.0 | 1.0 | 750 | $895 | $1.19 | 43d | 1 | 0.80mi |
| 3617 Wellesley Dr NE Unit C Albuquerque, NM | 2.0 | 1.0 | 850 | $1,350 | $1.59 | 43d | 1 | 0.82mi |
| 3621 Wellesley Dr NE Unit C Albuquerque, NM | 2.0 | 1.0 | 850 | $1,250 | $1.47 | 43d | 1 | 0.83mi |
| 3618 Lafayette Dr NE Unit D Albuquerque, NM | 2.0 | 1.0 | 900 | $1,095 | $1.22 | 43d | 1 | 0.84mi |
| 3618 Lafayette Dr NE Unit A Albuquerque, NM | 2.0 | 1.0 | 880 | $1,100 | $1.25 | 3d | 1 | 0.84mi |
| 2534 La Veta Dr NE Albuquerque, NM | 3.0 | 2.0 | 1330 | $1,850 | $1.39 | 44d | 1 | 0.88mi |
| 3904 Goodrich Ave NE Albuquerque, NM | 3.0 | 2.0 | 1050 | $1,895 | $1.80 | 19d | 1 | 1.00mi |
| 4005 Van Buren St NE Albuquerque, NM | 3.0 | 2.0 | 1320 | $1,650 | $1.25 | 43d | 1 | 1.06mi |
| 2901 Euclid Ave NE Albuquerque, NM | 2.0 | 1.0 | 810 | $935 | $1.15 | 43d | 1 | 1.11mi |
| 2901 Euclid Ave NE Albuquerque, NM | 2.0 | 1.0–2.0 | 841 | $1,198 | $1.42 | 3d | 5 | 1.11mi |
| 2901 Euclid Ave NE Albuquerque, NM | 2.0 | 2.0 | 872 | $1,195 | $1.37 | 14d | 1 | 1.11mi |
| 2901 Euclid Ave NE Albuquerque, NM | 2.0 | 2.0 | 872 | $1,095 | $1.26 | 23d | 1 | 1.11mi |
| 4400 Montgomery Blvd NE Albuquerque, NM | 1.0–3.0 | 1.0–1.5 | 834 | $1,871 | $2.24 | 3d | 20 | 1.13mi |
| 2341 Valencia Dr NE Albuquerque, NM | 2.0 | 1.0 | 1128 | $1,850 | $1.64 | 43d | 1 | 1.15mi |
| 3908 Ortiz Ct NE Unit A Albuquerque, NM | 2.0 | 1.0 | 754 | $1,350 | $1.79 | 3d | 1 | 1.20mi |
| 4300 Bryn Mawr Dr NE Albuquerque, NM | 2.0 | 1.0–2.0 | 797 | $1,520 | $1.91 | 43d | 3 | 1.27mi |
| 4321 Montgomery Blvd NE Albuquerque, NM | 3.0 | 1.0–2.0 | 900 | $1,450 | $1.61 | 43d | 19 | 1.27mi |
| 4401 Montgomery Blvd NE Albuquerque, NM | 1.0–3.0 | 1.0–2.0 | 1060 | $1,815 | $1.71 | 43d | 14 | 1.32mi |
| 4300 Pan American Fwy NE Albuquerque, NM | 3.0 | 1.0–2.0 | 744 | $1,745 | $2.35 | 3d | 17 | 1.33mi |
| 1428 Vassar Dr NE Unit C Albuquerque, NM | 3.0 | 1.5 | 1500 | $2,150 | $1.43 | 3d | 1 | 1.34mi |
| 3901 Montgomery Blvd NE Albuquerque, NM | 1.0–2.0 | 1.0–2.0 | 768 | $1,305 | $1.70 | 14d | 9 | 1.38mi |
| 5801 Haines Ave NE Albuquerque, NM | 2.0 | 1.0 | 650 | $1,100 | $1.69 | 14d | 2 | 1.41mi |
| 1315 Dartmouth Dr NE Albuquerque, NM | 3.0 | 2.0 | 1200 | $1,000 | $0.83 | 43d | 1 | 1.41mi |
| 5404 Montgomery Blvd NE Albuquerque, NM | 1.0–3.0 | 1.0–3.0 | 1502 | $2,800 | $1.86 | 3d | 8 | 1.47mi |
Listing history 3 events
-
2026-05-11status Pending
-
2026-05-07$200,000 Active
-
2005-08-30soldstatus
ⓘ Source: listings_history table (triggers on properties + properties_extension) + one-shot
backfill from property_details.listing_events for pre-trigger history.
Tax reassessment forecast NM · Resets to sale price
- Current annual tax
- $1,895 · $158/mo
- Projected year-2 tax
- $1,895 · $158/mo
- Expected delta
- $0/yr ($0/mo · 0.0%)
ⓘ Screening estimate from a state-policy table — verify with the county assessor before closing.
Climate risk First Street
- Flood 1/10 Low FEMA zone X (unshaded) · 0% chance over 30 yrs
- Wildfire 1/10 Low
- Heat 5/10 Major 7 d/yr ≥95°F today · 16 d/yr by 30 yrs out
- Wind 1/10 Low
- Air quality 2/10 Low 1 unhealthy d/yr today · 3 by 30 yrs out
Nearby sold comps map
Loading sold comps map…
Walkable amenities ~0.75 mi
Loading nearby amenities…
Taxation est. · year 1
- Rental income
- $19,320
- − Mortgage interest
- −$11,203
- − Property taxes
- −$1,895
- − Insurance
- −$1,000
- − Repairs & maintenance
- −$1,546
- − Management
- −$1,546
- − Depreciation
- −$5,818
- Taxable loss
- −$3,688
- Est. tax savings @ 24.0%
- +$885
- After-tax cash flow
- $666/yr
For passive investors: Depreciation is non-cash, so a rental often shows a tax loss while cash-flowing — sheltering income. Rental losses are passive: they offset passive income freely, and up to $25,000/yr can offset ordinary (W-2) income if you actively participate and your MAGI is under $100k (phasing out to $0 by $150k); unused losses carry forward. On sale, claimed depreciation is recaptured at up to 25%, and gains may owe capital-gains tax (a 1031 exchange can defer both). Figures are a year-1 estimate at your 24.0% rate — not tax advice; consult a CPA.
Schools (NCES district)
- District
- Albuquerque Public Schools
- NCES district ID
- 3500060
- Math proficiency
- 51% ▲ 30.00%
- Reading proficiency
- 75% ▲ 45.00%
- Median HH income
- $48,151
- Composite
- 53.29/100
- National rank
- #1487
- State rank
- #3 of 29 in NM
Livability — Albuquerque
- Score
- 72/100
- State rank
- #13
- US rank
- #6219
Category grades
Schools grade is shown separately in the Schools card above.
Census & demographics
- Census place
- Albuquerque, NM
- County
- Bernalillo County · 647,165 people
- City population
- 647,165
- Metro
- Albuquerque, NM
- Population (ZIP)
- 39,685
- Household income
- $64,892
- Rent vs Own
- Severe rent burden
- 1845.0
Population outlook (Bernalillo County) Hauer SSP2
- Today (2025)
- 704,528 people
- By 2030
- 711,723 · +1.0%
- By 2040
- 714,522 · +1.4%
- By 2050
- 709,274 · +0.7%
- By 2075
- 680,015 · -3.5%
- By 2100
- 619,879 · -12.0%
Race, ethnicity, and origin ACS 2023
- Neighborhood character
- Diverse neighborhood (Simpson 0.65)
- Race & ethnicity
- White 44% Hispanic / Latino 39% Two or more races 18% Native American 5% Black 4% Asian 2%
- Hispanic origin (detail)
- Mexican 22%
- Common ancestry
- Lithuanian 2% Italian 2% Iranian 2%
- Foreign-born
- 8% · Canada, China, Vietnam
- Languages at home
- 80% English-only · Spanish 14% Chinese 1% Other Indo-European 1%
Political lean MEDSL · Bernalillo
- 2024 margin
- Strong D (+21.0) · D 59.2% · R 38.2% · Other 2.6%
- 2008→2024 swing
- -0.3pp no change · 2008: 21.4pp · 2024: 21.0pp
- All cycles
- 2024: D+21.0 2020: D+24.4 2016: D+17.8 2012: D+16.2 2008: D+21.4
Not yet ingested
- Civics
- —
Market trends
- HPI YoY
- ▼ -329.45%
- Current HPI
- 256.0806
- Rent YoY
- ▲ 2.67%
- Metro
- Albuquerque, NM
- State GDP YoY
- —
- F500 in state
- 0
Price history
3 events — show timeline
- 2026-05-11 Pending — Southwest MLS
- 2026-05-07 Listed $200,000 Southwest MLS
- 2005-08-30 Sold (Public Records) — Public Records
Property tax history
+2.3%/yrLatest (2025): $1,895 · +3.2% YoY. Source: county tax records.
Cash-flow waterfall
monthlySold comps — $/sqft
last 12 mo · ≤1 miLoading sold comps…